 IST,
IST,


III. Monetary and Liquidity Conditions
Monetary Survey
Monetary conditions have remained comfortable during 2005-06 so far despite a sustained pick-up in credit demand from the commercial sector. Banks were able to finance the higher demand for commercial credit by curtailing their incremental investments in Government securities. Strong growth in deposits in the current fiscal year and higher investments by non-bank sources in Government securities also enabled banks to meet credit demand. Concomitantly, reserve money expansion was high, reflecting a lower order of sterilisation operations by the Reserve Bank. Broad money (M3) growth, on a year-on-year basis, was above the indicative trajectory of 14.5 per cent projected in the Annual Policy Statement (April 2005) (Chart 11). Expansion in the residency-based new monetary aggregate (NM3) – which excludes foreign currency non-resident deposits – was higher than M3 on account of net outflows under foreign currency deposits and continued access of banks to call/term borrowings (Table 15).
Currency demand fell in the second quarter in line with the trend in the previous year. Year-on-year growth in currency, which was lower than a year ago till mid-September 2005, however, edged up during the last fortnight of September (Chart 12).
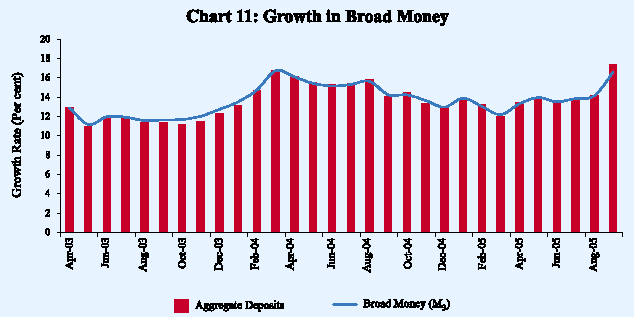
Table 15: Monetary Indicators
|
(Amount in Rupees crore) |
|||||||||
|
Item |
Outstanding |
Variation (year-on-year) |
|||||||
|
as on September |
|||||||||
|
2004 |
2005 |
||||||||
|
30, 2005 |
|||||||||
|
Amount |
Per cent |
Amount |
Per cent |
||||||
|
1 |
2 |
3 |
4 |
5 |
6 |
||||
|
I. |
Reserve Money* |
5,17,693 |
66,894 |
18.0 |
78,521 |
17.9 |
|||
|
II. |
24,65,763 |
2,69,186 |
14.6 |
3,51,296 |
16.6 |
||||
|
Broad Money (M3) |
|||||||||
|
a) |
Currency with the Public |
3,63,925 |
36,746 |
12.9 |
42,534 |
13.2 |
|||
|
b) |
Aggregate Deposits |
20,96,624 |
2,29,581 |
14.8 |
3,10,587 |
17.4 |
|||
|
i) |
Demand Deposits |
3,32,074 |
35,577 |
15.8 |
70,821 |
27.1 |
|||
|
ii) |
Time Deposits |
17,64,550 |
1,94,004 |
14.6 |
2,39,767 |
15.7 |
|||
|
of which: Non-Resident Foreign Currency Deposits |
76,507 |
4,373 |
6.0 |
-214 |
-0.3 |
||||
|
III. |
24,28,068 |
2,80,460 |
15.7 |
3,58,217 |
17.3 |
||||
|
NM3 |
|||||||||
|
of which: Call Term Funding from Financial Institutions |
42,168 |
11,039 |
57.3 |
11,851 |
39.1 |
||||
|
IV. |
a) |
25,23,954 |
2,97,864 |
16.1 |
3,74,434 |
17.4 |
|||
|
L1 |
|||||||||
|
of which: Postal Deposits |
95,885 |
17,404 |
28.0 |
16,217 |
20.4 |
||||
|
b) |
25,25,605 |
2,98,629 |
16.1 |
3,69,290 |
17.1 |
||||
|
L2 |
|||||||||
|
of which: FI Deposits |
1,651 |
765 |
12.7 |
-5,144 |
-75.7 |
||||
|
c) |
25,45,445 |
2,97,505 |
15.8 |
3,69,886 |
17.0 |
||||
|
L3 |
|||||||||
|
of which: NBFC Deposits |
19,840 |
-1,124 |
-5.5 |
596 |
3.1 |
||||
|
V. |
Major Sources of Broad Money |
||||||||
|
a) |
Net Bank Credit to the Government (i+ii) |
7,42,354 |
29,127 |
4.1 |
-4,648 |
-0.6 |
|||
|
i) |
Net Reserve Bank Credit to Government |
-33,950 |
-67,737 |
-42,644 |
|||||
|
of which: to the Centre |
-33,909 |
-64,453 |
-41,776 |
||||||
|
ii) |
Other Banks’ Credit to Government |
7,76,304 |
96,863 |
15.1 |
37,996 |
5.1 |
|||
|
b) |
Bank Credit to Commercial Sector |
14,07,816 |
1,82,459 |
19.6 |
2,95,557 |
26.6 |
|||
|
of which: Scheduled Commercial Banks’ Non-food Credit |
11,83,909 |
1,79,586 |
24.9 |
2,83,553 |
31.5 |
||||
|
c) |
Net Foreign Exchange Assets of Banking Sector |
6,60,700 |
1,47,770 |
34.2 |
81,075 |
14.0 |
|||
|
* : As on October 14, 2005. FIs: Financial Institutions. NBFCs: Non-banking Financial Companies. |
|||||||||
Growth in demand deposits remained high in tandem with the sustained pick-up in non-food credit and a buoyant primary capital market, with funds getting temporarily parked in demand deposits (Table 16).
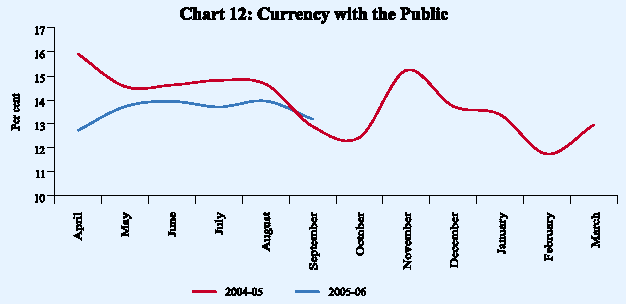
Table 16: Monetary Aggregates – Variations
|
(Rupees crore) |
||||||||
|
2004-05 |
2005-06 |
|||||||
|
Item |
2004-05 |
Q1 |
Q2 |
Q3 |
Q4 |
Q1 |
Q2 |
|
|
1 |
2 |
3 |
4 |
5 |
6 |
7 |
8 |
|
|
(=1+2+3 = 4+5+6+7-8) |
2,48,262 |
69,831 |
16,999 |
53,459 |
1,07,974 |
1,05,850 |
1,09,544 |
|
|
M3 |
||||||||
|
Components |
||||||||
|
1. |
Currency with the Public |
40,797 |
14,540 |
-3,098 |
15,422 |
13,933 |
19,671 |
-11,514 |
|
2. |
Aggregate Deposits with Banks |
2,06,106 |
56,754 |
19,342 |
37,725 |
92,284 |
87,737 |
1,20,764 |
|
2.1 Demand Deposits with Banks |
25,391 |
-14,038 |
2,094 |
15,721 |
21,614 |
11,401 |
36,657 |
|
|
2.2 Time Deposits with Banks |
1,80,716 |
70,792 |
17,248 |
22,004 |
70,671 |
76,337 |
84,107 |
|
|
3. |
‘Other’ Deposits with RBI |
1,359 |
-1,463 |
755 |
311 |
1,756 |
-1,558 |
294 |
|
Sources |
||||||||
|
4. |
Net Bank Credit to Government Sector |
15,002 |
12,986 |
-11,798 |
-4,524 |
18,338 |
6,980 |
-10,339 |
|
4.1 RBI’s Net Bank Credit to Government Sector |
-62,882 |
-34,143 |
-6,179 |
184 |
-22,744 |
9,275 |
-25,251 |
|
|
4.1.1 RBI’s Net Credit to Central Government |
-60,177 |
-30,029 |
-4,499 |
203 |
-25,852 |
14,600 |
-25,251 |
|
|
4.2 Other Bank Credit to Government Sector |
77,884 |
47,129 |
-5,619 |
-4,708 |
41,082 |
-2,295 |
14,912 |
|
|
5. |
Bank Credit to Commercial Sector |
2,64,389 |
38,057 |
40,093 |
1,07,789 |
78,451 |
64,221 |
95,737 |
|
6. |
Net Foreign Exchange Assets of Banking Sector |
1,22,669 |
49,206 |
-1,335 |
32,891 |
41,907 |
-13,378 |
24,823 |
|
6.1 Net Foreign Exchange Assets of RBI |
1,28,377 |
57,525 |
-5,260 |
31,462 |
44,651 |
-14,595 |
24,823 |
|
|
7. |
Governments’ Net Currency Liabilities to the Public |
152 |
37 |
9 |
89 |
17 |
47 |
26 |
|
8. |
Net Non-Monetary Liabilities of Banking Sector |
1,53,949 |
30,454 |
9,969 |
82,787 |
30,739 |
-47,979 |
703 |
|
Memo: |
||||||||
|
1. |
Non-resident Foreign Currency Deposits |
802 |
953 |
-189 |
-654 |
692 |
-494 |
596 |
|
2. |
SCBs’ Call-term Borrowing from Financial Institutions |
44,853 |
5,409 |
530 |
35,464 |
3,451 |
643 |
7,178 |
|
3. |
Overseas Borrowing by Scheduled Commercial Banks |
8,529 |
3,012 |
-658 |
6,267 |
-90 |
1,788 |
6,168 |
|
Note: Data include effect of conversion of a non-banking entity into a banking entity on October 11, 2005. |
||||||||
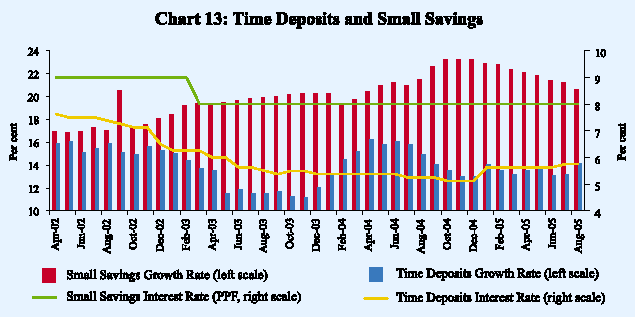
Year-on-year (y-o-y) growth in time deposits as on September 30, 2005 at 15.7 per cent was higher than a year ago, benefiting from modest increases in deposit rates and reflecting base effects of a low growth during the previous year. There was some deceleration in growth of small savings to 20.6 per cent by end-August 2005 from 23.3 per cent in December 2004. Nonetheless, the growth of small savings still remains substantially higher than that of time deposits reflecting both higher interest rates and tax incentives (Chart 13).
Food credit recorded a decline from its end-March 2005 level in line with a lower order of procurement of foodgrains. On the other hand, commercial sector’s demand for bank credit continued to remain strong reflecting a strengthening of the industrial recovery and demand for housing credit. Accordingly, scheduled commercial banks’ non-food credit, on a year-on-year basis, registered a growth of 31.5 per cent as on September 30, 2005 on top of a base as high as 24.9 per cent a year ago. Incremental credit-deposit ratio of SCBs remained above 100 per cent between November 2004 and August 2005 (Chart 14). Latest available data indicate that credit pick-up during April-August 2005 was quite broad-based. The high growth of credit to the priority sector reflected largely the sharp growth in agricultural credit as well as small housing loans (up to Rs.15 lakh). Amongst industries, credit to iron and steel, other metal and metal products, engineering, automobiles, cement, construction, paper, rubber, tobacco, textiles and gems and jewellery recorded an upsurge (see Table 35).
In addition to bank credit, industry has also increasingly relied upon non-bank sources of funds in recent years. Equity issuances continued to be steady during April-September 2005, benefiting from buoyancy in capital markets. Mobilisation through issuances of commercial papers also remained strong. Funds raised through external commercial borrowings (ECBs), which were large during 2004-05, moderated. This was mainly on account of turnaround in short-term trade credits as oil companies increased their recourse to domestic financing (Table 17).
Sustained high growth in commercial credit was funded by the banks mainly by restricting their incremental investments in Government securities. Incremental investments by commercial and co-operative banks in the Government papers at Rs.12,617 crore in the current fiscal (up to September 30) were less than one-third of
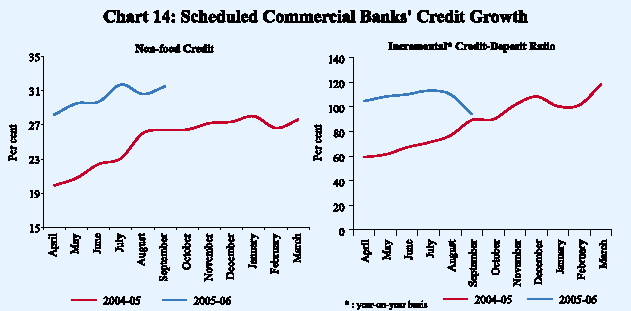
Table 17: Select Sources of Funds to Industry
|
(Rupees crore) |
||||||||||
|
Item |
2004-05 |
2005-06 |
||||||||
|
Q1 |
Q2 |
Q3 |
Q4 |
Q1 |
Q2 |
|||||
|
1 |
2 |
3 |
4 |
5 |
6 |
7 |
||||
|
A. |
Bank Credit to Industry |
6,636 |
11,186 |
13,733 |
21,680 |
11,148 |
14,698 |
@ |
||
|
B. |
Flow from Non-banks to Corporates |
|||||||||
|
1. |
Capital Issues* (i+ii) |
228 |
4,529 |
3,214 |
2,495 |
1,254 |
4,977 |
|||
|
i) Non-Government Public Ltd. Companies (a+b) |
228 |
4,529 |
530 |
2,495 |
1,254 |
4,977 |
||||
|
a) Bonds / Debentures |
0 |
0 |
0 |
0 |
118 |
0 |
||||
|
b) Shares |
228 |
4,529 |
530 |
2,495 |
1,136 |
4,977 |
||||
|
ii) PSUs and Government Companies |
0 |
0 |
2,684 |
0 |
0 |
0 |
||||
|
2. |
ADR / GDR / FCCBs + |
770 |
597 |
872 |
721 |
789 |
739 |
|||
|
3. |
External Commercial Borrowings (ECBs) $ |
12,199 |
3,860 |
11,084 |
11,744 |
3,026 |
- |
|||
|
4. |
Issue of CPs |
1,819 |
421 |
1,901 |
963 |
3,562 |
1,928 |
|||
|
C. |
Depreciation Provision |
5,504 |
5,836 |
5,731 |
6,106 |
7,137 |
- |
|||
|
D. |
Profit after Tax |
10,396 |
13,004 |
13,196 |
16,798 |
16,726 |
- |
|||
|
*: Gross issuances excluding issues by banks and financial institutions. |
||||||||||
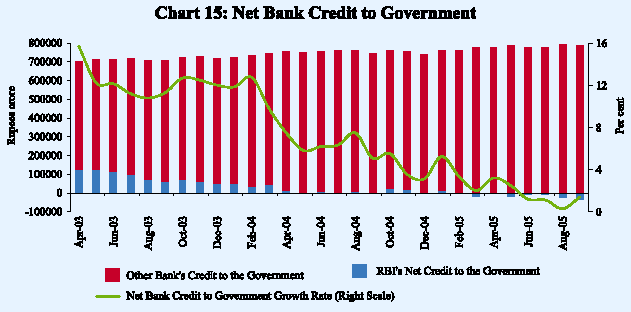
their incremental investments in the corresponding period of the previous year. Consequently, commercial banks’ holding of Government securities fell below 36 per cent of their net demand and time liabilities (NDTL) as on September 30, 2005 from nearly 40 per cent a year ago, but still substantially in excess of the statutory requirement of 25 per cent (Chart 15).
Reserve Money Survey
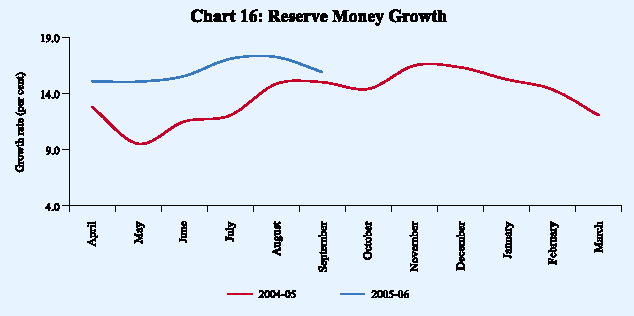
Reserve money growth as on October 14, 2005 at 17.9 per cent was almost the same as that a year ago (18.0 per cent), although the growth rate during 2005-06 till October 7, 2005 had remained consistently above that of 2004-05 (Chart 16). The higher growth in reserve money, despite broadly a similar order of accretion to the
Reserve Bank’s net foreign exchange assets (NFEA) (net of revaluation) during the current fiscal, primarily reflected the relatively lower order of sterilisation operations. This, in turn, reflected a lower appetite for Government securities by the banking system in view of strong credit demand from the commercial sector. The higher order of expansion in the reserve money was also due to the impact of the increase in the cash reserve ratio (CRR) by 50 basis points during September-October 2004.
The Reserve Bank’s foreign currency assets (net of revaluation) increased by Rs.29,544 crore during fiscal 2005-06 (up to October 14), comparable to that of Rs.30,604 crore during the corresponding period of 2004-05. Most of the increase in the NFEA was concentrated in the second quarter of the fiscal and consequently the quarter also witnessed liquidity absorption operations (Chart 17 and Table 18).
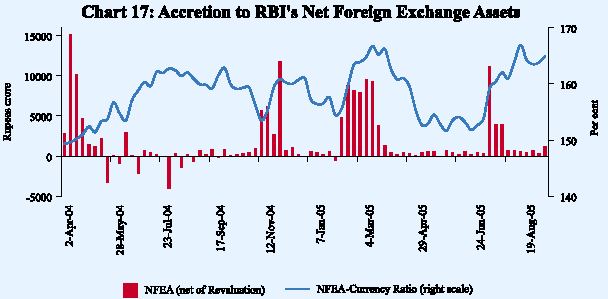
Table 18: Variation in Major Components and Sources of Reserve Money
|
(Rupees crore) |
||||||||
|
Item |
2004-05 |
2005-06 |
2004-05 |
2005-06 |
||||
|
(up to |
||||||||
|
Oct. 14) |
Q1 |
Q2 |
Q3 |
Q4 |
Q1 |
Q2 |
||
|
1 |
2 |
3 |
4 |
5 |
6 |
7 |
8 |
9 |
|
Reserve Money |
52,623 |
28,557 |
-6,812 |
-6,285 |
31,546 |
34,174 |
6,856 |
159 |
|
Components |
||||||||
|
1. Currency in Circulation |
41,633 |
22,516 |
14,317 |
-4,166 |
16,467 |
15,015 |
19,556 |
-10,378 |
|
2. Bankers’ Deposits with RBI |
9,631 |
7,431 |
-19,665 |
-2,874 |
14,769 |
17,401 |
-10,680 |
9,780 |
|
3. Other Deposits with RBI |
1,359 |
-1,389 |
-1,463 |
755 |
310 |
1,757 |
-2,021 |
757 |
|
Sources |
||||||||
|
1. RBI’s net credit to Government |
-62,882 |
6,641 |
-34,143 |
-6,179 |
184 |
-22,744 |
9,275 |
-25,251 |
|
of which: to Central Government |
-60,177 |
11,897 |
-30,029 |
-4,499 |
203 |
-25,852 |
14,600 |
-25,251 |
|
2. RBI’s credit to banks and commercial sector |
-833 |
-1,377 |
-2,985 |
-740 |
3,726 |
-835 |
1,155 |
-1,869 |
|
3. NFEA of RBI |
1,28,377 |
24,272 |
57,525 |
-5,260 |
31,462 |
44,651 |
-14,595 |
24,823 |
|
4. Government’s Currency Liabilities to the Public |
152 |
73 |
37 |
9 |
89 |
17 |
63 |
10 |
|
5. Net Non-Monetary Liabilities of RBI |
12,191 |
1,052 |
27,245 |
-5,885 |
3,916 |
-13,085 |
-10,957 |
-2,446 |
|
Memo: |
||||||||
|
1. Net Domestic Assets |
-75,754 |
4,285 |
-64,336 |
-1,025 |
84 |
-10,477 |
21,450 |
-24,664 |
|
2. FCA adjusted for revaluation |
1,15,044 |
29,544 |
33,160 |
-3,413 |
29,858 |
55,440 |
5,034 |
23,665 |
|
3. Net Purchases from Authorised Dealers |
91,105 |
17,878 * |
30,032 |
-9,789 |
22,771 |
48,091 |
0 |
17,878 * |
|
4. NFEA/Reserve Money (per cent) (end-period) |
125.3 |
123.1 |
126.1 |
126.7 |
124.9 |
125.3 |
120.6 |
125.6 |
|
5. NFEA/Currency (per cent) (end-period) |
166.2 |
162.9 |
158.8 |
159.2 |
160.7 |
166.2 |
154.1 |
164.9 |
|
* : Up to August 26, 2005. NFEA : Net Foreign Exchange Assets. FCA : Foreign Currency Assets. |
||||||||
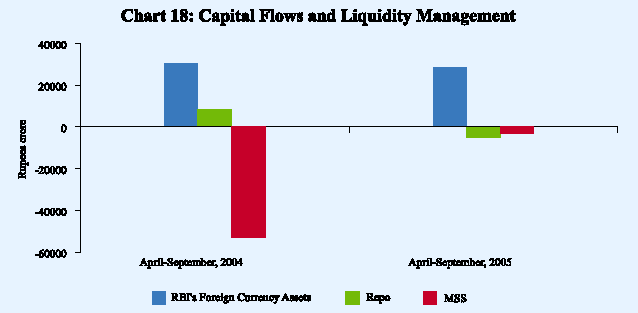
Liquidity absorption operations during 2005-06 so far have mainly been in the form of reverse repo operations under the liquidity adjustment facility (LAF) in contrast to a heavy reliance on issuances under the market stabilisation scheme (MSS) during the comparable period of the preceding year (Chart 18).
In the absence of any subscription to the Government’s market borrowing programme, the Reserve Bank’s net credit to the Centre reflected liquidity management operations of the Bank (Table 19). The Reserve Bank’s net credit to the Centre increased by Rs.11,897 crore during 2005-06 (up to October 14) as against a substantial decline of Rs.21,395 crore during the comparable period of 2004-05.
Table 19: Net Reserve Bank Credit to the Centre - Variations
|
(Rupees crore) |
|||||||||
|
Item |
2004-05 |
2005-06 |
2004-05 |
2005-06 |
|||||
|
(up to |
|||||||||
|
Oct. 14) |
Q1 |
Q2 |
Q3 |
Q4 |
Q1 |
Q2 |
|||
|
1 |
2 |
3 |
4 |
5 |
6 |
7 |
8 |
9 |
|
|
Net Reserve Bank Credit to the |
|||||||||
|
Centre (1+2+3+4-5) |
-60,177 |
11,897 |
-30,029 |
-4,499 |
203 |
-25,852 |
14,600 |
-25,251 |
|
|
1. |
Loans and Advances |
0 |
0 |
3,222 |
-3,222 |
0 |
0 |
0 |
0 |
|
2. |
Treasury Bills held by the Reserve Bank |
0 |
0 |
0 |
0 |
0 |
0 |
0 |
0 |
|
3. |
Reserve Bank’s Holdings of |
||||||||
|
Dated Securities |
12,323 |
6,952 |
-2,900 |
22,176 |
14,095 |
-21,048 |
8,221 |
-17,243 |
|
|
4. |
Reserve Bank’s Holdings of |
||||||||
|
Rupee Coins |
58 |
119 |
175 |
-11 |
-93 |
-15 |
-40 |
-33 |
|
|
5. |
Central Government Deposits |
72,558 |
-4,826 |
30,525 |
23,443 |
13,799 |
4,791 |
-6,419 |
7,974 |
|
Memo * |
|||||||||
|
1. |
Market Borrowings of Dated |
||||||||
|
Securities by the Centre # |
80,350 |
84,000 |
28,000 |
26,000 |
14,000 |
12,350 |
42,000 |
39,000 |
|
|
2. |
Reserve Bank’s Primary |
||||||||
|
Subscription to Dated Securities |
1,197 |
0 |
0 |
847 |
0 |
350 |
0 |
0 |
|
|
3. |
Repos (+) / Reverse Repos (-) (LAF), |
||||||||
|
net position |
15,315 |
10,075 |
-26,720 |
34,205 |
27,600 |
-19,770 |
9,660 |
-14,835 |
|
|
4. |
Net Open Market Sales £ |
2,899 |
2,521 |
429 |
427 |
871 |
1,171 |
1,543 |
941 |
|
5. |
Mobilisation under MSS |
64,211 |
4,065 |
37,812 |
14,444 |
353 |
11,602 |
7,469 |
-4,353 |
|
6. |
Primary Operations $ |
-6,625 |
37,485 |
37,353 |
-30,484 |
-36,984 |
23,490 |
18,205 |
15,167 |
|
* : At face value. #: Excluding Treasury Bills. |
|||||||||
Liquidity Management
During 2005-06 so far (up to October 14, 2005), the Reserve Bank’s operations to absorb liquidity from the system have been relatively moderate in view of the marked increase in merchandise trade deficit and the pick-up in domestic credit demand. Liquidity management operations during 2005-06 so far can be analysed in terms of three phases (Table 20). The first period –beginning end-March 2005 up to July 22, 2005 – did not witness purchases from the foreign exchange market by the Reserve Bank reflecting a sharp widening of the trade deficit. Moreover, the period also witnessed FII outflows during April-May 2005. Although FII inflows bounced back during June 2005, foreign
Table 20: Phases of Reserve Bank’s Liquidity Management Operations
|
(Rupees crore) |
|||||||||
|
2004-05 |
2005-06 |
||||||||
|
Item |
March 27 - |
May 15 - |
October 30, |
April 1 - |
July 23 - |
August 13 - |
|||
|
May 14, |
October 29, |
2004 - |
July 22, |
August 12, |
October 14, |
||||
|
2004 |
2004 |
March 31, |
2005 |
2005 |
2005 |
||||
|
2005 |
|||||||||
|
1 |
2 |
3 |
4 |
5 |
6 |
7 |
|||
|
A. Drivers of Liquidity (1+2+3) |
37,170 |
-24,746 |
44,009 |
-6,959 |
28,014 |
-24,455 |
|||
|
1. |
RBI’s Foreign Currency Assets |
||||||||
|
(adjusted for revaluation) |
37,919 |
-4,614 |
83,662 |
6,412 |
19,348 |
3,785 |
|||
|
2. |
Currency with the Public |
-20,021 |
6,365 |
-25,622 |
-14,828 |
-1,307 |
-5,360 |
||
|
3. |
Others (residual) |
19,272 |
-26,497 |
-14,031 |
1,457 |
9,973 |
-22,880 |
||
|
3.1 Surplus cash balances of the |
|||||||||
|
Centre with the Reserve Bank |
15,355 |
-18,481 |
-7,721 |
6,053 |
5,972 |
-12,666 |
|||
|
B. |
Management of Liquidity |
||||||||
|
(4+5+6+7) |
-40,148 |
37,960 |
-31,852 |
1,329 |
-24,567 |
35,090 |
|||
|
4. |
Liquidity impact of LAF Repos |
-12,095 |
66,040 |
-11,875 |
8,845 |
-26,565 |
27,795 |
||
|
5. |
Liquidity impact of OMO (net)* |
-277 |
-769 |
-1,853 |
0 |
0 |
0 |
||
|
6. |
Liquidity impact of MSS |
-27,776 |
-27,311 |
-9,124 |
-7,516 |
1,998 |
7,295 |
||
|
7. |
First round liquidity impact |
||||||||
|
due to CRR change |
0 |
0 |
-9,000 |
0 |
0 |
0 |
|||
|
C. |
Bank Reserves # (A+B) |
-2,978 |
13,214 |
12,157 |
-5,630 |
3,447 |
10,635 |
||
|
+:Indicates injection of liquidity into the banking system. |
|||||||||
exchange markets were more or less balanced reflecting pressures from the trade deficit. During this phase, in the face of sustained credit demand, banks curtailed their incremental investments in the Government securities and reduced their operations under the Reserve Bank’s reverse repo window. Consequently, the Reserve Bank injected primary liquidity through reversal of reverse repo operations.
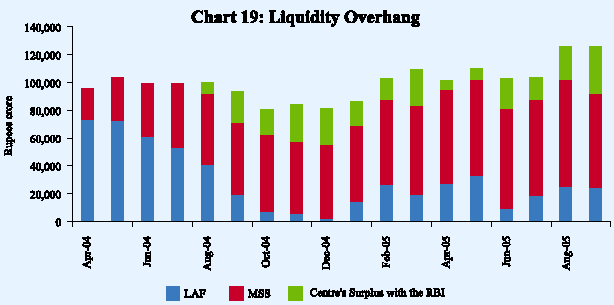
During July 23 - August 12, following the revaluation of the Chinese currency, there were large foreign exchange inflows. Moreover, there was a reduction in the Centre’s surplus investment balances. As a result, the balances under LAF reverse repo increased sharply from Rs.10,485 crore as on July 22 to Rs.37,050 crore as on August 12, peaking at Rs.50,610 crore on August 3, 2005. In the subsequent period (August 13 – October 14), again, accretion to the Reserve Bank’s foreign exchange assets (net of revaluation) slowed down. Government surplus balances with the Reserve Bank started bouncing back leading to locking up of liquidity. Accordingly, the period witnessed injection of liquidity through reversal of reverse repos as balances under LAF were unwound (Table 21 and Chart 19).
Table 21: Liquidity Overhang
|
(Rupees crore) |
||||
|
Outstanding as on |
LAF |
MSS |
Centre’s Surplus |
Total |
|
last Friday/March 31 |
with the RBI @ |
(2 to 4) |
||
|
1 |
2 |
3 |
4 |
5 |
|
2004 |
||||
|
April |
73,075 |
22,851 |
0 |
95,926 |
|
May |
72,845 |
30,701 |
0 |
1,03,546 |
|
June |
61,365 |
37,812 |
0 |
99,177 |
|
July |
53,280 |
46,206 |
0 |
99,486 |
|
August |
40,640 |
51,635 |
7,943 |
1,00,218 |
|
September |
19,245 |
52,255 |
21,896 |
93,396 |
|
October |
7,455 |
55,087 |
18,381 |
80,923 |
|
November |
5,825 |
51,872 |
26,518 |
84,215 |
|
December |
2,420 |
52,608 |
26,517 |
81,545 |
|
2005 |
||||
|
January |
14,760 |
54,499 |
17,274 |
86,533 |
|
February |
26,575 |
60,835 |
15,357 |
1,02,767 |
|
March |
19,330 |
64,211 |
26,102 |
1,09,643 |
|
April |
27,650 |
67,087 |
6,449 |
1,01,186 |
|
May |
33,120 |
69,016 |
7,974 |
1,10,110 |
|
June |
9,670 |
71,681 |
21,745 |
1,03,096 |
|
July |
18,895 |
68,765 |
16,093 |
1,03,753 |
|
August |
25,435 |
76,936 |
23,562 |
1,25,933 |
|
September |
24,505 |
67,328 |
34,073 |
1,25,906 |
|
October* |
9,255 |
68,276 |
26,743 |
1,04,274 |
|
* As on October 14, 2005. |
||||
Stable and comfortable liquidity conditions kept the call money rates close to the level of the reverse repo rate (Chart 20). With the increase in the fixed reverse repo rate from 4.75 per cent to 5.00 per cent, effective April 2005, call rates also edged up in the subsequent period. In view of comfortable liquidity
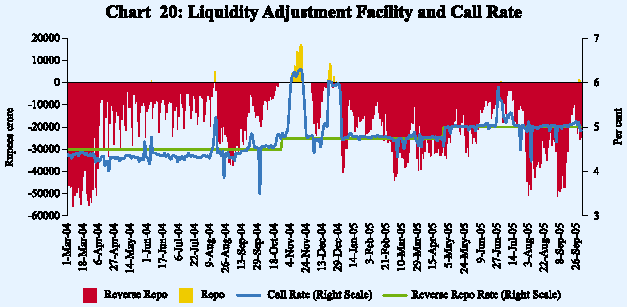
conditions, the Reserve Bank conducted LAF repos only on four occasions during 2005-06 (June 28, June 30, September 28 and September 29, 2005) of Rs.210 crore, Rs.575 crore, Rs.1,640 crore and Rs.1,000 crore, respectively. On a net basis, the Reserve Bank, however, absorbed liquidity even on those four days.

ఈ పేజీని షేర్ చేయండి:


భారతీయ రిజర్వ్ బ్యాంక్ మొబైల్ అప్లికేషన్ను ఇన్స్టాల్ చేయండి మరియు తాజా వార్తలకు త్వరిత యాక్సెస్ పొందండి!
మా యాప్ను ఇన్స్టాల్ చేయడానికి QR కోడ్ను స్కాన్ చేయండి


పేజీ చివరిగా అప్డేట్ చేయబడిన తేదీ:


