 IST,
IST,


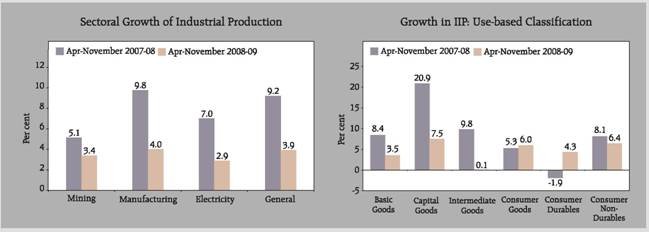
29. Group-wise index numbers of industrial production
Sr. No. |
Industry |
Weight |
Annual |
Cumulative |
Monthly |
||||
2005-06 |
2006-07 |
2007-08 (P) |
April -November |
November |
|||||
2007-08 |
2008-09 P |
2007 |
2008 P |
||||||
1 |
2 |
3 |
4 |
5 |
6 |
7 |
8 |
9 |
10 |
General Index |
100.00 |
221.5 |
247.1 |
268.0 |
258.6 |
268.7 |
261.0 |
267.2 |
|
I. |
Sectoral Classification |
||||||||
1 |
Mining and Quarrying |
10.47 |
154.9 |
163.2 |
171.6 |
162.3 |
167.8 |
174.2 |
175.0 |
2 |
Manufacturing |
79.36 |
234.2 |
263.5 |
287.2 |
276.7 |
287.9 |
278.9 |
285.7 |
3 |
Electricity |
10.17 |
190.9 |
204.7 |
217.7 |
216.4 |
222.6 |
210.9 |
217.5 |
II. |
Use-Based Classification |
||||||||
1 |
Basic Goods |
35.57 |
189.8 |
209.3 |
223.9 |
218.6 |
226.3 |
220.8 |
225.9 |
2 |
Capital Goods |
9.26 |
265.8 |
314.2 |
370.8 |
348.7 |
375.0 |
392.1 |
383.2 |
3 |
Intermediate Goods |
26.51 |
216.4 |
242.4 |
264.1 |
261.5 |
261.8 |
255.7 |
262.3 |
4 |
Consumer Goods |
28.66 |
251.4 |
276.8 |
293.6 |
276.9 |
293.4 |
273.5 |
285.6 |
4(a) |
Consumer Durables |
5.36 |
349.9 |
382.0 |
378.0 |
375.1 |
391.4 |
368.4 |
353.1 |
4(b) |
Consumer Non-Durables |
23.30 |
228.8 |
252.6 |
274.2 |
254.4 |
270.8 |
251.7 |
270.0 |
Source : Central Statistical Organisation, Government of India. |
|||||||||

ఈ పేజీని షేర్ చేయండి:


భారతీయ రిజర్వ్ బ్యాంక్ మొబైల్ అప్లికేషన్ను ఇన్స్టాల్ చేయండి మరియు తాజా వార్తలకు త్వరిత యాక్సెస్ పొందండి!
మా యాప్ను ఇన్స్టాల్ చేయడానికి QR కోడ్ను స్కాన్ చేయండి


పేజీ చివరిగా అప్డేట్ చేయబడిన తేదీ:


