II. Aggregate Demand - ఆర్బిఐ - Reserve Bank of India
II. Aggregate Demand
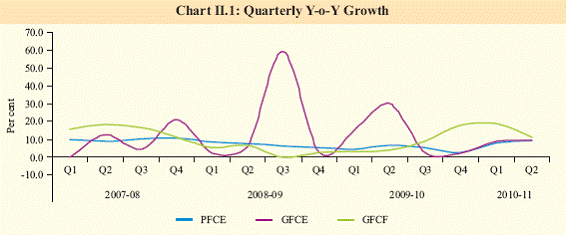
The domestic demand* led growth process continued and was characterised by stronger growth in private consumption expenditure and higher contribution of fixed capital formation to growth. Reflecting fiscal consolidation and slowdown in government expenditure in recent few months, contribution of government consumption expenditure to growth moderated. Corporate sales growth remained high while earnings improved, suggesting buoyancy in demand. As the external sector outlook broadly suggests widening of current account deficit, the contribution of net exports to growth could remain negligible. Private consumption expenditure and government capital expenditure have been the major growth drivers in the first half of the year II.1 During the first half of 2010-11, the growth impulse from the expenditure side of GDP emanated predominantly from the acceleration in private consumption expenditure and gross fixed capital formation (Table II.1 and Chart II.1). Private final consumption expenditure gathered pace reflecting partly the pick-up in agricultural growth. Gross fixed capital formation also showed higher growth supported by robust corporate sector performance and strong growth in capital expenditure by the Government. Overall, real GDP at market prices increased by 10.4 per cent during the first half of 2010-11, which was higher than the growth of 8.9 per cent in real GDP at factor cost. The differential in growth rates reflected higher net indirect taxes accruing to the government from stronger overall and industrial sector growth in the year. Furthermore, with substantial revision in expenditure side data for the first quarter of 2010-11, the trends in gross fixed capital formation and capital goods segment in IIP are now better aligned for the first half of the current fiscal.
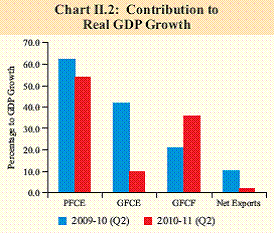
Contribution of government final consumption expenditure and net exports to overall growth reflects fiscal consolidation and widening current account deficit II.2 Government final consumption expenditure continued to grow at a robust pace but showed noticeable slackening relative to higher growth of last year, reflecting the impact of the resumption of the fiscal consolidation process (Table II.1). II.3 The contribution of net exports fell for the second successive quarter, though it still remained positive, even as the deficit in the goods and services account persisted (Chart II.2). The composition of government expenditure has shifted towards capital expenditure II.4 The Centre had budgeted a sharp reduction in expenditure growth for 2010-11 as a part of its gradual exit from the crisis-driven expansionary fiscal policy stance. However, the progress during 2010-11 (April-November) indicates a higher than budgeted growth in expenditure. The capital component of expenditure exhibited strong growth, which needs to be continued to address the growing infrastructure gap. Total expenditure growth, however, was substantially lower than the growth recorded during the corresponding period of 2009-10, as the Government lowered its expenditure since August 2010. The government intends to boost its expenditure in priority sectors, given the fiscal space available on account of higher than budgeted revenue receipts, which potentially could exert demand pressures. II.5 The higher than budgeted revenue receipts during 2010-11 (April-November) resulted from better than expected tax and non-tax collections. Apart from substantial non-tax revenues in the form of receipts through the 3G and broadband wireless access (BWA) spectrum auctions, gross tax revenue increased strongly (26.8 per cent) as against a decline (7.8 per cent) in 2009-10 (April-November). There have been significant increases in revenues from customs duty (64.2 per cent) and union excise duty (37.3 per cent) along with high growth in personal income tax collections (11.8 per cent) and corporate tax collections (19.9 per cent), reflecting mainly the buoyancy in domestic economic activity and international trade as well as the partial rollback of indirect tax rate reductions as part of the fiscal exit.
II.6 The Government is on track in anchoring its fiscal deficit to 5.5 per cent of GDP in 2010- 11. The mid-year targets for its key fiscal indicators were met for the first time since the enactment of Fiscal Responsibility and Budget Management (FRBM) Rules, 2004, benefiting from strong buoyancy in its revenue receipts. The progress in Central Government finances during 2010-11 (April-November) shows a lower growth in expenditure as compared to 2009-10, along with strong growth observed in tax and non-tax revenues. Consequently, revenue deficit (RD) and gross fiscal deficit (GFD) during 2010-11 (April-November) were substantially lower in absolute terms and as proportions of budget estimates, than those during the corresponding period of the previous year (Table II.2). Higher development expenditure necessary for inclusive growth II.7 Sector-wise profile of Government expenditure shows higher than budgeted growth in expenditure during 2010-11 (April- November) in agriculture, rural development, education and health, reflecting the Government’s commitment to inclusive and sustainable growth. The higher resource availability from excess revenues has created fiscal space for allocating higher outlays to these priority sectors, which was reflected in the Government’s additional supplementary demand for grants. Since lower inflation is a key factor to promote inclusive growth, the higher demand resulting from social expenditure also suggests the need to step up the rate of growth of essential items on the supply side.
Risks to fiscal consolidation over the medium term and quality of fiscal consolidation are important concerns II.8 Although Central Government finances are in line with the Medium Term Fiscal Policy Statement (MTFPS) roadmap, in order to meet the Thirteenth Finance Commission (TFC) target for RD and GFD (zero per cent and 3.0 per cent of GDP, respectively), steeper corrections would be necessary by 2013-14. The Government recognises that the envisaged elimination of RD by 2013-14 would be difficult. Furthermore, an abiding mediumterm objective is to use borrowings for financing capital expenditure as indicated by the Government in its Mid-Year Analysis, 2010-11. As per the economic and functional classification, expenditure of Central Government administration and departmental commercial undertakings in gross capital formation was budgeted to remain low (1.0 per cent of GDP) during 2010-11. Moreover, there is a likelihood of further increase in subsidies, in view of the rising international oil and fertiliser prices. Finally, global uncertainty, especially in Europe, continues to be a key downside risk to fiscal consolidation. II.9 The emphasis in the current phase of consolidation should be on the quality of adjustment, while also building adequate fiscal space to deal with future adverse shocks to growth and inflation. The fiscal correction envisaged during 2010-11 seems to rely significantly on one-off items (such as receipts from telecom spectrum auction and disinvestment proceeds). Furthermore, substantial proportion of the budgeted fiscal correction in 2010-11 is to be realised from the savings on account of lower than expected expenditure in respect of pay and pension arrears and loan waiver scheme. Durable fiscal consolidation, however, would require measures to augment revenue collection on a sustainable basis and rationalisation of recurring expenditure, with a focus on curtailing non-plan revenue expenditure. Combined fiscal gap likely to moderate as state government finances show improvement II.10 After witnessing deterioration in the previous two years, consolidated revenue deficit and gross fiscal deficit of State governments are estimated to fall in 2010-11 (BE) (Table II.3). The correction in the revenue account in 2010-11 is expected to come through increase in revenue receipts as well as compression in revenue expenditure (as ratio to GDP) and thus appears to be more balanced. Lower consolidated revenue deficit of State governments along with lower capital outlay as ratio to GDP is likely to result in lower GFDGDP ratio.
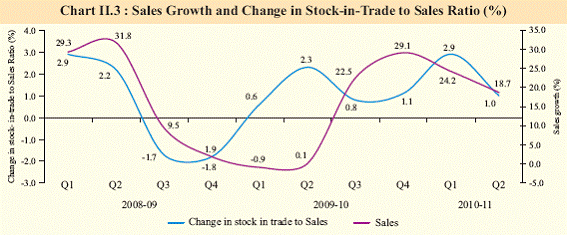
II.11 Combined finances of the Central and State governments budgeted for 2010-11 indicate that the key deficit indicators as per cent of GDP would moderate compared to the elevated levels of 2009-10 (Table II.3). Corporate sales growth remained high suggesting buoyancy in demand II.12 The private corporate sector contributed to the robust economic activity, and in turn, benefited from strong sales growth during the second quarter of 2010-11 (Table II.4). However, the build-up in inventory accumulation relative to sales moderated during the second quarter of 2010-11 compared to the recent peak observed during the first quarter of the financial year (Chart II.3). Compared to moderate growth in PAT of the private corporate sector, Government nonfinancial companies witnessed a noticeable rise driven by the robust performance of oil companies. II.13 Strong investment intentions, as reflected in higher envisaged capital expenditure of companies which approached banks/FIs for financial assistance during April-September 2010, indicate optimistic outlook for fixed capital formation. In the first half of 2010- 11, 338 projects were sanctioned assistance by banks/FIs involving about ` 2,42,000 crore as against 251 projects worth ` 2,31,000 crore during the corresponding period of the previous year. Sectoral imbalances require structural policies II.14 The rebound in private consumption partly reflected the low base effect, and hence, does not signal any broad based demand side pressure as yet. Sectoral demand-supply imbalances require structural policy intervention to improve the supply situation more than any demand compressing measures at the aggregate level. The stronger growth in private consumption expenditure partly reflects the change in terms-of-trade in favour of agriculture in view of the supply side constraints and the Government’s commitment towards its flagship programmes, such as MGNREGA. With the waning of the base effect, the recent momentum in sales growth of corporates, however, would be contingent, inter alia, on the sustained growth in final consumption expenditure. Fiscal consolidation ushered in by the Government is expected to further lower the relative contribution of government final consumption expenditure to growth even though the share of government fixed capital formation may increase. Fiscal consolidation, if sustained, can contribute to a low inflation regime to coexist with high growth. In the near-term, India’s policy option could be to pursue further diversification of exports in the fast growing emerging market economies to increase the contribution of the external sector to overall economic growth.
|
||||||||||||||||||||||||||||||||||||||||||||||||||||||||||||||||||||||||||||||||||||||||||||||||||||||||||||||||||||||||||||||||||||||||||||||||||||||||||||||||||||||||||||||||||||||||||||||||||||||||||||||||||||||||||||||||||||||||||||||||||||||||||||||||||||||||||||||||||||||||||||||||||||||||||||||||||||||||||||||||||||||||||||||||||||||||||||||||||||||||||||||||||||||||||||||||||||||||||||||||||||||||||||||||||||||||||||||||||||||||||||||||||||||||||||||||||||||||||||||||||||


