
North-East Monsoon 2012: An Overview (October - December) - ఆర్బిఐ - Reserve Bank of India


North-East Monsoon 2012: An Overview (October - December)
North-East Monsoon 2012: An Overview (October - December)* The North-East monsoon during October-December 2012 was 21 per cent below its long period average (LPA). Though deficient, the shortfall in rainfall during the season was less compared with the deficiencies witnessed in recent years. The overall production of rabi foodgrains in 2012-13 is estimated marginally lower at 125.5 million tonnes (128.1 million tonnes in 2011-12). At end of the season, area coverage under rabi crops was around 101 per cent of normal, and marginally higher than the previous year. Live storage to total storage capacity at 37 per cent as on March 14, 2013 for 84 major reservoirs is comparable with the previous year. IntroductionNorth-East monsoon which occurs during October-December, also called the post monsoon rainfall, is an important determinant of rabi crop production since it coincides with rabi sowing. The significance of North-East monsoon can be gauged further from the fact that wheat is a rabi crop and around 63 per cent of all pulses and 36 per cent of oilseeds are produced during rabi season every year. This article reviews the performance of North-East monsoon during October-December 2012. An Overview: North-East Monsoon 2012 Compared with the previous year when the North- East monsoon was around 48 per cent below LPA, a 21 per cent departure of rainfall in the current season from its normal has been relatively lower. The production of rabi pulses is estimated to record an increase of around 10 per cent to 12.1 million tonnes (11.0 million tonnes in 2011-12) in 2012-13 (Table 1). In fact, production of rabi pulses for the year is poised to attain record high. This is significant given the inadequacy of domestic supply of pulses. Cumulative Rainfall At all-India level, cumulative rainfall recorded during October-December 2012 measured 100.6 mm as against the normal of 127.2 mm, implying a deficiency of around 21 per cent. Twenty one (21) out of thirty six (36) sub-divisions of the country received deficient/scanty rainfall. However, some sub-divisions of the peninsula and eastern region received normal to excess rainfall. Temporal DistributionMonthly Five sub-divisions in the south peninsula, called the core region viz., Coastal Andhra Pradesh, Rayalaseema, Tamil Nadu & Puducherry, South Interior Karnataka and Kerala, in general receive more rainfall during October-December 2012 compared with the rest of the country. During October-December 2012, cumulative rainfall in these five sub-divisions was 93 per cent of LPA (-7 per cent deviation) as against 79 per cent (-21 per cent deviation) for the country as a whole (Table 2). The cumulative monthly distribution of rainfall over these 5 sub-divisions was 92 per cent, 129 per cent and 57 per cent, respectively, of LPA during October, November and December 2012.
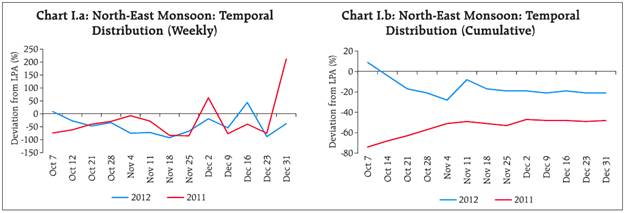
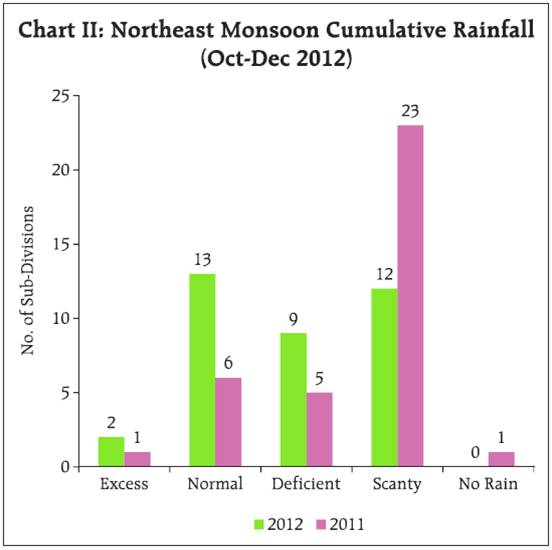
Weekly At all-India level, on a weekly basis, rainfall was below normal throughout the season barring one week at the beginning of the season and a week during mid- December (Chart I.a). Accordingly, the weekly cumulative also remained below LPA for most part of the period (Chart I.b). Spatial Distribution Coastal Andhra Pradesh within the core region received excess rainfall while Rayalaseema and Tamil Nadu & Puducherry received normal rainfall, and South Interior Karnataka and Kerala received deficient rainfall. Outside of the core region, some parts in eastern/north eastern region and parts of Central India on the other hand received excess or normal rainfall. Subdued rainfall during the period has been reflected in the spatial distribution of precipitation over the meteorological sub-divisions spread across the country. Of the 36 meteorological sub-divisions, cumulative rainfall was excess in 2 and normal in 13 (1 and 6 in the corresponding period last year), deficient in 9 and scanty in 12 sub-divisions (5 and 23 last year)1. However, there was no sub-division with nil rainfall during the current season against 1 last year (Chart II, Table 3 and Statement I). During the last ten years there were six years when North-East rainfall was deficient with the most severe deficiency being during 2011 (Table 4). District wise District-wise, out of 623 meteorological districts for which data were available, 31 per cent of the meteorological districts received excess/normal rainfall and the remaining 69 per cent received deficient/ scanty/no rainfall during the season (Statement II). The corresponding figures for the previous year were 13 per cent and 87 per cent, respectively.
Reservoir Status The Central Water Commission monitors total live water storage in 84 major reservoirs of the country, having full reservoir level of 154.421 billion cubic meters (BCM) that accounts for around 67 per cent of the total reservoir capacity of the country. Rainfall deficiency in South-West monsoon 2012 was reflected in the lower level of water in these reservoirs at the beginning of rabi season 2012. Live to total capacity in these reservoirs at end-September 2012 was 74 per cent as against 87 per cent the previous year. Water in these reservoirs continued to remain below the previous year during most part of the North-East monsoon period. The live to total capacity ratio at end- December 2012 was around 59 per cent as against 62 per cent in the previous year (Table 5). As on March 14, 2013, total live storage in 84 major reservoirs was 37 per cent of the full reservoir level (FRL) as compared with 38 per cent a year ago.
Progress of Sowing Despite deficiency of rainfall during October– December 2012, area coverage under all rabi crops at end of the season was marginally higher than the corresponding period last year. However, area coverage under wheat and rice continued to remain slightly lower than the level attained last year (Table 6).
Estimates of Agricultural Production: 2012-13 Production of foodgrains during 2012-13, as per the Second Advance Estimates, is placed at 250.1 million tonnes, 3.5 per cent lower than that of 259.3 million tonnes during 2011-12. Production of all crops other than pulses is estimated to decline during 2012- 13, reflecting largely the impact of rainfall deficiency during the South-West monsoon 2012. Production of sugarcane is also estimated to have declined during the current year (Table 7).
Conclusion The North-East monsoon during October- December 2012 was 21 per cent below normal as against 48 per cent below normal in the previous year. The production of most agricultural crops, with the exception of pulses and jute & mesta is estimated to record a decline during 2012-13. Agriculture sector is, therefore, likely to witness lower growth in 2012-13 as compared with 2011-12.
* Prepared in the Development Studies Division, Department of Economic and Policy Research, Reserve Bank of India. 1 Excess: + 20 per cent or more; Normal: +19 per cent to –19 per cent; Deficient: – 20 per cent to – 59 per cent; Scanty: – 60 per cent to – 99 per cent; No Rain: – 100 per cent (All with respect to the Long Period Average). |
|||||||||||||||||||||||||||||||||||||||||||||||||||||||||||||||||||||||||||||||||||||||||||||||||||||||||||||||||||||||||||||||||||||||||||||||||||||||||||||||||||||||||||||||||||||||||||||||||||||||||||||||||||||||||||||||||||||||||||||||||||||||||||||||||||||||||||||||||||||||||||||||||||||||||||||||||||||||||||||||||||||||||||||||||||||||||||||||||||||||||||||||||||||||||||||||||||||||||||||||||||||||||||||||||||||||||||||||||||||||||||||||||||||||||||||||||||||||||||||||||||||||||||||||||||||||||||||||||||||||||||||||||||||||||||||||||||||||||||||||||||||||||||||||||||||||||||||||||||||||||||||||||||||||||||||||||||||||||||||||||||||||||||||||||||||||||||||||||||||||||||||||||||||||||||||||||||||||||||||||||||||||||||||||||||||||||||||||||||||||||||||||||||||||||||||||||

ఈ పేజీని షేర్ చేయండి:


భారతీయ రిజర్వ్ బ్యాంక్ మొబైల్ అప్లికేషన్ను ఇన్స్టాల్ చేయండి మరియు తాజా వార్తలకు త్వరిత యాక్సెస్ పొందండి!


