
Performance of Private Corporate Business Sector, 2012-13 - ఆర్బిఐ - Reserve Bank of India


Performance of Private Corporate Business Sector, 2012-13
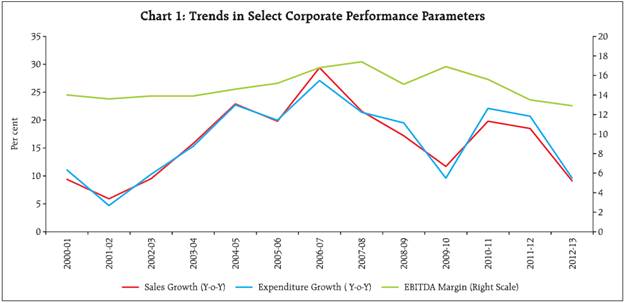
The sales growth of the private (non-financial) corporate business sector has further moderated during 2012-13. Manufacturing sector recorded lower sales growth for the second consecutive year whereas the services sector (both IT and others) evidenced lower demand in 2012-13. EBITDA margin has declined continuously since 2009-10 for manufacturing and since 2007-08 for the services (other than IT) sector. Some improvement was noticed for the IT sector in 2012-13. Performance of smaller companies in some of the major industries was much worse than the larger ones. This article analyses the performance of the private corporate business sector during 2012-13 based on data relating to 2,931 listed non-government non-financial (NGNF) companies. Besides analysing the aggregate performance, it provides a brief analysis by size and major industry groups. It also captures the evolving trend in sales, expenditure and profit margins of the corporate sector over a longer horizon. Detailed data have been made available on the website of the Reserve Bank. 1. Moderation in sales growth and contraction in net profit at the aggregate level 1.1 Sales growth (Y-o-Y) of 2,931 NGNF companies decelerated sharply to 9.1 per cent during 2012-13 from 18.5 per cent in 2011-12. This is the lowest annual growth in past ten years (Chart 1). However, in line with sales, the expenditure on various heads also grew at lower rates resulting in higher earnings before interest, tax, depreciation and amortisation (EBITDA) during 2012-13 (Table 1). With reduced support from ‘non-core’ income, earnings before interest and tax (EBIT) growth slowed down. Net profit of listed NGNF companies declined in 2012-13 for the second consecutive year. However, contraction in net profits was of lower order due to moderation in interest expenses growth. 1.2 Expenditure growth has been outpacing sales growth since 2009-10 which led to lowering of profit margins. However, all the major components of expenditure recorded lower growth in 2012-13. As a result, contraction in EBITDA margin was of a lower order in 2012-13 (Table 2).
2. Performance of small companies further deteriorated 2.1 Small companies (sales up to `1 billion) have witnessed a persistent contraction in sales 2008-09 onwards. Medium sized companies (sales between `1 billion to `10 billion) witnessed sharp decline in sales growth in the last two years. Sales of large companies also moderated sharply in 2012-13 and recorded a growth of 10.7 per cent which is the lowest in the last six years (Table 3).
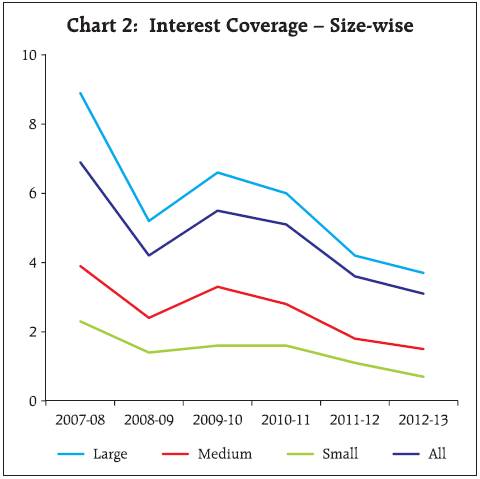
2.2 For small sized companies, EBITDA contracted in the previous two years and net profits turned negative in 2012-13. For medium sized companies, EBITDA remained almost flat while net profits contracted. EBITDA growth of the large companies improved marginally in 2012-13 and net profit grew by 3 per cent. 2.3 EBITDA and net profit margins have been steadily declining since 2009-10 for all size groups. 2.4 Interest coverage ratio (EBIT/Interest Expenses) continued to decline across size groups. The decline slowed at the aggregate level and for medium and large sized companies. Interest coverage ratio was lowest for small companies at 0.7 in 2012-13 (Chart 2). 3. Performance deteriorated across all sectors 3.1 Moderation in the sales growth in 2012-13 was seen across all the three broad sectors. Manufacturing sector recorded lower sales growth for the second consecutive year whereas the services sector (both IT and others) evinced lower demand in 2012-13 (Table 4). EBITDA margin has declined continuously since 2009-10 for manufacturing sector. For the services (other than IT) sector, EBITDA margin has declined since 2007-08. Net profit margin also declined across the sectors. IT sector continued to perform better among the three sectors with improvement in EBITDA growth and EBITDA margin in 2012-13.
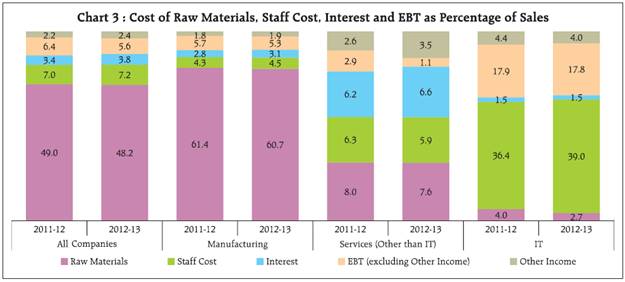
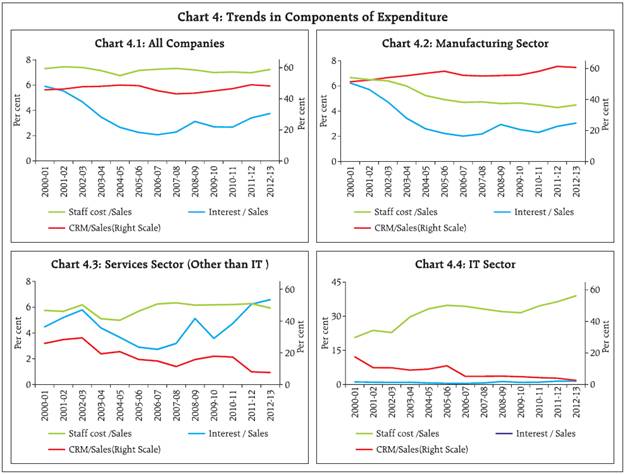
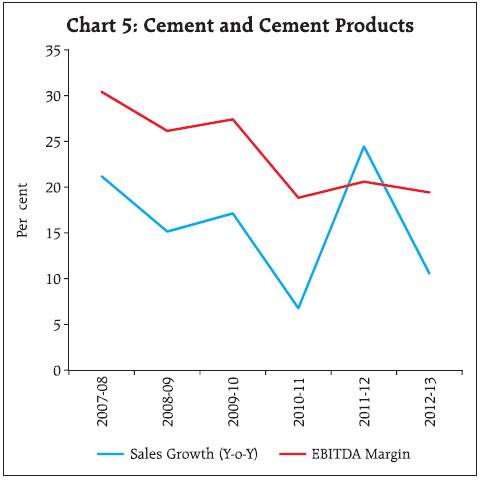
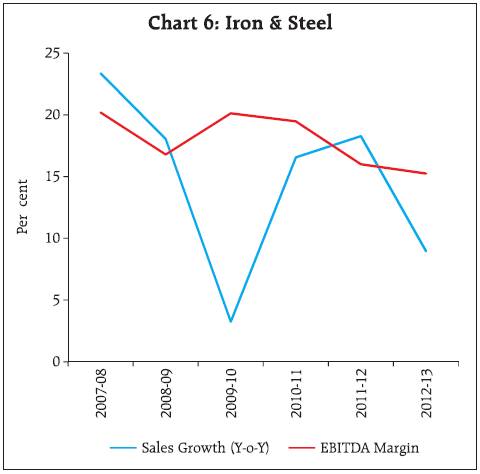
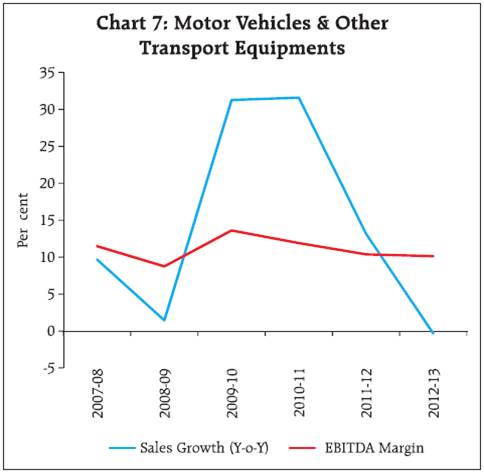
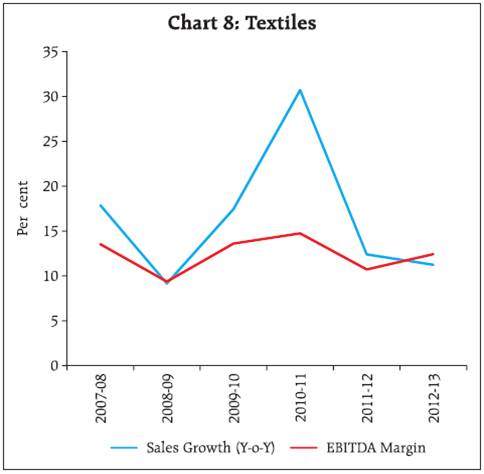
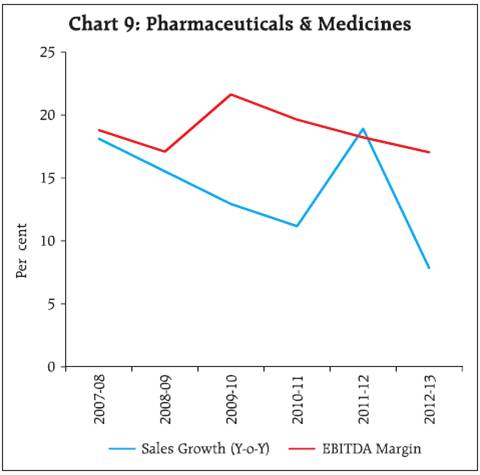
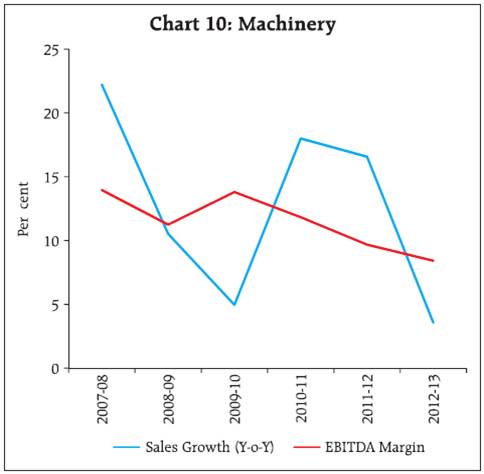
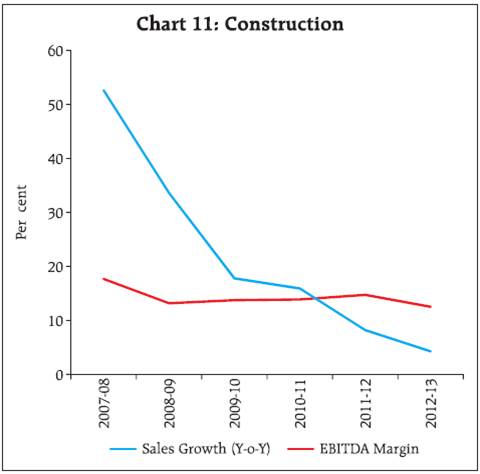
3.2 A closer look at the components of expenditure viz., CRM, staff cost and interest expenditure as a percentage of sales revealed that, at the aggregate level and also for the manufacturing sector, the reduction in CRM in 2012-13 was neutralised by the increase in the other components of expenditure, resulting in lower EBT (earnings before tax) margin (Chart 3). EBT margin declined for the services (IT and others) as well. For the services (other than IT) sector, although CRM and staff cost as percentage of sales declined, that of interest expenses increased. For the IT sector, staff cost as percentage of sales showed a significant increase. 3.3 The long term trend since beginning of the last decade reveals that CRM to sales ratio for all listed NGNF companies together has remained fairly stable and range bound except for the dip during the crisis period and the staff cost also remained stable (Table 5 & Chart 4). Interest expenses have increased across all sectors and size classes in the recent years. At an aggregate level, however, interest to sales ratio has remained below the levels observed in 2000-01. 4. Sales moderated across industries but smaller companies suffered more even in comparatively better performing industries 4.1 Most of the industries followed the general trend of lower sales growth and lower profit (EBITDA) margins in 2012-13 compared to 2011-12. In the basic goods sector, sales growth of the cement industry declined sharply to 10.6 per cent in 2012-13 after reaching a peak of 24.5 per cent in 2011-12. profit margin moderated in 2012-13 after a slight improvement in 2011-12 (Chart 5). For the iron & steel industry also, sales growth fell sharply from 18.3 per cent in 2011-12 to 9.0 per cent in 2012-13. profit margin continued to decline for three consecutive years (Chart 6). Also, a size wise analysis indicates a pronounced difference in the sales growth and profit margin of the small and large size companies within the iron & steel industry (Table 6). 4.2 In the consumer goods sector, motor vehicles industry suffered huge decline in sales growth in 2011-12 followed by further contraction in sales in 2012-13 (Chart 7). Textile industry also witnessed decline in sales growth for two consecutive years (Chart 8) with noticeable differences between the large and the small size companies (Table 6). Sales growth in the pharmaceuticals industry slumped in the post-crisis period up to 2010-11 (Chart 9). It witnessed a sharp recovery in 2011-12 which could not be sustained in 2012-13. Margins continued moderating for the motor vehicles and pharmaceuticals industry but improved slightly for the textiles industry. In all the industries, EBITDA margins were much lower for small sized companies (Table 6). 4.3 In the capital goods sector, which is considered a vehicle of growth, machinery industry recorded two years of decelerating sales growth with contraction in profit margin (Chart 10). Construction industry is yet to show any sign of recovery post crisis though profit margin remained almost steady with slight moderation in 2012-13 (Chart 11). 5. On a quarterly basis, decline in sales growth remained unabated, profit margin steadied 5.1 An analysis of the performance of (NGNF) listed companies over the quarters reveals that sales growth witnessed moderate decline in the first three quarters of 2012-13 and plummeted sharply in the fourth quarter (Table 7). 5.2 EBITDA contracted at the aggregate level in Q4 after positive growth in Q2 and Q3. 5.3 Growth in interest expenses declined noticeably over the quarters except an increase in Q3 of 2012-13. Support from other income also gradually declined over the quarters. 5.4 Net profits contracted in Q4 of 2012-13 after growth in Q2 and Q3. However, profit margins declined during the first two quarters and remained almost stable in the last two quarters. * Prepared in the Corporate Studies Division of the Department of Statistics and Information Management. The previous study ‘Performance of Private Corporate Business Sector, during the 2011-12’ was published in the September 2012 issue of the RBI Bulletin. |
||||||||||||||||||||||||||||||||||||||||||||||||||||||||||||||||||||||||||||||||||||||||||||||||||||||||||||||||||||||||||||||||||||||||||||||||||||||||||||||||||||||||||||||||||||||||||||||||||||||||||||||||||||||||||||||||||||||||||||||||||||||||||||||||||||||||||||||||||||||||||||||||||||||||||||||||||||||||||||||||||||||||||||||||||||||||||||||||||||||||||||||||||||||||||||||||||||||||||||||||||||||||||||||||||||||

ఈ పేజీని షేర్ చేయండి:


భారతీయ రిజర్వ్ బ్యాంక్ మొబైల్ అప్లికేషన్ను ఇన్స్టాల్ చేయండి మరియు తాజా వార్తలకు త్వరిత యాక్సెస్ పొందండి!


