
VI. Price Situation - ఆర్బిఐ - Reserve Bank of India


VI. Price Situation
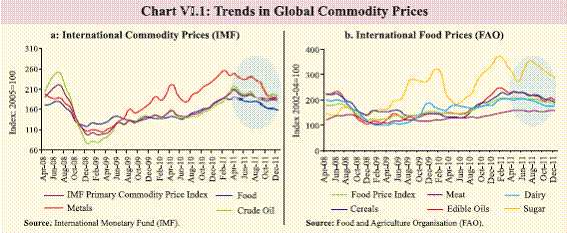
Headline inflation decelerated to a two-year low of 7.5 per cent in December 2011 driven by sharp decline in food inflation. While the inflation path is broadly evolving in line with the 7 per cent projection for March 2012, upside risks persist. They come from the insufficient supply responses, exchange rate pass-through and suppressed inflation in the energy segment. Inflation in non-food manufactured products remains persistently high, reflecting input cost pressures, as the impact of imported inflation resulting from the rupee depreciation more than offset the sobering impact of weakening domestic demand and softer global commodity prices. Primary food inflation declined sharply and turned negative reflecting seasonal fall in vegetable prices and high base, and hence, this phase is expected to be short-lived. High protein inflation continues due to structural demand-supply imbalances. Global inflation expected to ease as growth risks amplify VI.1 Inflation worldwide is still exhibiting divergent trends. Faster recovery in emerging and developing economies (EDEs) after the crisis led to a resurgence of CPI inflation in 2010 in these countries, while inflation remained subdued in the advanced economies (AEs). In 2011, especially in the recent months, inflation rose in AEs, while EDEs witnessed stable to softening bias (Table VI.1). VI.2 Going forward, global inflation is expected to remain subdued with global growth projected to slow down further in 2012. Softening global commodity prices are also expected to feed into softer CPI inflation. Simultaneous deleveraging of both the public and private sectors in many parts of the AEs may further weaken demand and thereby ease inflationary risks notwithstanding sustained easy monetary conditions. Relatively stronger growth in EDEs could keep inflation differentials to persist between AEs and EDEs, even though softening of inflationary pressures could be a general trend. Global interest rate cycle in easing mode VI.3 Receding risks to price stability and increasing risks to growth have also influenced the monetary policy stance of central banks in major economies. As the intensified financial market tensions were continuing to dampen economic activity in the euro area and wage price pressures were expected to remain moderate, the ECB reduced its key policy rate cumulatively by 50 basis points to 1 per cent during November-December 2011. Major economies like Australia and Israel have also reduced their policy rates. Many EDEs, which were earlier increasing policy rates to address inflation concerns have also started reducing policy rates as growth risks became imminent. Central banks of EDEs like Brazil, Indonesia, Russia and Thailand have reduced policy rates during Q3 of 2011-12 while China reduced the required reserve ratio for deposit taking institutions (Table VI.1). Global commodity prices soften but oil prices exhibit stickiness VI.4 Global commodity prices continued to moderate during Q3 of 2011-12 even though the levels remain significantly high (Chart VI.1a). Metal prices have softened significantly. The general softening in commodities prices reflects a combination of weakening demand, order deferrals from purchasing managers given the global economic outlook and appreciation of the US dollar against major currencies. Crude oil prices, however, have exhibited stickiness. Brent crude prices on an average have been 30 per cent higher in 2011-12 so far, compared with the preceding year. In spite of weakening global growth conditions, it stayed elevated mainly due to easy liquidity and search for returns, US proposal on sanctions on Iran, reversal of Seaway pipeline project that lifted the prices of WTI (West Texas Intermediate) crude and higher demand during winter.
VI.5 Global food prices have also moderated during 2011-12 so far and the FAO Food Price Index in December 2011 was about 13 percent below its historical peak in February 2011 (Chart VI.1b). Improved supply prospects and comfortable stock positions indicate that global food prices are likely to remain range bound in the medium term. It may, however, be noted that the global food price levels are significantly high compared to historical levels. VI.6 Apart from fuel, the major source of price pressure from imported inflation in recent years for India has been the sharp increases in metals and other input prices globally. During 2011-12 so far, however, prices of metals and other raw materials have been showing a declining trend, except in the case of fertilizers. The salutary effect of this moderation, however, has been largely offset by the depreciation of the rupee.
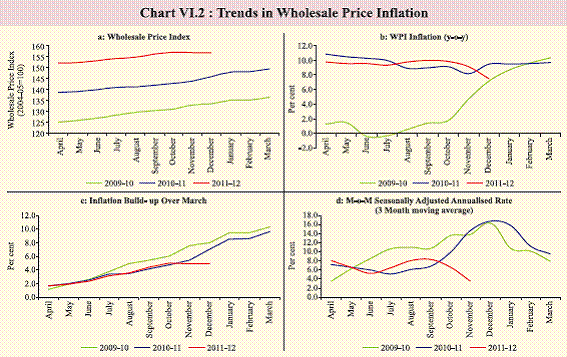
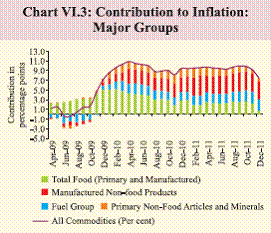
Sticky inflation path edges down, with dampened momentum VI.7 Inflation in India remains high, but with signs of moderation. Inflation, as measured by year-on-year changes in WPI declined sharply to 7.5 per cent (provisional) in December 2011 from 9.1 per cent in November 2011, which is the lowest level recorded since January 2010. Price pressures are moderating with lower pace of increase in wholesale price index (WPI) in recent months, lower financial year build-up of inflation and dampening month-over-month seasonally adjusted annualised rate (3 month moving average) of inflation (Chart VI.2). VI.8 In terms of contribution to overall inflation, the relative shares of food and nonfood primary articles to overall inflation have declined in recent months (Chart VI.3). The fuel group continues to contribute significantly to overall inflation, while the contribution of manufactured non-food products marginally increased.
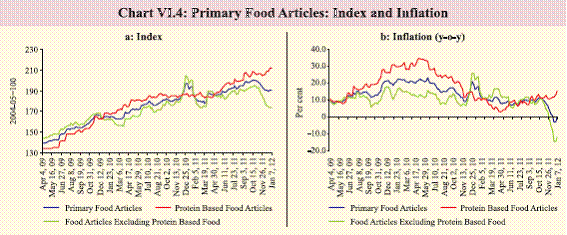
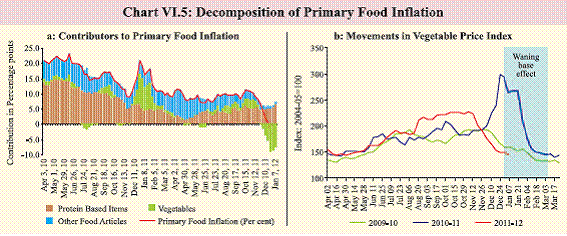
Sharp decline in primary food inflation reflects high base and seasonal moderation, but comfort may fade fast VI.9 During Q3 of 2011-12, primary food articles inflation edged up to double digits in October partly reflecting the seasonal demand (Chart VI.4). Since then, primary food articles prices have declined by nearly 4.6 per cent. Reflecting the impact of favourable base effect and sharp seasonal decline in vegetables prices, food inflation declined over ten consecutive weeks to a 13-year low of -3.4 per cent as on December 24, 2011 before marginally increasing in the following two weeks, while still remaining negative. But for the seasonal sharp decline in vegetables prices, food inflation would have remained sticky, as inflation in protein-rich items continued to be in double digits (Chart VI.4b). Price pressures in protein-rich items may continue due to structural demand-supply imbalances. Moreover, starting January 2012, the base effects are expected to wane and primary food inflation may firm up once the seasonal moderation ends (Chart VI.5).
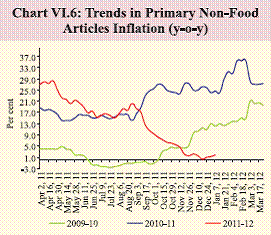
Structural sources of pressures on food inflation persist VI.10 Structural sources of food price pressures persist. Changing dietary patterns with rising incomes that have contributed to inflation in protein-rich items and significant upward revisions in Minimum Support Prices (MSP) are expected to keep up the food inflation pressures. Significant increases in rural wages and input costs in recent years are feeding into the MSPs, as MSP fixation follows a cost plus pricing approach. Despite large increases in MSPs, in some parts of the country farmers have reportedly preferred “crop holidays”, fearing inability to realise remunerative prices in an environment of significant input cost pressures. Inflation in non-food primary articles dips sharply but with wide variations across commodities VI.11 Trends in non-food primary articles prices provide lead information on the nature of generalised inflation as the input cost movements get reflected in manufactured products prices with a lag. Prices of primary non-food articles like raw cotton and raw rubber have declined during the year leading to price index of this group declining by about 4.7 per cent during 2011-12 so far (as on January 7, 2012) and inflation in this category reached near zero levels, before edging up recently (Chart VI.6). On the other hand, oilseeds prices have increased during the year so far. The Minerals group index in WPI has increased significantly during the year so far, partly reflecting the lagged reporting of past increases in crude oil prices.
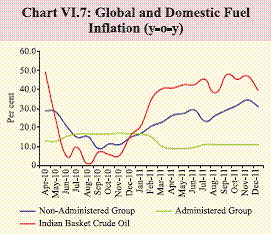
Fuel group inflation remains high and partly suppressed VI.12 Energy prices have been and are expected to continue exerting significant pressures on inflation. Domestic fuel group inflation remains in double digits for successive 23 months (up to December, 2011), driven both by upward revisions in administered prices as well as increase in freely priced petroleum product prices (Chart VI.7). Even after revisions in administered prices, underrecoveries persist. Currently, the estimated under-recoveries by domestic oil marketing companies for Diesel and PDS Kerosene are `12.95 and `28.50 per litre, respectively and `326 per cylinder for domestic LPG. As the price of Indian crude oil basket remains firm, rupee depreciation has led to an increase in the cost in Rupee terms, which has resulted in the revision of petrol (but for the marginal cuts in November and December) and other freely priced petroleum product prices (Table VI.2).
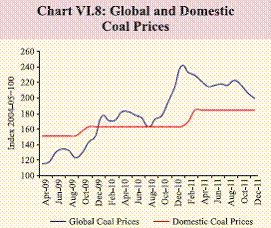
VI.13 Despite softening global coal prices in recent months, upward revision in coal prices have become necessary as the divergence between domestic and international coal prices still persist (Chart VI.8). The revision in coal pricing formula effected in January 2012 is likely to have an inflationary impact, the quantum of which would depend on substitution in usage of various grades of coal. The increase in electricity prices in September 2011 was modest relative to the increase in input costs. Since then, the revision in coal pricing formula, on an average, would raise the costs for electricity generation further, necessitating tariff revision.
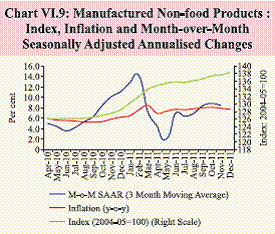
Inflationary pressures in core component persist even as pricing power has been dampened VI.14 Over 11 consecutive months, non-food manufactured products inflation has remained at or above 7 per cent as compared to its long term average of about 4 per cent before its current surge. Even though corporate margins have come under pressure, M-o-M (SAAR) price pressures are significant (Chart VI.9). The depreciation of the rupee and the associated pick-up in input cost pressures as well as the increase in imported final products prices have more than offset the softening impact of weakening demand.
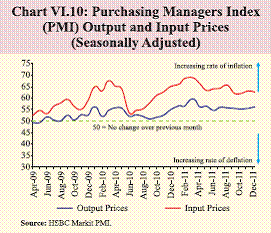
VI.15 The HSBC Markit Purchasing Managers Index (PMI) for input prices and output prices, which provide leading information on trends in costs and prices, indicate that the pressure on input costs have been much higher than the pricing power for output (Chart VI.10). This pattern suggests that for the manufactured non-food inflation to subside significantly, input cost pressures have to ease considerably.
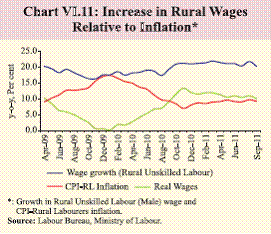
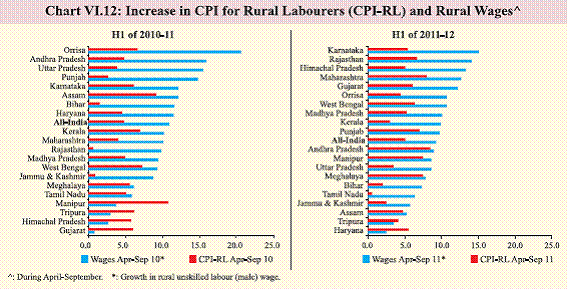
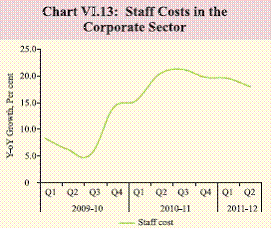
Exchange rate pass-through poses risk to inflation trajectory VI.16 Depreciation of the rupee has accentuated input cost pressures and poses a risk to the inflation trajectory. It was expected that with moderation in global commodity prices and dampened domestic demand, inflation should fall quickly in 2012. The pass-through of sharp depreciation of the rupee since August 2011 has more than offset this favourable impact and prices of metals, chemicals and textiles have increased significantly. The pass-through impact, however, has been partial so far due to suppressed inflation in the fuel group as also the lags in domestic price changes to reflect the full impact of depreciation. VI.17 Most of the key items under the fuel and ‘manufactured products’ groups within WPI also account for significant shares in total imports (Table VI.3). Ten product groups with a combined share of 72 per cent in total imports, however, have a much lower weight of 38 per cent in WPI, as a result of which the first round pass-through of depreciation may yield a relatively low upward pressure on WPI headline inflation. The second round impact through input costs and the lagged passthrough of the first round may sustain and even amplify the price pressures in the next few months. Given that imported goods account for 22 per cent of GDP, the inflationary impact could be significant. There is some evidence that the pass-through coefficient has increased over time. The eventual pass-through impact may vary over time depending on the trends in other determinants of inflation, in particular aggregate demand (or output gap) and commodity prices. Wage increases remain significant in both rural and urban areas VI.18 Increase in wages for unskilled labourers in rural areas, at a rate higher than inflation (Consumer Price Index for Rural Laboures (CPI-RL)), has continued during 2011-12 so far (Chart VI.11). Similar pattern was witnessed across states, suggesting the broad based nature of the wage pressures (Chart VI.12). Similarly, in the formal sector, analysis of company finance data suggests that staff costs have risen at a faster rate since the middle of 2009-10 (Chart VI.13). Rising real wages could be desirable from a social welfare point of view as the primary objective of development is to raise standards of living through higher incomes. However, wages rising faster than productivity could be inflationary. In an environment of growth moderating to below trend, sustained wage pressures would complicate the monetary policy response to inflation.
New CPIs show sustained increase in price levels VI.19 The new CPIs introduced for rural and urban areas along with a composite All- India CPI suggest some moderation in price pressures in December 2011 (Chart VI.14). The price pressures have been relatively more in rural areas as compared to the urban areas. Among the major groups, price increases have been more significant in textiles and fuel while food prices have moderated in December 2011.
Fiscal stance dampens the impact of moderation in private demand on inflation VI.20 Reflecting the lagged impact of antiinflationary monetary policy actions and the spillover from unfavourable global macrofinancial conditions, domestic private demand has softened, which was expected to ease the pressure on manufactured non-food products inflation. The expected overshooting of the fiscal deficit from the budgeted level (as outlined in Chapter II), and the associated expansion in government demand, however, would partly offset the salubrious impact of moderating private demand on inflation. Moreover, subsidies and the resultant higher fiscal deficit may help in keeping inflation suppressed in near term, but over time the impact of higher subsidy induced deficit would exert pressure on the inflation path. Going forward, return to fiscal consolidation and reorientation of public expenditure in favour of supply augmenting capital expenditure would be necessary to ensure a more subdued inflation path.
Inflation expected to moderate gradually, but risks of persistence remain VI.21 The moderation in growth momentum and subdued international commodity prices are expected to ease the inflationary pressures in non-food manufactured products. The pace of moderation will, however, depend on exchange rate changes and its pass-through to domestic prices. If depreciation induced cost pressures and the current order of increases in rural wages persist in 2012, the expected softening of inflationary pressures on account of weakening demand conditions could be much weaker and pose a difficult challenge for monetary policy. Inflation is expected to remain in line with the projected moderation toward 7 per cent by March 2012, but supply side and external drivers of inflation could persist into 2012-13. VI.22 Food inflation has declined significantly. The decline has clearly been caused by transitory factors like seasonal decline in vegetables prices and a high base and the reversal may be quick. Softer commodity prices could ease the inflationary pressures directly, as well as indirectly through lower pressures on the fiscal deficit and current account deficit. But global easy liquidity conditions and search for return on financial investments in an atmosphere of depressed global growth could work against any major softening of commodity prices. While the expected gradual softening of the inflation could suggest the need for easing monetary policy, medium-term inflation risks in the absence of adequate supply side measures and fiscal slippage warrant careful calibration. |
|||||||||||||||||||||||||||||||||||||||||||||||||||||||||||||||||||||||||||||||||||||||||||||||||||||||||||||||||||||||||||||||||||||||||||||||||||||||||||||||||||||||||||||||||||||||||||||||||||||||||||||||||||||||||||||||||||||||||||


ఈ పేజీని షేర్ చేయండి:


భారతీయ రిజర్వ్ బ్యాంక్ మొబైల్ అప్లికేషన్ను ఇన్స్టాల్ చేయండి మరియు తాజా వార్తలకు త్వరిత యాక్సెస్ పొందండి!


