 IST,
IST,
The Divisia Monetary Indices as Leading Indicators of Inflation
We take this opportunity to extend our sincere gratitude to Dr. Narendra Jadhav for inspiring us to choose this topic. We would like to thank Shri K U B Rao, Officer-in-Charge, Department of Economic Analysis and Policy (DEAP), Reserve Bank of India and Dr. Charan Singh, Dr. Nishita Raje and Dr. Snehal Herwadkar of DEAP for their constant encouragement and necessary support during the course of this study. We are deeply indebted to all the officials of the Reserve Bank of India, especially those from the Department of Economic Analysis and Policy for extending necessary support to complete this study as one of the DRG studies. We would also like to put on record our thanks to the valuable suggestions extended by the external expert Dr. N R Bhanumurthy, Professor, National Institute of Public Finance and Policy, New Delhi and to the useful comments provided by the experts from the Reserve Bank of India who were present in the work in progress seminar. The views expressed in this study are authors’ own. Needless to say, the authors are responsible for error, if any. M. Ramachandran The central banks all over the world publish time series data on monetary aggregates which are simple sum of a spectrum of monetary assets such as currency, demand deposits, term deposits of various maturities etc. Such aggregates would be meaningful only if the components of the aggregates are perfect substitute for each other. In other words, simple sum aggregation can be justified if none of the monetary assets yield monetary return or all the assets yield same return. In reality, however, component assets excepting currency yield varying monetary return which cannot be considered as flow of monetary services; hence, the official measures of monetary aggregates especially at higher level of aggregation contain an element of aggregation bias. As a consequence, the application of aggregation theory to construct monetary aggregates gained popularity in the literature. One of the crucial developments in the literature is the integration of aggregation theory and monetary theory that created a base for constructing monetary aggregates which can be treated as aggregates in economic sense. Moreover, the integration of statistical index number theory and economic aggregation theory has further facilitated constructing monetary quantity indices without reference to any unknown economic aggregator function. The economic monetary constructs derived from Divisia quantity index held promises in applications for three prime reasons. First, Divisia index belongs to the class of superlative index numbers, which provides a third order approximation to any arbitrary exact aggregator function. Hence, its construction is based on microeconomic aggregation theoretic foundation [Diwert (1976), Barnett (1980, 1997), Barnett, Fisher and Serletis (1992)]. Second, it does not involve econometric estimation of parameters and instead, depends upon quantity and price data. Third, voluminous empirical evidence exists to support the theoretical merits of Divisia monetary aggregates in the sense that they have an edge over their simple sum counterparts in applications [Barnett (1980), Binner, Fielding and Mullineux (1999) and Stracca (2001)]. However, the superiority of Divisia monetary aggregates over their simple sum counterparts depends upon the structure of the financial markets. Under repressed financial system, the interest rates on various monetary assets are administered; suggesting that the relative prices of most of the financial assets are constant over time. Under such regime, Divisia monetary aggregates tend to converge to their simple sum counterparts. In fact, earlier studies concerning India, especially for the sample period during which the interest rates were largely administered, failed to establish the superiority of Divisia monetary aggregates. Broadly, three major inferences emerge from the earlier studies in the Indian context.
Nevertheless, the study by the Reserve Bank of India (1998) and Acharya and Kamaiah (2001) could find marginal gain with Divisia aggregates in terms of their stable demand function and information content. This could be probably due to the reason that these studies use data from a relatively liberalised financial market regime. Thus, the theoretical arguments and the available empirical evidences indicate that Divisia monetary aggregates might have an edge over their simple sum counterparts in a liberalized financial market regime. There are several developments in the Indian financial markets and changes in the monetary policy transmission mechanism since 1997 that warrant a fresh examination of this issue and re-exploration of potential use of Divisia monetary aggregates in the present context of monetary policy settings. The most important among them are: (i) the Indian financial markets have undergone significant changes in terms of freeing interest rates; (ii) there are notable changes in terms of revisions of definition and measurements of monetary measures; (iii) disaggregated time series data on new monetary and financial candidates are made available to the public domain; (iv) there are financial innovations and significant changes in payment technology; and (v) there are advancements in economic theories and econometric tools to implement further rigor in testing. Against these backgrounds, the present study intends to investigate whether weighted monetary aggregates constructed from Divisia quantity index number formula has an edge over their simple sum counterparts in a gradually liberated financial market in India. We have two motives that make the present study differ from the earlier studies: (i) constructing Divisia monetary aggregates using broader range of available monetary and financial assets which were not available earlier; and (ii) evaluating the performance of Divisia vs. simple sum aggregates in the context of their role as a predictor of inflation that has more relevance in the present monetary policy settings of multiple indicator approach. Two official measures of monetary aggregates, M2 and M3, and one liquidity measure, L1, are considered for empirical comparison of their role as an indicator of inflation. In this respect, the study constructs monthly Divisia quantity indices for the sample period from April 1993 to June 2008, covering fairly the liberalized financial regime. The relevant data on various monetary components and interest rates are collected from The Handbook of Statistics on Indian Economy and other publications of the Reserve Bank of India. The empirical evidences are found to support the theoretical arguments that Divisia monetary aggregates have an edge over their corresponding simple sum aggregates. The correlation coefficients indicated that there is relatively strong association between annual headline inflation measured as point-to-point percentage change in wholesale price index and the growth rates of Divisia monetary aggregates. Also, the potential gain of Divisia monetary measures is found to have increased in terms of their correlation with two conventional measures of core inflation. On the contrary, the correlation between inflation and growth rates of simple sum monetary aggregates seems to be weak. The plots of annual headline inflation against alternative measures of annual growth rates of money indicated that there is no clear evidence of any relationship between both headline or core inflation measures and growth rates of simple sum monetary aggregates. This stylized observation is further supported by the fit of the nearest neighborhood regression of inflation on growth rates of money as the fit appears to be a flat line. On the contrary, there is clear evidence of a positive association between growth rates of Divisia monetary aggregates and inflation. The striking feature of the evidence is that the regression fit sharply rises when Divisia monetary growth exceeds sixteen percent. This indicates that the growth rate of Divisia money beyond certain level could be more inflationary. The econometric evidence derived from a vector error correction model indicated that the growth rates of Divisia monetary aggregates serve as better predictor of both headline and core inflation measures whereas there is a feedback causal relationship from inflation to growth rates of simple sum monetary aggregates revealing more of monetary policy reaction. The impulse responses of inflation to shocks in growth rates of Divisia monetary aggregates are found to be stronger as compared to shocks in growth rates of corresponding simple sum aggregates. The evidence from forecast error variance decomposition also indicates that the growth rates of Divisia monetary aggregates are exogenous sequence whereas the forecast error variance of growth rates of simple sum aggregates is increasingly explained by shocks in inflation. Hence, the official measures of simple sum aggregates seem to have been less useful in predicting inflation. The overall empirical evidences of this study unambiguously establish the superiority of Divisia monetary aggregates over their corresponding simple sum aggregates from the policy viewpoint in predicting either headline inflation or the conventional measures of core inflation which are widely used by central banks. Hence, the study suggests that the RBI can closely observe the growth rates of Divisia monetary aggregates to have a better understanding of future inflationary pressure. Also, the RBI can publish monthly time series data on various measures of Divisia money, as it would provide more useful information regarding future inflationary pressure. This, however, does not mean that the RBI can dispense the use of official measures of monetary aggregates. Simple sum aggregate can continue to serve as an accounting stock. THE DIVISIA MONETARY INDICES
AS LEADING INDICATORS OF
INFLATION The monetary policy frameworks have undergone significant changes in most economies in response to the trade and financial liberalization since the 1980s. Although price stability and sustainable output growth remains the final objectives of monetary policy, in view of they being not directly under the control of central banks, monetary authorities typically set ‘intermediate target/s’, which bear a stable relationship with the overall objectives of monetary policy (Friedman, 1990). The selection of intermediate target/s is also conditional upon the channels of monetary policy transmission that operate in the economy. Although credit targeting was prevalent traditionally, such as in the US, the concept of a formal intermediate target emerged with the monetarist emphasis on money targeting in the 1960s. In the 1970s, the evidence of a stable relationship between money, output and prices, prompted central banks to give more weight to money growth in their policy discussions, in an environment of worsening inflation (Volcker, 1978). In addition to supply (oil price) shocks, the high inflation in the 1970s was attributed to the accommodative monetary policies pursued in many countries to offset the adverse output and employment effects of the shock. In this backdrop, a commitment to rules was thought necessary to anchor inflation expectations [Kydland and Prescott (1977), Barro and Gordon (1983)]. A number of central banks, such as Switzerland, Germany, Japan, the UK and the USA adopted monetary targets in the mid-1970s. Following the successful implementation of monetary targets in the advanced economies, many emerging market economies (EMEs) also adopted monetary targeting in the 1980s. The assumption about stability of the money demand functions was central to the monetary targeting framework. However, the sophistication in the financial markets that reduced the need for financial intermediation by the banking system during the 1980s, in turn, began to impart volatility to the behaviour of monetary aggregates and the velocity of money, especially in market-based economies. As a result, central banks in advanced economies began to deemphasize the role of monetary aggregates and moved towards signaling monetary policy stance through setting of interest rates under exchange rate flexibility or a tight exchange rate target regime. In contrast, monetary targeting continued in some form in some bank-based economies such as France, Germany and Switzerland where it was possible to test for money demand stability with some redefinition of monetary aggregates. In the early 1990s, beginning with New Zealand, a number of advanced and emerging market economies (EMEs) adopted ‘inflation targeting’ as an alternative monetary policy framework. Recognising the uncertainty and complexity involved in forecasting the final objective (i.e., inflation), a more eclectic approach is followed by inflation targeting central banks, where a large set of variables /models are used to draw inferences about future inflation. In its pursuit of price stability objectives, the European Central Bank (ECB) bases its policy decisions on the ‘two pillars’ strategy comprising of ‘economic analysis’ and ‘monetary analysis’ even today. According to the ECB, the monetary analysis mainly serves as a means of cross-checking, from a medium to long-term perspective, the short to medium-term indications for monetary policy coming from the economic analysis. In some EMEs such as Russia (Korhonen and Mehrotra, 2007) and China (Laurens and Maino, 2007), monetary aggregates continued to play a central role in their policy formulation. Thus, in many economies, despite transition and larger flexibility to monetary policy frameworks, the emphasis on money growth to contain inflation remained till date. The role of money and credit has further come to the limelight in policy debates as economists and policy makers have begun to draw lessons from the current global financial crisis. It is argued that monitoring money and credit may help policymakers interpret asset market developments and draw implications from them for the economic and financial outlook (Goodhart, 2007). In India, intermediate targets have evolved over time with changes in the overall operating environment of monetary policy and financial liberalisation of the Indian economy. The Reserve Bank had no formal intermediate target till the middle of 1980s. Bank credit - aggregate as well as sectoral - came to serve as a proximate target of monetary policy after the adoption of credit planning from 1967-68 (Jalan, 2002). Inflation was largely thought to be structural and inflation volatility was mainly on account of agricultural failures. Accordingly, there was greater reliance on selective credit controls which aimed at regulating bank advances to sensitive commodities to influence production outlays, on the one hand and to limit possibilities of speculation, on the other. During the early 1960s, although the analytics of money supply was being governed by the expansion in credit, the Reserve Bank began to pay greater attention to the movements in monetary aggregates (RBI, 2005). This accent on monetary aggregates was supported by several empirical studies which provided evidence of a stable money demand function in the Indian economy [Vasudevan (1977), Jadhav (1994), Ramachandran (2004)]. During the 1970s, the sharp increases in money supply in the face of slowdown in output growth was viewed as adding to the demand pressures in the economy, which coupled with the adverse impact of the supply shocks led to spikes in inflation. By the early 1980s, there was a broad agreement on the primary causes of inflation. It was argued that while fluctuations in agricultural prices and oil price shocks did affect prices, continuous inflation of the kind witnessed in India since the early 1960s could not occur unless it was sustained by the continuous excessive monetary expansion generated by the large-scale monetisation of the fiscal deficit (RBI, 2005). Against this backdrop, the Committee to Review the Working of the Monetary System (Chairman: Sukhamoy Chakravarty, 1985) recommended a monetary targeting framework to target an acceptable order of inflation in line with output growth. With empirical evidences supporting stability in the money demand functions, broad money emerged as an intermediate target of monetary policy. Thus, the Reserve Bank of India began to formally set monetary targets as nominal anchor for inflation, although the framework was a flexible one allowing for various feedback effects. In the early 1990s, the process of financial liberalization began which along with the gradual opening up of the economy necessitated shifts in the monetary policy operating procedures. With the pace of liberalization and globalization of the economy gaining momentum, efficacy of broad money as an intermediate target of monetary policy came under question. Despite most studies lending support to the argument that money demand functions in India have so far been fairly stable, the Reserve Bank’s Monetary and Credit Policy Statement of April 1998 observed that financial innovations emerging in the economy provided some evidence that the dominant effect on the demand for money in the near future need not necessarily be real income, as in the past. Interest rates too seemed to exercise some influence on the decisions to hold money (RBI, 2005). The Working Group on Money Supply: Analytics and Methodology of Compilation (Chairman: Dr. Y.V. Reddy, 1998) also observed that monetary policy exclusively based on the money demand function could lack precision. In line with international experience and the liberalisation process initiated by structural reforms of the early 1990s, the monetary policy framework in India also witnessed a major transformation. A key development that shaped the conduct of monetary policy during the 1990s was the progressive opening up of the Indian economy to capital flows1. Therefore, apart from dealing with the usual agricultural supply shocks, monetary policy also had to increasingly manage external shocks emanating from swings in capital flows, volatility in the exchange rate and global business cycles. Accordingly, maintaining orderly conditions in financial markets for ensuring financial stability emerged as an additional objective of monetary policy, apart from price stability and credit availability, which necessitated refinements in the conduct of monetary policy by the Reserve Bank of India. Against this backdrop, the Reserve Bank of India formally adopted a ‘multiple indicator approach’ in April 1998 with a greater emphasis on rate channels for monetary policy formulation. As part of this approach, besides money supply, the information content in a host of macroeconomic indicators including interest rates or rates of return in different markets along with such data as on currency, credit, fiscal position, trade, capital flows, inflation rate, exchange rate, refinancing and transactions in foreign exchange are juxtaposed with output data for drawing monetary policy perspectives2 . Globally, it is now recognised that the task of monetary management has become more and more complex in an environment of ongoing structural reforms and increasing trade and financial integration of economies. These changes, in turn, have distorted the relevance of explicit intermediate targets and altered the transmission of monetary policy to the real economy. In this backdrop, there is now an emerging consensus that the process of monetary policy formulation be guided by the information content available from a number of macroeconomic indicators rather than the reliance on a single intermediate anchor (RBI, 2005). It is argued that with central bankers operating in an environment of high uncertainty regarding the functioning of the economy as well as its prevailing state and future developments, a single model or a limited set of indicators may not be a sufficient guide for monetary policy. Instead, an encompassing and integrated set of data is required (Trichet, 2004). In fact, central banks like the US Fed, the ECB and the Bank of Japan regularly monitor a number of macroeconomic indicators such as prices, output gaps, and developments in asset, credit and other financial markets, which have a bearing on price stability (RBI, 2007). It may be noted that despite money’s relegation to the background, most central banks in developed countries continue to include measures of money and credit in the range of economic indicators used to assess the economic outlook (Bloor et al., 2008). The relevance of money for aggregate demand, in turn, lies not via real balance effects, but on money’s ability to serve as a proxy for the various substitution effects of monetary policy that exist when many asset prices matter for aggregate demand (Nelson, 2003). Thus, most central banks now monitor a number of macroeconomic indicators which have a bearing on the ultimate objective of price stability. Although the movement of a host of variables is now monitored within the multiple indicator approach, the monetary aggregates continue to play significant role as an indicator if not as an intermediate target variable. However, the Reserve Bank of India like other central banks largely rely on monetary aggregates which are measured as simple sum of relevant monetary components. Such simple sum approach can be justified only if the component assets are perfect substitutes or in other words the component assets do not yield any explicit or implicit monetary return. In reality, most of the monetary candidates such as fixed deposits of various maturities, however, yield explicit monetary return; hence, they cannot be treated as perfect substitutes. Therefore, simple sum aggregates suffer from aggregation bias and the magnitude of bias tends to be larger with higher level of aggregation. Use of such aggregates as indicators of monetary policy is likely to send wrong signals and the policy actions based on such wrong signals might produce undesirable impact on goals of monetary policy. In this context, the present study intends to explore the potential use of weighted monetary aggregates derived from index number theory within the current monetary policy settings. 2. Why Divisia Monetary Indices? The economic monetary constructs derived from Divisia index number formula held promises in applications, particularly in the context of developed countries, for several reasons. First, an aggregate in economic sense must be viewed as if it were a single good. Such aggregate can evolve only from a strong microeconomic aggregation theoretic foundation. In this regard, the Divisia index number has microeconomic aggregation theoretic foundation as it belongs to the class of superlative index numbers (Diwert, 1976). The superlative index numbers approximate any arbitrary exact aggregator function up to a third-order remainder term; hence, eliminate the distinction between index number theory and economic aggregation theory [Barnett (1980), Barnett, Fisher and Serletis (1992), Barnett (1997)]. Second, it does not involve econometric estimation of parameters and depends upon quantity and price data. The use of aggregator function to construct monetary aggregates is less appreciated as such aggregates cannot be used for communication purposes. When new data arrives, estimation of the parameters of the function tend to change and therefore, the monetary aggregates in the past also change. On the contrary, construction of index numbers is free from estimation of parameters; hence, arrival of new data will not change measure of monetary aggregates in the past. Third, voluminous empirical evidence exists to support the theoretical merits of Divisia monetary aggregates and they have an edge over their simple sum counterparts in their role as predictor of inflation and output. Further, the demand for such weighted monetary aggregates is found to be fairly stable functions of few determinants [Barnett (1980), Binner, Fielding and Mullineux (1999) and Stracca (2001)]. 3. What were the experiences in India? In India, there are few studies which have attempted to construct and evaluate the performance of weighted monetary aggregates. The empirical studies on monetary aggregation can be classified into two groups. First, studies that attempted to identify theoretically admissible asset groups using both parametric separability tests [Ramachandran and Kamaiah (1994) Subrahmanyam and Swami (1994)] and nonparametric separability tests [Acharya and Kamaiah (1999)]. Second, there are studies focused on evaluating the performance of weighted vs. simple sum monetary aggregates, mainly in terms of their information content about the future movement of prices and income and stability of their demand functions [Kamaiah and Bhole (1982), Kamaiah and Subrahmanyam (1983), Kannan (1989), Subrahmanyam and Swami (1991), Ramachandran (1994, 1995, 1998), Acharya (1998), Acharya and Kamaiah (1998)]. Three major inferences emerge from the earlier studies in the Indian context: (i) in contrast to theoretical merits, simple sum aggregates outperformed Divisia aggregates even at higher levels of aggregation; (ii) the performance of Divisia aggregates over their sum counterparts are found to be conditional upon sample period, frequency of time series data, the context in which the role of aggregates are evaluated and econometric tools used; and (iii) even those studies that report supporting evidence in favour of Divisia monetary aggregates received severe criticism on methodological grounds3. One of the prominent reasons attributed to the failure of Divisia monetary aggregates is that the time series data used in the construction of monetary aggregates pertain to the period of repressed financial regime. Under repressed financial system, the relative prices of most of the financial assets are constant over time. Therefore, Divisia monetary aggregates tend to converge to their simple sum counterparts, yielding little or no gain over simple sum aggregates in applications. However, the studies by the Reserve Bank of India (1998) and Acharya and Kamaiah (2001) could find marginal gain with Divisia aggregates in terms of their stable demand function and information content. This might be due to the reason that these studies use data from a relatively liberalised financial market regime. Indeed, weighted monetary aggregates perform better if the financial market is deregulated. 4. Why do we need a fresh study? Over time, database gets revised, data on new monetary candidates are available, policy regime changes, financial innovations and changes in payment technology occur, there are advancements in economic theories and econometric tools. For instance, time series data on new financial candidates at highly disaggregated levels and on interest rates are made available thanks to the recommendations of the Working Group on Money Supply (Chairman: Dr. Y V Reddy, 1998). In the recent years, there is a clear evidence of interest rate deregulations, financial innovations, and growing financial disintermediation. The increased use of alternative instruments as medium of exchange has brought in significant changes in payment technology. Under such an environment, Divisia monetary constructs embracing all the relevant monetary and financial candidates tend to provide a better measure of liquidity, especially at higher level of aggregation. Such aggregates will be highly useful in understanding the implications of liquidity movement on other economic variables. Although targeting Divisia constructs is a bit difficult, they can serve as potential indicators of monetary policy in the context of currently followed multiple indicator approach. The Annual Monetary and Credit Policy Statement for 2003-04 and the Report of the Internal Group on Liquidity Adjustment Facility (LAF) have emphasized the need to strengthen the RBI’s liquidity forecasting model so as to provide a more scientific basis to the decision making process for LAF operations. In this regard, using the information contained under the Divisia monetary aggregates might provide better assessment of liquidity than their simple sum counterparts. Given the recent developments in the Indian financial markets, it is, therefore, ideal to re-explore the potential use of economic monetary aggregates, especially at higher level of aggregation, in relevant applications. 5. The methodology and empirical results The empirical analysis has two aspects: (i) constructing Divisia monetary aggregates; and (ii) evaluating the relative merits of such constructs vis-a-vis simple sum aggregates. The second phase of the empirical analysis is designed to understand whether Divisia monetary aggregates have an edge over their simple sum counterparts in their role as indicators of inflation. In this context, we propose to use the cointegration and error correction framework to understand the short-run and long-run dynamics between the growth rates of money and inflation The Divisia index The growth rate of Divisia quantity index is defined as :
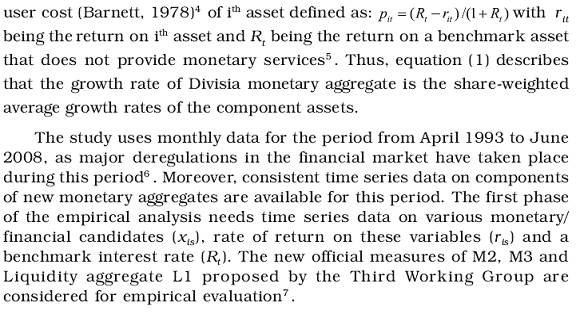
The benchmark prime lending rate (BPLR) of State Bank of India is chosen as a proxy for benchmark interest rate. However, the highest rate among the chosen interest rates offered on the components of monetary aggregates and the BPLR at each time period is used as benchmark rate to calculate the user cost of money. This is done to avoid negative user cost for some components, because the call money rate and interest rate on certificate of deposits issued by the commercial banks exceeded the BPLR of State Bank of India during some months8. The details of various components and corresponding interest rate proxies used in the construction of user cost of monetary assets are given in Appendix A9 . The data are collected from Handbook of Statistics on Indian Economy and other publications of the Reserve Bank of India. The relative merits of simple sum vs. Divisia monetary aggregates need to be carried out using some empirical criteria of policy interest. In this respect, the study intends to examine the strength of association between Divisia monetary measures and inflation and also whether Divisia monetary measures are better predictor of inflation as compared to their sum counterparts. Evaluating the predictive power of monetary aggregates is more crucial in the present policy set up as we have done away with explicit monetary targeting framework and moved into a sort of multiple indictor approach wherein the growth rate of M3 monetary aggregate is considered as an important policy indicator.
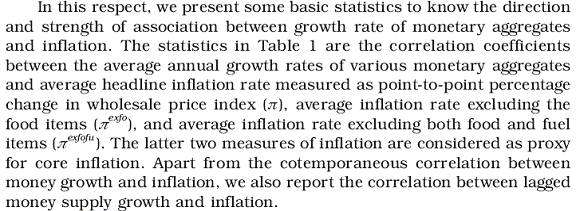
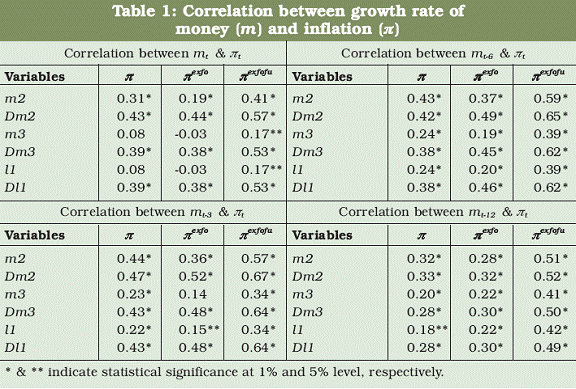
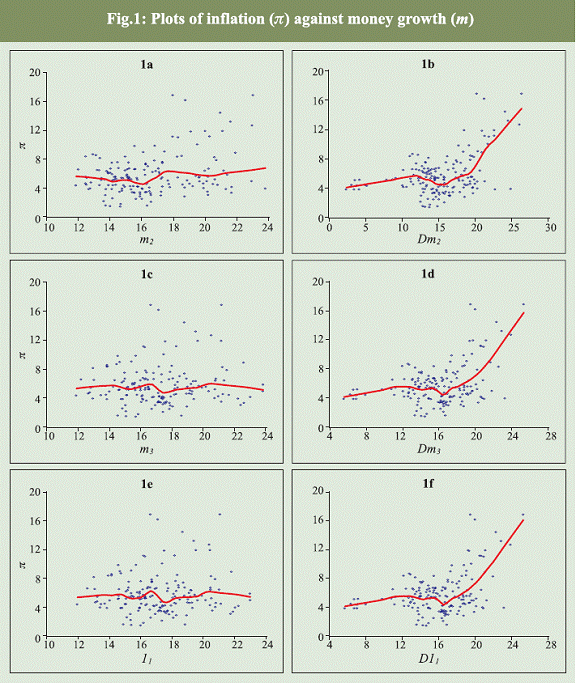
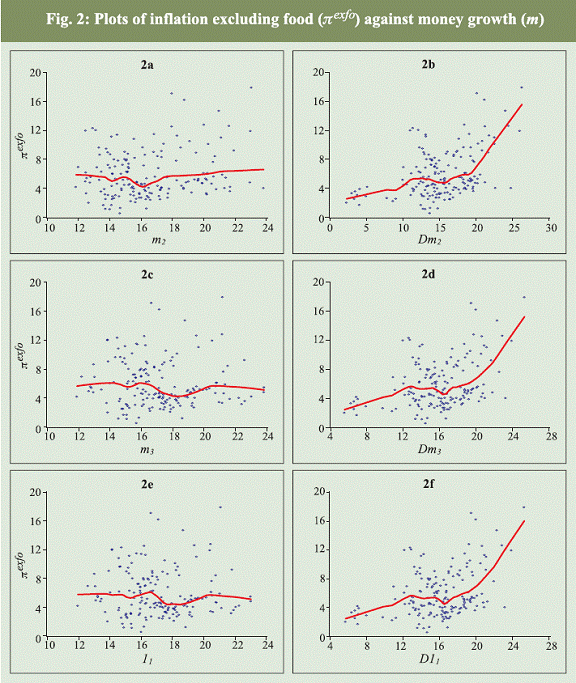
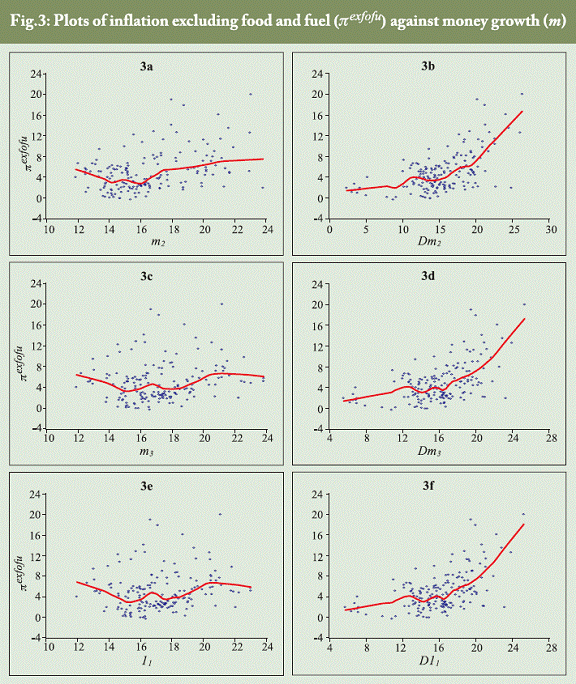
When three months lagged growth rate of monetary aggregates are related to inflation, the correlation coefficients turned out to be statistically significant irrespective of methods of monetary aggregation. However, the magnitude of correlation coefficients is found to be relatively larger with respect to growth rates of Divisia aggregates, especially at higher level of aggregation. In the case of six months and twelve months lagged money supply growth, the correlation between simple sum and Divisia monetary growth and inflation seem to be statistically significant, but the magnitude decline. Nonetheless, the growth rates of Divisia monetary aggregates seem to have consistently stronger association with both headline and core inflation measures as compared to their simple sum counterparts. There are broadly three inferences that emerge from Table 1 : (i) the growth rates of Divisia aggregates have higher correlation with inflation as compared to that of simple sum aggregates; (ii) the growth rates of Divisia aggregates have higher correlation with core inflation than with headline inflation; and (iii) the correlation between simple sum money growth and inflation seems to be declining as the levels of aggregation increases while, on the contrary, the correlation between inflation and growth rates of Divisia money increases as the level of aggregation increases. These findings are consistent with the Divisia index number theory in the sense that it weights transaction balances more heavily and thus, capturing only the share of monetary services produced by component assets. It is largely this monetary service that has more relevance to inflation. The plots of annual headline inflation against alternative measures of annual growth rates of money are produced in Fig. 1a through 1f along with a curve reflecting the plots of fit of the nearest neighbourhood regression. The nearest neibourhood fit regression of inflation on growth rates of money is obtained using the Loess method described by Cleveland (1993). The plots look like clusters and the regression fit appears to be a flat line in the case of growth rates of simple sum aggregates; suggesting that there is no clear evidence of any relationship between headline inflation and growth rates of simple sum monetary aggregates. On the contrary, there is a clear evidence of a positive association between growth rates of Divisia monetary aggregates and headline inflation. The striking feature of the evidence is that regression fit sharply increases when Divisia money growth exceeds sixteen per cent; indicating that the growth rate of Divisia aggregates beyond certain level is more inflationary. The plots in Fig. 2a through 2f exhibit the association between core inflation measured as headline inflation excluding food items and money growth and plots in Fig. 3a though 3f exhibit the relationship between money growth and core inflation measured as headline inflation excluding food and fuel items. The plots and the regression fit do not show any association between the core inflation and sum money growth while the regression fit regarding Divisia money growth is found to be sharply rising when annual money growth exceeds sixteen per cent. In sum, the evidence drawn from correlation statistics and the nearest neibourhood regression indicate that growth rate of Divisia monetary indices have stronger association with headline and conventional measures of core inflation as compared to their simple sum counterparts; thus, supporting the theoretical superiority of Divisia monetary measures over their simple sum counterparts. 6. Does growth rate of Divisia money predict inflation? In this section, we examine whether growth rates of Divisia money has an edge over their simple sum counterparts in predicting inflation. The empirical evaluation of this issue is based on the maximum likelihood approach to test for cointegration invented by Johansen (1991) and the estimation of corresponding error correction mechanism. However, we adopt the strategy of Ribba (2003) to test for cointegration and impose restrictions on the speed of adjustment parameters to infer whether growth rate of money can be a useful predictor of inflation. In this respect, we estimate the following error correction model:
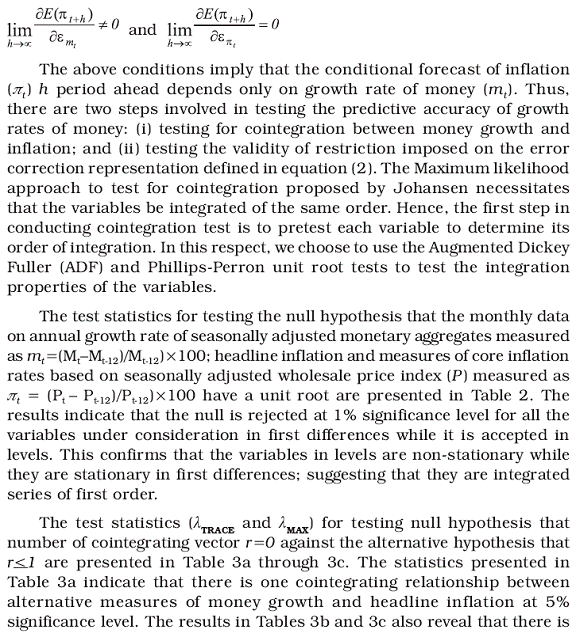
and not vice versa. In other words, there is one-way causality from money growth-to-headline inflation at zero frequency. If so,
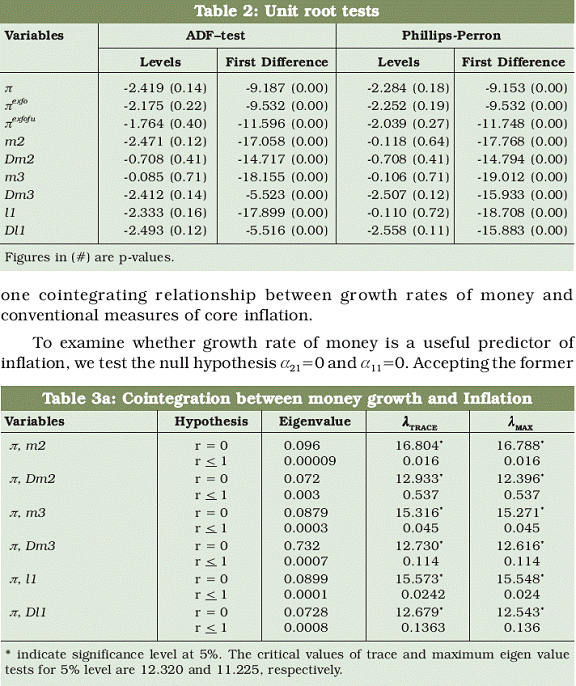
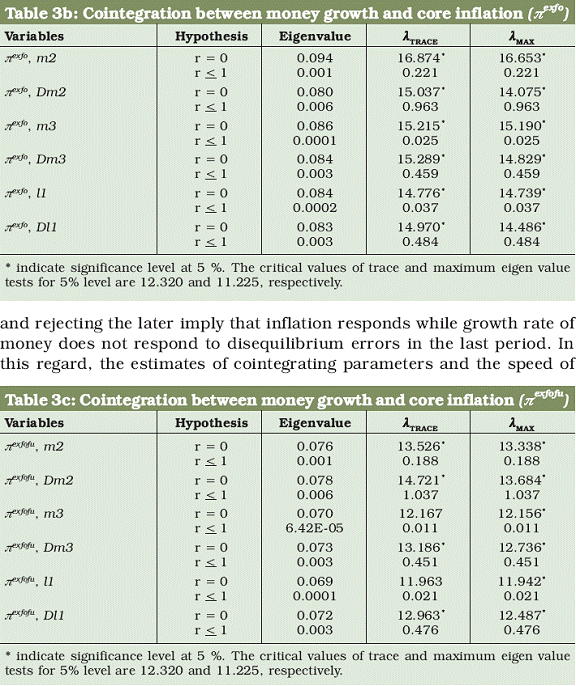
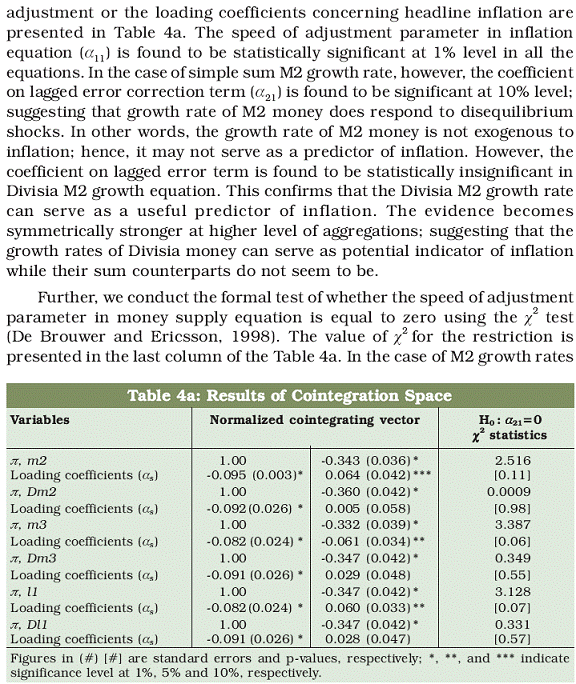
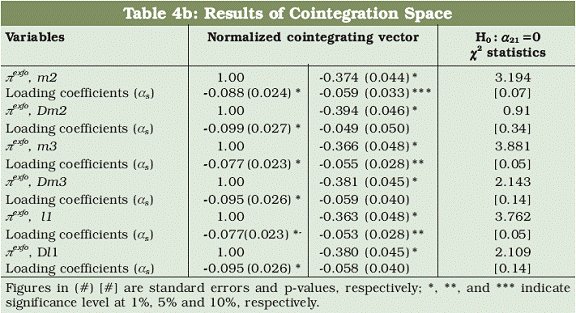
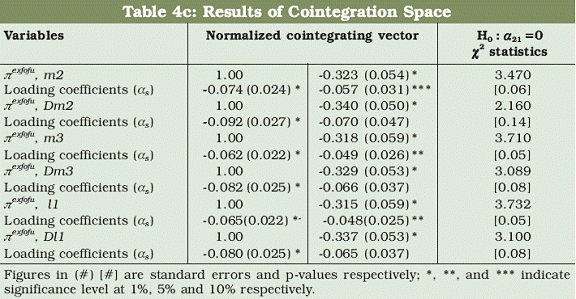
and its Divisia counterpart, the restriction is not binding at conventional level of significance. In contrast, the Divisia M3 and Divisia L1 growth rates do not respond to the discrepancy of long run equilibrium relationship since the restriction is not binding while the restriction is binding in the case of simple sum M3 and L1 growth rates. These evidences indicate that the growth rates of Divisia aggregates at higher level of aggregation seem to be weakly exogenous to inflation while the growth rates of simple sum monetary aggregates have feedback relationship with inflation. This suggests that Divisia money growth especially at higher level of aggregation can serve as potential predictor of inflation. The cointegrating parameters and the corresponding loading coefficients for core inflation measures are presented in Tables 4b and 4c. These evidences are qualitatively similar to the results produced in Table 4a; suggesting that the growth rate of Divisia aggregates can serve as potential indicators of the two conventional measures of core inflation under consideration while their simple sum counterparts cannot be used as an indicator of inflation.
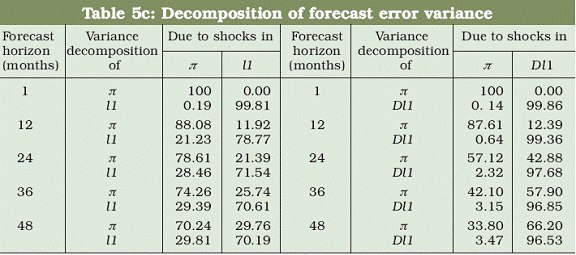
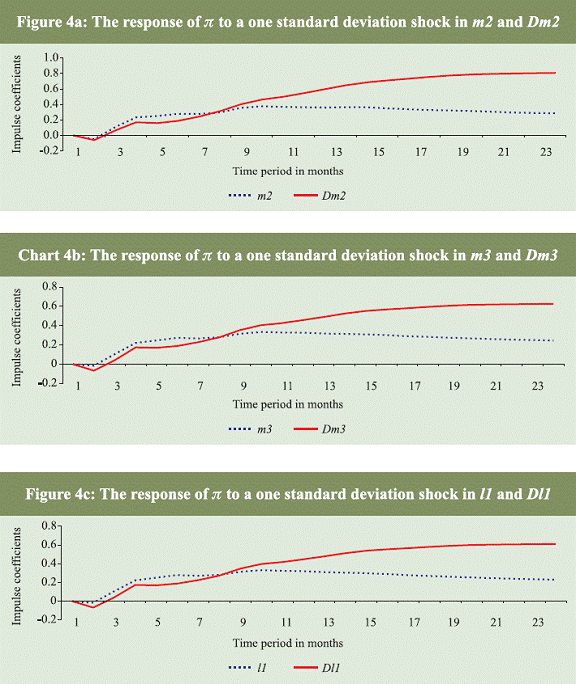
The plots of impulse response coefficients of headline inflation for a one standard deviation shock in the growth rates of sum M2 and of Divisia M2 are produced in Fig. 4a. The solid line indicates the response of inflation to a shock in growth rate of Divisia M2 while the dotted line indicates the response of inflation to a shock in the growth rate of sum M2. Although there is hardly any difference in the response of inflation to shocks in the growth rates of both monetary measures in the initial period of 8 months, the response of inflation to the shock in the growth rate of Divisia M2 subsequently rises while it declines in response to the shock in growth rate of sum M2 money. The plots of impulse coefficients produced in Tables 4b and 4c also indicate that response of inflation to shocks in the growth rates of Divisia M3 and Divisia L1 is relatively stronger as compared to the response of inflation to shocks in the growth rates of corresponding sum aggregates. The results concerning the proportion of forecast error variance of headline inflation and growth rate of sum and Divisia M2 money for the forecast horizon of upto 48 months are presented in Table 5a. The forecast error variance of inflation is increasingly explained by shocks in growth rate of M2 money and at the same time forecast error variance of sum M2 growth is also increasingly explained by shocks in headline inflation as the forecast horizon increases. For instance, 15.12 per cent of forecast variance of inflation is explained by shocks in growth rate of sum M2 money in 12 months forecast horizon and further increases to 36.99 per cent in 48 months forecast horizon. The error variance of sum M2 growth explained by shocks in inflation increases from 21.29 per cent in 12 months forecast horizon to 31.01 per cent in 48 months forecast horizon. These evidences indicate that the growth rate of sum M2 is not an exogenous sequence to headline inflation. On the contrary, the proportion of error variance of inflation due to shocks in the growth rate of Divisia M2 jumps from 15.1 per cent in 12 months forecast horizon to 53.84 per cent in 24 months forecast horizon and to 77.09 per cent in 48 months forecast horizon. In contrast to the evidence concerning growth rate of sum M2, 99.15 per cent of forecast error variance of Divisia M2 growth is explained by its own shock even at 48 months forecast horizon. This indicates that the growth rate of Divisia M2 is an exogenous sequence in the model.
The corresponding results concerning Divisia M3 and Divisia L1 presented in Tables 5b and 5c, respectively further confirm that the growth rates of Divisia monetary aggregates outperform their simple sum counterparts. Thus, the evidence from forecast error variance also indicate that the growth rate of Divisia monetary aggregates can serve as better indicators of inflation as compared to the growth rates of simple sum aggregates10 .
The focus of this study is to investigate whether weighted monetary aggregates constructed from Divisia quantity index number formula has an edge over their simple sum aggregates. Two official measures of monetary aggregates, M2 and M3, and one liquidity measure, L1, are considered for empirical comparison of their superiority especially in the context of their role as an indicator of inflation. In this respect, the study constructs monthly Divisia quantity indices for the sample period from April 1993 to June 2008, covering fairly the liberalized financial regime. The empirical evidences are found to support the theoretical superiority of Divisia monetary aggregates over their corresponding simple sum aggregates. The correlation coefficients indicated that there is relatively strong association between annual headline inflation rate measured as point-topoint percentage change in wholesale price index and Divisia monetary measures. Also, the potential gain of Divisia monetary measures is found to be more visible when they are correlated with two conventional measures of core inflation. On the contrary, the correlation between inflation and growth rates of simple sum aggregates seems to be weak. The plots of annual headline inflation against alternative measures of annual growth rates of money indicated that there is no clear evidence of any relationship between both headline or core inflation measures and growth rates of simple sum monetary aggregates. This stylized observation is further supported by the fit of the nearest neighbourhood regression of inflation on growth rates of money in the sense that the fit appears to be a flat line. On the contrary, there is a clear evidence of a positive association between growth rates of Divisia monetary aggregates and inflation. The striking feature of the evidence is that regression fit sharply rises when Divisia monetary growth exceeds sixteen per cent. This indicates that the growth rate of Divisia money beyond certain level is more inflationary. The econometric evidence derived from a vector error correction model indicated that the growth rates of Divisia aggregates serve as better predictor of both headline and core inflation measures whereas there is a feedback causal relationship from inflation to growth rates of simple sum monetary aggregates. Hence, the official measures of simple sum aggregates seem to be less useful in predicting inflation. These inferences are further corroborated by the results derived from impulse response function and decomposition of forecast error variance of inflation and growth rates of monetary aggregates. Although there is only little difference in the response of inflation to shocks in growth rates of sum and Divisia monetary aggregates in the initial period of 8 months, the response of inflation to the shocks in the growth rates of Divisia aggregates subsequently rises while it declines in response to the shocks in growth rates of corresponding growth rates of simple sum aggregates. The results concerning the forecast error variance indicated that the growth rates of Divisia monetary aggregates emerge as an exogenous sequence with respect to inflation and on the contrary, error variance of growth rates of sum aggregates is increasingly explained by the shocks in inflation. These evidence suggest that the growth rates of sum aggregates cannot serve as an indicator of inflation while that of Divisia monetary measures can be used as an indicator of inflation. The overall empirical evidences of this study unambiguously establish the superiority of Divisia monetary aggregates over their corresponding simple sum aggregates in predicting either headline inflation or the conventional measures of core inflation which are widely used by the central banks all over the world. Hence, the study suggests that the RBI can observe the growth rates of Divisia monetary aggregates to have a better understanding of future inflation within its multiple indicator approach. This, however, does not mean that the RBI can dispense the use of M3 money. It can better be used for accounting purposes than as an indicator of future inflationary pressure. Also, the RBI can publish monthly time series data on various measures of Divisia money, as it would provide more reliable information regarding inflation expectation to the public; hence, the policy gains more credibility11 . The study reports the monthly time series data on Divisia monetary measures in the Appendix B for further exploration of its merits in applications. The most important among them are: (i) examining the use of Divisia money as predictor of output growth, especially the growth rate of manufacturing output; (ii) evaluating the stability of demand for Divisia money as compared to its simple sum counterparts; and (iii) investigating the role of Divisia money in macroeconomic models to establish its theoretical superiorities12 . Acharya, D. (1998), “On Some Empirical Aspects of New Monetary Aggregates for India”, Unpublished Ph. D. Thesis, Department of Economics, University of Hyderabad, Hyderabad. Acharya, D. and B. Kamaiah (1998), “Currency Equivalent Monetary Aggregates: Do they have an Edge over their Simple Sum Counterparts”, Economic and Political Weekly, March 28, 717-19. Acharya, D. and B. Kamaiah (1999), “Monetary Asset Separability: Some Nonparametric Evidence”, The Indian Economic Journal, 47, 56-67. Acharya, D. and B. Kamaiah (2001), “Simple Sum Vs. Divisia Monetary Aggregates: An Empirical Evaluation”, Economic and Political Weekly, January 27, 317-326. Barnett, William A. (1978), “The User Cost of Money,” Economics Letters, 1, 145-149. Barnett. William A. (1980), “ Economic Monetary Aggregates: An Application of Index Number and Aggregation Theory,” Journal of Econometrics, 14, 11-48. Barnett, W. A., D. Fisher and A. Serletis (1992), “Consumer Theory and the Demand for Money”, Journal of Economic Literature, 30, 2086-2119. Barnett, W. A. (1995), “Exact Aggregation under Risk,” in W. A. Barnett, M. Salles, H. Moulin, and N. Schofield (eds.), Social Choice, Welfare and Ethics, Cambridge University Press, Cambridge, 353-374. Barnett, W. A. (1997), “The Microeconomic Theory of Monetary Aggregation,” in W. A. Barnett (eds.), New Approaches to Monetary Economics, Cambridge University Press, Cambridge, 115-168. Barnett, W. A., Y. Liu and M. Jensen (1997), “CAPM Risk Adjustment for Exact Aggregation over Financial Assets,” Macroeconomic Dynamics, 1, 485-512. Barnett, W. A. and Y. Liu (2000), “Beyond the Risk Neutral Utility Function,” in M. T. Belongia and J. E. Binner (eds.), Divisia Monetary Aggregates: Theory and Practice, London, Palgrave, 11-27. Barnett, W. A., M. Hinich, and P. Yue (2000), “The Exact Theoretical Rational Expectations Monetary Aggregate,” Macroeconomic Dynamics, 4, 197-221. Barnett, W. A. and Shu Wu (2005), “On User Costs of Risky Monetary Assets,” Annals of Finance, 1, 35-50. Barro, R.J. and D.B. Gordon (1983), “A Positive Theory of Monetary Policy in a Natural Rate Model”, Journal of Political Economy, 91, 589-610. Binner, J. M., A. Fielding and A. W. Mullineux (1999), “Divisia Money in a Composite Leading Indicator of Inflation”, Applied Economics, 31, 1021-1031. Bloor, C., C. Hunt, Tim Ng and H. Pepper (2008), “The Use of Money and Credit Measures in Contemporary Monetary Policy”, Reserve Bank of New Zealand Bulletin, 71, 1-15. Cleveland, William S. (1993), Visualizing Data, Summit, NJ: Hobart Press. De Brouwer, G. and Neil Ericsson (1998), “Modelling Inflation in Australia”, Journal of Business and Economic Statistics, 16, 433-49. Diewert, W. (1976), “Exact and Superlative Index Numbers”, Journal of Econometrics, 14, 115-46. Friedman, B. (1990), “Targets and Instruments of Monetary Policy”. In B. Friedman and F. Hahn (eds.) Handbook of Monetary Economics, Amsterdam, North-Holland. Goodhart, C. (2007) “Whatever Became of the Monetary Aggregate?” LSE Financial Markets Group Special Paper No. 172. Jadhav, N. (1989), “Weighted Monetary Aggregates: Rational and Relevance for India”, Reserve Bank of India Occasional Papers, 10, 39-56. Jadhav, N. (1994), Monetary Economics for India, Macmillan India Ltd. Jalan, Bimal (2002), “Research and Policy Developments in Money, Finance and the External Sector”, in M.S. Ahluwalia, Y.V. Reddy and S. S. Tarapore (eds.) Macroeconomics and Monetary Policy: Issues for a Reforming Economy, Oxford University Press, New Delhi. Johansen, S. (1991), “Estimation and Hypothesis Testing of Cointegration Vectors in Gaussian Vector Autoregressive Models”, Econometrica, 59, 1551–1580. Kamaiah, B. and L. M. Bhole (1982), “An Empirical Definition of Money: Some Factor Analytic Evidence for India”, Malayan Economic Review, 27, 35-44. Kamaiah, B. and Ganti Subrahmanyam (1983), “Some Further Evidences on the Definition of Money Stock for India”, Prajnan, 12, 175-183. Kannan, R. (1989), “Weighted Monetary Aggregates for India: 1970-86, Prajnan, 18, 453-460. Klein, B. (1974), “Competitive Interest Payments on Bank Deposits and the Long-run Demand for Money”, American Economic Review, 64, 931-40. Korhonen, I. and A. Mehrotra (2007), “Money Demand in Post-crisis Russia: De-dollarisation and Re-monetisation”, BOFIT Discussion Papers14. Kydland, F.E. and E.C. Presscott (1977), “Rules Rather Than Discretion: The Inconsistency of Optimal Plans”. Journal of Political Economy, 85, 473-91 Laurens, Bernard J. and R. Maino (2007), “China: Strengthening Monetary Policy Implementation”, IMF Working Paper, WP/07/14. Nelson, E. (2003) “The Future of Monetary Aggregates in Monetary Policy Analysis”, Journal of Monetary Economics, 50, 1029-59. Ramachandran, M. and B. Kamaiah (1994), “Separability of Monetary Assets: Some Evidence from Approximation Analysis for India” Journal of Quantitative Economics, 10, 337-50. Ramachandran, M. (1994), “Monetary Aggregation and Monetary Aggregates: Some Issues and Evidence for India”, Unpublished Ph. D. Thesis, Department of Economics, University of Hyderabad, Hyderabad. Ramachandran, M. (1995), “Fiscal and Monetary Actions: A Test of Relative Importance of the Economic Monetary Aggregates and their Simple Sum Counterparts”, Prajnan, 24, 125-137. Ramachandran, M. (1998), “The Optimal Level of Monetary Aggregation and Monetary Targeting in India”, The Indian Economic Journal, Special Issue in Monetary Economics, 46, 84-99. Ramachandran, M. (2000), “Fiscal Deficit, RBI Autonomy and Monetary Management”, Economic and Political Weekly, 35, 3266-3272. Ramachandran, M. (2004), “Do Broad Money, Output and Prices Stand for a Stable Relationship in India”, Journal of Policy Modelling, 26, 983-1001. Reserve Bank of India (1985), “Report of the Committee to Review the Working of the Monetary System”. (Chairman: Sukhomoy Chakravarty). Reserve Bank of India (1998), “Money Supply: Analytics and Methodology of Compilation”, Report of the Third Working Group (Chairman: Dr. Y.V. Reddy), Mumbai. Reserve Bank of India (2005), Report on Currency and Finance 2003-04. Reserve Bank of India (2007), Report on Currency and Finance 2005-06, 67-118. Ribba, A. (2003), “Permanent-transitory Decompositions and Traditional Measures of Core Inflation, Economics Letters, 81, 109-116. Stracca, L. (2001), “Does Liquidity Matter? Properties of a Synthetic Divisia Monetary Aggregate in the Euro Area”, European Central Bank Working Paper No. 79. Subrahmanyam, Ganti and S. B. Swami (1991), “Simple Sum vs. Superlative Monetary Aggregates for India”, Journal of Quantitative Economics, 17, 79-92. Subrahmanyam, Ganti and S. B. Swami (1994), “Do M1, M2 and M3 Define Optimal Asset Groupings for India”, Journal of Quantitative Economics, 10, 351-360. Trichet, J.C. (2004), “The ECB’s Use of Statistics and Other Information for Monetary Policy”, Keynote Address Delivered at the OECD’s World Forum on Key Indicators of Statistics, Knowledge and Policy, Palermo, November 11. Vasudevan, A. (1977), “Demand for Money in India - A Survey of Literature”. RBI Staff Occasional Papers, 2, 58-83. Volcker, P. A. (1978), “The Role of Monetary Targets in an Age of Inflation”. Journal of Monetary Economics, 4, 329-39.
* Prof. M. Ramachandran is a Professor of Economics in the Department of Economics, Pondicherry University. Shri Rajib Das is Director and Shri Binod B. Bhoi is Assistant Adviser in the Department of Economic Analysis and Policy of the Bank. 1Ramachandran (2000) observed that the growing openness of the economy and the market oriented reforms in the financial sector had brought in significant changes in the money supply process and as a consequence, the monetary targeting turned out to be a more complicated and less useful exercise. 2This large panel of indicators is often criticised as a ‘check list’ approach, which tend to undermine the concept of a nominal anchor for monetary policy. However, in line with the transition of the Indian economy towards an open market-oriented economic system, there were shifts in the channels of monetary policy transmission, which required the central bank to operate through all the paths that transmit its policy impulses to the real economy. 3The study by Kannan (1989) provided supporting evidence for the use of weighted monetary aggregates to predict nominal income. However, Jadhav (1989) found that the methodology followed by Kannan to obtain weights had circular reasoning. The better predictability of monetary aggregates is embedded in the very construction of weights. 4 The recent studies by Barnett (1995), Barnett, Liu, and Jensen (1997), Barnett, Hinich, and Yue (2000), Barnett and Liu (2000) and Barnett and Shu Wu (2005) focus on risk adjusted user cost of money. The present study has not taken up this exercise as the aggregates considered by this study contain monetary component which are, to a larger extent, risk free. 5 Barnett (1978) defines the benchmark return as the yield on human capital in a world where there is no slavery system. 6 There was a suggestion from the referee of this study to conduct the empirical investigation for the period beginning from 1998, because major deregulation of interest rates is perceived to have taken place since 1998. However, we could not find strong cointegrating relationship between growth rates of both Divisa / simple sum monetary aggregates and inflation. This might be due to the small size of sample given the low power of the test that we have used in the study. 7 The narrow monetary aggregate M1 is not considered as their components are highly liquid assest; hence, there will be hardly any difference between sum M1 and its Divisia counterpart. 8 We have received suggestions to use yield on long-term government securities as a proxy for benchmark interest rate. We could not use it as a proxy for benchmark rate because we encounter negative user cost at large number of data points. 9 The empirical studies at large assumed zero return on currency and demand deposits. However, commercial banks compete among themselves to attract funds through current account by offering nonmonetary benefits to the account holders. As a consequence, construction of time series data on implicit yield on demand deposit received attention in the literature and an attempt was initiated by Klein (1974). There are few studies that take into account such measure as return on demand deposits while constructing monetary aggregates. We have assumed zero return on demand deposits since construction of implicit yield on demand deposits itself can be an independent study. 10 The results regarding impulse response and variance decomposition pertaining to conventional measures of core inflation under consideration are consistent with the evidence concerning headline inflation. The results are available from the authors on request. 11 Divisia Monetary Aggregates are available for the United Kingdom by the Bank of England and for the United States by the Federal Reserve Bank of St. Louis besides regular computation of the same by the National Bank of Poland. In addition, Divisia monetary measure is used by the executives of Bank of Japan for an assessment of the economy. 12 We have not attempted these issues in the present study since our focus is to examine the relative role of Divisia monetary aggregates as predictor of inflation. |
|||||||||||||||||||||||||||||||||||||||||||||||||||||||||||||||||||||||||||||||||||||||||||||||||||||||||||||||||||||||||||||||||||||||||||||||||||||||||||||||||||||||||||||||||||||||||||||||||||||||||||||||||||||||||||||||||||||||||||||||||||||||||||||||||||||||||||||||||||||||||||||||||||||||||||||||||||||||||||||||||||||||||||||||||||||||||||||||||||||||||||||||||||||||||||||||||||||||||||||||||||||||||||||||||||||||||||||||||||||||||||||||||||||||||||||||||||||||||||||||||||||||||||||||||||||||||||||||||||||||||||||||||||||||||||||||||||||||||||||||||||||||||||||||||||||||||||||||||||||||||||||||||||||||||||||||||||||||||||||||||||||||||||||||||||||||||||||||||||||||||||||||||||||||||||||||||||||||||||||||||||||||||||||||||||||||||||||||||||||||||||||||||||||||||||||||||||||||||||||||||||||||||||||||||||||||||||||||||||||||||||||||||||||||||||||||||||||||||||||||||||||||||||||||||||||||||||||||||||||||||||||||||||||||||||||||||||||||||||||||||||||||||||||||||||||||||||||||||||||||
పేజీ చివరిగా అప్డేట్ చేయబడిన తేదీ:


