 IST,
IST,
V. Impact and Policy Responses In India: Financial Sector
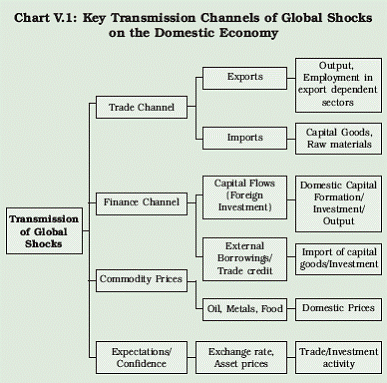
5.1 The developments in the global economy during the past three decades indicate that the process of financial development and globalisation is, at times, susceptible to crisis. Nevertheless, it is argued that the recurrence of financial crisis has not changed the positive relation between financial development and growth (Lipsky, 2009). The global crisis of 2008 that originated in the mortgage sector of the US spread to the entire financial system and the real economy across countries. Exchange rates in many economies depreciated, equity prices crashed, volatility heightened, liquidity dried up in financial markets, and the cost of external borrowings moved significantly upward. While in the case of advanced countries the external shocks were largely carried through direct channels with the exposure of banking systems to the sub-prime mortgage assets, the contagion to developing countries was transmitted mainly through trade, finance, and commodity price channels and rapid changes in expectations (Subbarao, 2009). The rising financial linkages resulted in a higher degree of business cycle co-movement and the greater wealth effect of external shocks, while the trade linkages generated both demand-side and supplyside spillovers across countries, resulting in more highly correlated output fluctuations. 5.2 Initially, it appeared that emerging market economies (EMEs) are better positioned to weather the storm created by the global financial meltdown on the back of substantial foreign exchange reserve cushions, improved policy frameworks and generally robust banking sector and corporate balance sheets. However, any hope about EMEs escaping unscathed could not be sustained after the failure of Lehman Brothers in September 2008 and the ensuing rise in global risk aversion; EMEs were also adversely affected by the spillover effects of the macroeconomic turbulences created by the global financial meltdown. Depressed consumer and investor spending in the advanced economies led to a slump in demand for EME exports, which reinforced the inflow reversal (BIS Annual Report, 2008-09). However, the effect varied across these economies depending on their level of global integration. 5.3 During the initial phase of the crisis, the impact on the Indian financial markets was rather muted; however, since mid-September 2008, the impact on Indian financial markets became amplified. In fact, banks dominated financial system and their negligible engagement in offbalance sheet activities and illiquid securitised assets, which remained at the heart of the recent global financial crisis in advanced economies, protected India from early turmoil in international financial markets. Nonetheless, India could not remain unscathed and the global developments affected its financial and real activities in the second half of 2008-09. 5.4 India’s financial markets – equity markets, money markets, forex markets and credit markets – had all come under pressure from a number of directions. First, the substitution of overseas financing by domestic financing brought both the money market and credit market under pressure. Second, the forex market came under pressure because of reversal of capital flows as part of the global deleveraging process and, simultaneously, corporates were converting the funds raised locally into foreign currency to meet their external obligations. Third, the Reserve Bank’s intervention in the forex market to manage the volatility in the rupee further added to liquidity tightening. Fourth, Indian banks as well as corporates were finding it difficult to raise funds from external sources as a consequence of the global liquidity squeeze and, as a result, pressure escalated sharply on banks for the credit requirements of corporates. Also, in their frantic search for substitute financing, corporates withdrew their investments from domestic money market mutual funds, putting redemption pressure on the mutual funds and, down the line, on non-banking financial companies (NBFCs) where the mutual funds had invested a significant portion of their funds. Finally, India also witnessed large capital outflows, exchange rate depreciation, protracted contraction in merchandise exports, and a steep fall in equity prices in the second half of 2008-09. All these factors resulted in a sharp deceleration in the growth of the Indian economy in the second half of 2008-09. 5.5 Against this background, Chapter 5 and Chapter 6 cover the impact of the global financial crisis on the Indian economy and the policy responses of the authorities. Here, in Chapter 5, the impact on India’s financial sector is analysed in detail. In Chapter 6, the final impact through the trade and financial channels on saving, investment and growth is discussed. 5.6 In examining the impact of the financial crisis on the financial sector, this chapter first sets out the context by analysing the evolving global integration of the Indian economy through trade and financial channels over the years in Section I. The impact of the crisis on various financial markets and respective policy measures has been delineated in Section II. The spillover effects traversing to the banking sector, mutual funds and non-banking finance companies and policy measures to counter their impact have been examined in Section III. The policy responses to the crisis by the Government of India and the Reserve Bank are discussed in Section IV. Section V contatins the conclusions. I. CHANNELS OF GLOBAL INTEGRATION 5.7 The literature recognises four principal channels through which global developments could percolate to the domestic economy. These relate to foreign trade, cross-border financial flows, global commodity prices and expectations/confidence. Although distinguished in various ways, these channels share some features. First, each channel could be associated with some direct and indirect effects. Second, all these channels may be interlinked and work simultaneously to cause an impact that is different from what could be achieved if each channel work independently. Both the trade and finance channels could interact due to the interaction between trade and trade credit and commercial borrowings, and foreign direct investment and exports and imports. Third, the varied impact of trade and financial channels could be associated with their micro characteristics (Chart V.1). 5.8 The relationship between foreign trade and the economic growth of nations has been analysed extensively in the literature. Basically, the foreign trade channel is expected to work through exports and imports of merchandise goods and tradable services. There are a number of reasons within trade theory to support the export-led growth hypothesis (Havyrlyshn, 1990; Krugman, 1987). Exports are expected to contribute to growth through, inter alia, enhanced demand, economies of scale, better technology and productivity, optimal allocation of resources, and research and development. The transmission of the trade channel could occur in three ways: the income effect, competitiveness effect, and cheap-import effect (Forbes, 2001). The empirical literature provides a mixed perspective on the causal nexus between exports and economic growth. Eichengreen and Rose (1999) and Glick and Rose (1998) in their study of 20 industrial countries supported trade links rather than macroeconomic similarities as the dominant channel for contagious international transmission of shocks. A number of empirical studies also argue that trade was not important in the propagation of crises. Masson (1998) categorised trade as a spillover effect and showed that it was not important during the Mexican crisis or the Asian crisis. Harrigan (2000) also rejected the trade channel; the impact of the Asian crisis on the US industries was small and localised.
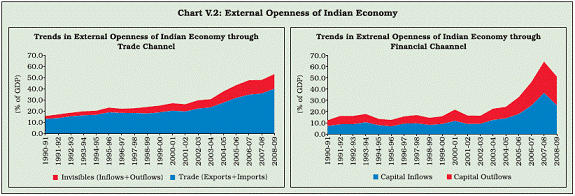
5.9 Similar to the trade channel, the relationship between finance and growth in general and the importance of foreign capital for the economic progress of developing economies has been deliberated at length over the years. In theory, financial globalisation can help developing countries to better manage output and consumption volatility (Prasad et al., 2003). Indeed, a variety of theories imply that the volatility of consumption relative to that of output should go down as the degree of financial integration increases; the essence of global financial diversification is that a country is able to offload some of its income risk in world markets. Since most developing countries are rather specialised in their output and factor endowment structures, they can, in theory, obtain even bigger gains than developed countries through international consumption risk-sharing, that is, by effectively selling off a stake in their domestic output in return for a stake in global output (Box V.1). 5.10 Analytical arguments supporting financial openness revolve around considerations such as the benefits of international risk sharing for consumption smoothing, the positive impact of capital flows on domestic investment and growth, enhanced macroeconomic discipline and increased efficiency as well as greater stability of the domestic financial system associated with financial openness (Agenor, 2001). In recent years, there appears to be some rethinking about financial globalisation based on the experiences of various crises in the late 1990s and the current global imbalances. Owing to contagion effects, some economists have viewed increasing capital account liberalisation and unfettered capital flows as a serious impediment to global financial stability (Bhagwati, 1998; Rodrik, 1998; Stiglitz, 2002). Others argue that increased capital account openness has largely proven essential for countries aiming to upgrade from lower to middle income status. Thus, it is widely accepted that the beneficial effects of international capital inflows can be harnessed by ensuring sound macroeconomic policies and strong institutions and adopting an appropriate regulatory framework for the stability of financial systems. 5.11 The potential costs associated with financial globalisation include a high degree of concentration of capital flows, misallocation of flows which may hamper their growth effects and exacerbate domestic distortions, the loss of macroeconomic stability, the pro-cyclical nature of short-term capital flows and the risk of abrupt reversals, a high degree of volatility of capital flows in part due to herding and contagion effects and risks associated with foreign bank penetration (Dadush, Dasgupta and Ratha, 2000). Thus, unlike trade integration, where benefits to all countries are demonstrable, in the case of financial integration a threshold in terms of preparedness and resilience of the economy is important for a country to get full benefits (Kose et al., 2006). 5.12 An issue that assumed importance during the present global crisis is the relative strength of various channels of transmission especially against the backdrop of the sharp escalation of India’s financial integration with global markets over the past few years. While the crisis was transmitted to India through both the trade and finance channels, the latter was by far more significant in terms of the intensity of the impact (Subbarao, 2009). Thus, how global asset price movements affect the domestic asset market and, in turn, the real economy has assumed critical significance during the recent global financial crisis. While the movement in financial flows could have a direct impact on the economy through changes in the availability of credit and investment, these financial flows also simultaneously affected the price of credit and the return on investment. Box V.1 Traditional development thinking was guided by the notion that the savings gap could be bridged through capital inflows from countries with higher income and savings in order to achieve faster growth. According to this premise, the strategy to reduce global poverty and to allow the catching up of poorer countries is built on two blocks. First, the endowments of less developed countries can be enriched by giving them access to those factors of production that they lack – through the provision of private foreign capital or official aid. Second, as developed countries open up their markets to the products of developing countries that possess natural resources or abundant labour but little capital, the developing countries are able to raise their export earnings and capacity to import more sophisticated equipment. The savings gap theory refers to the standard growth model (Harrod-Domar model), which identifies certain necessary components of growth, but does not explain the functional relationships that determine the interaction of these components. Most approaches based on this growth theory see the rate of capital accumulation determined by the difference between capital deepening (the capital-labour ratio) and capital widening (the amount of saving per capita needed to hold the capital-labour ratio constant as the population grows and the existing capital stock depreciates). Countries with relatively low growth rates are encouraged to increase their savings enough to keep up with the requirements of capital widening. According to the neoclassical growth model, savings determine capital accumulation (as in the Harrod-Domar model), but savings and investment are not always related to economic growth (in contrast to the Harrod-Domar model). Savings (and investment) drive growth only when the economy is out of equilibrium, but they do not influence growth when the economy is in equilibrium. In the long run, growth is determined solely by technology, which in turn is determined exogenously by non-economic variables. It is conceived that consumers prefer a stable consumption path and any transitory shock to income is, under normal circumstances, compensated by a change in savings in the same direction and vice versa. If GDP growth increases permanently, individuals will immediately jump to a higher consumption path and the increase in growth will lead to lower savings. By contrast, if a shock has its origin in the savings rate, for example, if a change in preferences leads to higher savings, then both investment and growth increase (as in the Harrod-Domar model), at least in the transition to a “new steady state”. Thus, the model predicts different relationships between savings and growth, depending on the nature of the shock and on whether the shock is permanent or temporary. These assumptions are based on a closed economy model, in which ex post national savings are always equal to ex post investment. In open economy models with free capital flows – savers can invest in other countries – there should be no correlation between domestic savings and investment decisions. Under the assumption that profits per unit of output are the same in all countries, the marginal product of capital should be higher in countries with a relatively small capital stock, which should record net capital inflows (Lucas, 1990). Accordingly, the observed relatively small capital flows from developed to developing countries – the “Lucas Paradox” – triggered debate that sought to explain the factors limiting the incentives to invest in developing economies. The recent literature seeks to explain the Lucas Paradox by switching the emphasis from factor accumulation to total factor productivity, which is the part of the overall productivity increase that cannot be attributed to either labour or capital. It also argues that countries with faster productivity growth will have a lower savings rate because agents anticipate the potential for future consumption, which increases with rising productivity growth. The neoclassical open economy model predicts that an exogenous increase in national savings will be associated with an improvement in the current account, but that it will have no effect on domestic investment and growth. Similar to the savings-gap model, the neoclassical model predicts a positive correlation between savings and growth for a closed economy. References Lucas R.E. Jr. 1990. “Why Doesn’t Capital Flow from Rich to Poor Countries?” American Economic Review, 80(2): 92–96. UNCTAD. 2008. “Foreign Capital and Growth.” Trade and Development Report 2008. United Nations. Indian Context 5.13 The globalisation process in India was strengthened and reinforced in the 1990s and 2000s due to several important developments. First, trade openness (goods and services trade) increased substantially with the trade-GDP ratio doubling since 1999-2000. Second, services, which were largely considered non-tradable, turned increasingly tradable mainly due to off-shoring led by rapid innovations in information technology, labelled as information technology-enabled services (ITES) and business process outsourcing (BPO). Third, the trade channel of global integration has been, concomitantly, supported by the migration channel with the competitive edge of human resources in knowledge-based services. The rising importance of the human channel, which operates directly through remittances and indirectly through trade in goods and services, in strengthening India’s global integration is reflected in the widening gap between exports and imports of goods and services and current account receipts and payments as percentage of GDP, which increased from about 2 per cent in 1990-91 to around 7 per cent during 2008-09. Fourth, the economy became more open to external capital flows as the gross capital account-GDP ratio witnessed a more than three-fold increase during the same period. Fifth, higher capital account openness also strengthened the integration of domestic markets with global markets, which was reflected in the stronger correlations of domestic interest rates, equity and commodity prices with their global counterparts; these developments also facilitated the role of expectations in transmitting global shocks to the domestic economy. Sixth, even in commodityproducing sectors, global integration came through prices and not necessarily through physical trade in commodities, as global price movements have an important expectation impact on domestic prices. Finally, greater synchronisation of the domestic business cycles with the global cycles implied that the external shocks could have a greater and more rapid impact on the domestic economy (Table 5.1 and Chart V.2).
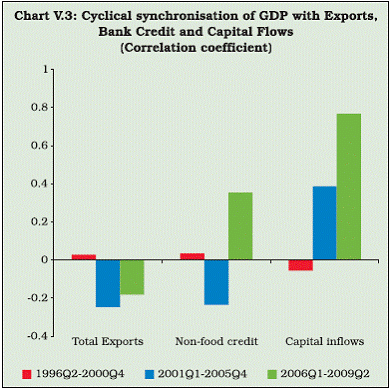
5.14 The increasing liberalisation of capital account enabled the financial channel to foster the global integration of the Indian economy as manifested in the rising share of capital flows to the GDP (Chart V.2). In fact, India’s financial integration with the world has been as deep as India’s trade globalisation, if not deeper (Subbarao, 2009). The deceleration in the growth of the Indian economy on account of the current global slowdown is also testimony to the increased global integration of the India during recent years. 5.15 In India, it appears that all four channels of transmission (trade, financial, commodity prices and expectation channels) operated and adversely affected real activities during the recent global crisis; however, the strengths of different channels of transmission varied. The analysis of the trend in the cyclical synchronisation shows that the financial channel of transmission was more pronounced during recent periods, reflecting the strengthening of the global integration of the Indian economy through increasing financial flows (Chart V.3). A vector autoregression (VAR) model was estimated with GDP growth, total exports (goods & services), non-food credit (NFC), net capital flows, call money rate, and Bombay Stock Exchange (Sensex) from 1996 to 2009 to ascertain the strength of trade and financial channels. The Cholesky variance decomposition suggests that about 50 per cent of variation in GDP is explained by financial variables, viz., bank credit, capital inflows, call rate, and the Sensex, while exports of goods and services explains about 9 per cent of the variation. This implies that financial channels have assumed a more dominant role in transmitting the effects of global developments in the Indian economy during recent periods. 5.16 The relative strengths of various channels of transmission through which the crisis was transmitted to India have been highlighted in several fora. It was felt that the financial channel was more pronounced due to increasing globalisation in the recent period. The increase in trade and liberalisation of the capital account have led to higher global integration of the Indian economy which, in turn, also made India vulnerable to global shocks. Empirically also, it has been established that the financial channels have assumed a more dominant role in transmitting the effects of global developments to the Indian economy during the recent periods. In the next section, the transmission of the current global crisis to the financial markets of India is examined.
II. IMPACT OF GLOBAL CRISIS ON FINANCIAL MARKETS 5.17 India’s financial markets – equity market, money market, forex market and credit market – experienced the knock-on effects of the global financial crisis. The equity markets and forex markets came under pressure because of the reversal of capital flows as part of the global deleveraging process. With the reversal of capital flows and drying up of external sources of funds, corporates shifted to domestic bank credit. This substitution of overseas financing by domestic financing brought both money markets and credit markets under pressure. The global liquidity spiral increased volatility in the financial markets, and restoring orderly conditions in the financial markets became critical to contain the spread of contagion to other sectors of the economy (Chakrabarty, 2009). In response to the crisis, the Reserve Bank and the Government reacted swiftly and took both conventional and unconventional measures aimed at stabilising various market segments. Broadly, these measures included reduction in liquidity adjustment facility (LAF) interest rates, infusion of large amounts of forex and domestic liquidity, lending to non-bank financial institutions through the banking channel, encouraging the inflow of foreign capital through increasing interest rate ceilings on NRI deposits, and easing norms pertaining to external commercial borrowing (ECBs). In this section, the impact of the crisis on various financial market segments in India and policy responses to contain the damage and restore normalcy have been analysed. Foreign Exchange Market 5.18 Prior to the 1990s, the Indian foreign exchange market was highly regulated with restrictions on transactions, participants and use of instruments. The period since the early 1990s has witnessed a wide range of regulatory and institutional reforms resulting in substantial development of the rupee exchange market as it is observed today. Market participants have become sophisticated and acquired reasonable expertise in using various instruments and managing risks. The foreign exchange market in India today is equipped with several derivative instruments. These derivative instruments have been cautiously introduced as part of the reforms process in a phased manner, both for product diversity and, more importantly, as a risk management tool. As a result, trading volumes in the Indian foreign exchange market have grown significantly over the past few years. The daily average turnover has seen an almost ten-fold rise during the 10-year period from 1997-98 to 2007-08, from US$ 5 billion to US$ 48 billion. The pick-up has been particularly sharp from 2003-04 onwards, when there was a massive surge in capital inflows. Reflecting these trends, the share of India in global foreign exchange market turnover trebled from 0.3 per cent in April 2004 to 0.9 per cent in April 2007. 5.19 With the increasing global integration, efficiency in the foreign exchange market has improved as evident from the low bid-ask spreads. It was found that the spread is almost flat and very low. In India, the normal spot market quote has a spread of 0.25 paisa to 1 paise while swap quotes are available at a 1 to 2 paise spread. Thus, the foreign exchange market has evolved over time as a deep, liquid and efficient market as against a highly regulated market prior to the 1990s. 5.20 In recent years, external sector developments in India have been marked by strong capital flows, which had led to an appreciating tendency in the exchange rate of the Indian rupee up to 2007-08. The Indian approach has been guided by the broad principles of careful monitoring and management of exchange rates with flexibility, without a fixed target or a pre-announced target or a band, coupled with the ability to intervene if and when necessary, while allowing the underlying demand and supply conditions to determine the exchange rate movements over a period in an orderly way. Subject to this predominant objective, the exchange rate policy is guided by the need to reduce excess volatility, prevent the emergence of speculative activities, help maintain an adequate level of reserves, and develop an orderly foreign exchange market. This approach has served well in maintaining orderly market conditions. 5.21 There was a sudden change in the external environment following the Lehman Brothers’ failure in mid-September 2008. The global financial crisis and deleveraging led to reversal and/ or modulation of capital flows, particularly foreign institutional investor flows, ECBs and trade credit (Gopinath, 2009). Large withdrawals of funds from the equity markets by the foreign institutional investors (FIIs) reflecting the credit squeeze and global deleveraging resulted in large capital outflows during September-October 2008, with concomitant pressures in the foreign exchange market across the globe including India (Chart V.4). 5.22 The cascading effect of the global financial crisis on the domestic foreign exchange market was felt through the dollar liquidity shocks emanating from the lower level of net capital flow and contracting exports. The impact of these factors has resulted in a significant fall in turnover in the foreign exchange market since October 2008. This decline was spread across the merchant and inter bank segments of the forex market. The pressure on the foreign exchange market was also visible in the falling share of the spot market in the total turnover (Table 5.2). At the same time, the share of the forward and swap markets in total turnover increased, possibly reflecting the rising tendency of hedging the underlying exposure in the foreign exchange market, which could have been driven by high volatility and uncer tainty prevailing in the international financial markets.
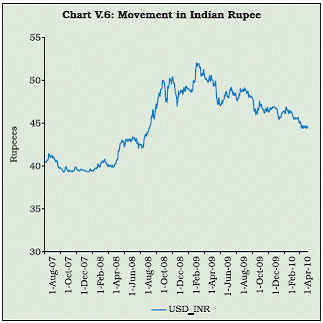
5.23 After Lehman’s bankruptcy, the rupee depreciated sharply, breaching the level of Rs.50 per US dollar on October 27, 2008. The Reserve Bank scaled up its intervention operations during the month of October 2008. Despite significant easing of crude oil prices and inflationary pressures in the second half of the year, declining exports and continued capital outflows led by global deleveraging process and the sustained strength of the US dollar against other major currencies continued to exert downward pressure on the rupee. With the spot exchange rates moving in a wide range, the volatility of the exchange rates increased during this period (Table 5.3). However, with the return of some stability in international financial markets and the relatively better growth performance of the Indian economy, there has been a revival in foreign investment flows, especially FII investments since the beginning of 2009-10. As compared with depreciation of 21.5 per cent during 2008-09, the rupee appreciated by around 13 per cent in 2009-10. During the current year so far upto June 11, 2010, the rupee depreciated by 3.6 per cent against US dollar over end-March 2010. Though there has been some recovery in the forex turnover during 2009-10, it has not yet picked up to the pre-crisis levels.
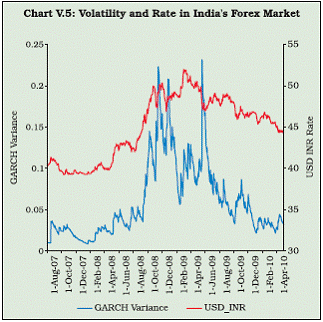
5.24 The volatility in exchange rate, measured in terms of the difference between high and low remained elevated since July 2008 but subsided somewhat from the beginning of 2009-10. Further, the volatility of the rupee-US dollar returns estimated using a GARCH (1,1) process1 distinctly indicates two different phases in the forex volatility in the Indian market. In the first phase (during August 2007 to September 2008) the volatility was low compared with the volatility witnessed during September 2008 to December 2008 (Chart V.5). 5.25 With a view to maintaining orderly conditions in the foreign exchange market, the Reserve Bank announced in mid-September 2008 that it would continue to sell foreign exchange (US dollar) through agent banks to augment supply in the domestic foreign exchange market or intervene directly to meet any demand-supply gaps. Despite the intervention by the Reserve Bank, the rupee depreciated in October, 2008 (Chart V.6). 5.26 Several measures were undertaken by the Reserve Bank to ease the forex liquidity situation. A rupee-dollar swap facility for Indian banks was introduced with effect from November 7, 2008 to give the Indian banks comfort in managing their short-term foreign funding requirements. For funding the swaps, banks were also allowed to borrow under the LAF for the corresponding tenor at the prevailing repo rate. The forex swap facility, which was originally available till June 30, 2009, was extended up to March 31, 2010; however, this was discontinued in October 2009. The Reserve Bank also continued with Special Market Operations (SMO) which were instituted in June 2008 to meet the forex requirements of public sector oil marketing companies (OMCs), taking into account the then prevailing extraordinary situation in the money and foreign exchange markets; these operations were largely (Rupee) liquidity neutral. Finally, measures to ease forex liquidity also included those aimed at encouraging capital inflows, such as an upward adjustment of the interest rate ceiling on foreign currency deposits by non-resident Indians, substantially relaxing the ECB regime for corporates, and allowing non-banking financial companies and housing finance companies to access foreign borrowing (Box V.2).
Box V.2
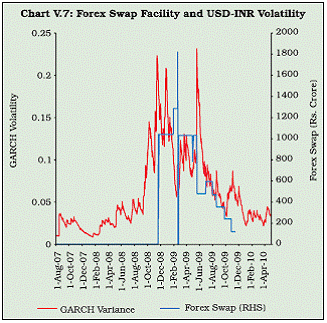
5.27 In the Indian context, even though the utilisation of the forex swap facility was limited, the feedback from market participants and anecdotal evidence suggest that the facility had achieved the desired objective in providing comfort and confidence to the banks at a time when international money markets were frozen. An exercise was undertaken to test the effectiveness of the forex swap facility. The results do not indicate any significant relation between the differenced USDINR series and the forex-swap amounts (low R-2 and insignificant coefficients)2. However, in the case of volatility, the dummy variable has a negative coefficient and the forex swap has a positive sign indicating (a) the decline in volatility after the introduction of forex swap and (b) the use of the swap window by banks during high volatility periods. In due course, the outstanding under the forex swap facility, declined to Rs. 240 crore at end- September 2009 from its peak of Rs.1,820 crore on February 19, 2009, indicating considerable improvement of forex liquidity conditions for Indian banks (Chart V.7). Taking into account the prevailing forex liquidity conditions, the forex swap facility was discontinued by the Reserve Bank from October 27, 2009. 5.28 In sum, with the help of the Reserve Bank’s actions in the foreign exchange market, the pressure eased since December 2008 as liquidity conditions in the foreign exchange market returned to normalcy. The rupee generally appreciated against the US dollar during 2009-10 on the back of significant turnaround in FII inflows, continued inflows under FDI and NRI deposits, better-thanexpected macroeconomic performance in 2009-10 and weakening of the US dollar in the international markets. The volatility in the foreign exchange market declined after the introduction of the forex swap facility. Additionally, the outcome of the general elections, which generated expectations of political stability, buoyed market sentiment and contributed towards the strengthening of the rupee, especially from the second half of May 2009.
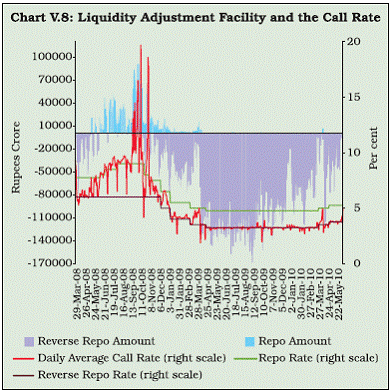
Money Market 5.29 Since the early 1990s, the Indian money market has undergone a significant transformation in terms of instruments, participants and technological infrastructure. Various reform measures have resulted in a relatively deep, liquid and vibrant money market. Along with the shifts in the operating procedures of monetary policy, the liquidity management operations of the Reserve Bank have also been fine-tuned to enhance the effectiveness of monetary policy signalling. Various segments of the money market have been developed in line with shifts in policy emphasis. The call money market was transformed into a pure inter-bank market, while other money market instruments, such as market repo and collateralised borrowing and lending obligation (CBLO), were developed to provide avenues to non-banks for managing their short-term liquidity mismatches. Policy initiatives by the Reserve Bank in terms of widening of market-based instruments and shortening of maturities of various instruments have not only helped in promoting market integration but also enabled better liquidity management and transmission of policy signals by the Reserve Bank. Following the recommendations of the Technical Group on Money Market (2005), the Reserve Bank’s focus on the money market has been on encouraging the growth of the collateralised market, developing a rupee yield curve and providing avenues for better risk management by market participants. 5.30 The money market was orderly during the first half of 2008-09, with call rates remaining generally within the informal corridor of reverse repo and repo rates (Chart V.8). The call money rates edged up in tandem with the hikes in LAF repo rates in stages till August 2008, reflecting monetary policy tightening on inflation concerns and hovered around the upper bound of the corridor during the second quarter (up to mid- September 2008). In mid-September 2008, the failure of Lehman Brothers and a few other global financial institutions led to the freezing of money market activities in major financial centres; and Indian markets were also indirectly affected. In response to the crisis, the Reserve Bank provided substantial dollar liquidity to curb excessive volatility in the foreign exchange market, which had a tightening impact on rupee liquidity. Such operations by the Reserve Bank in the foreign exchange market along with transient local factors such as build-up in government balances following quarterly advance tax payments adversely impacted domestic liquidity conditions and the call money rate moved above the repo rate till the end of October 2008.
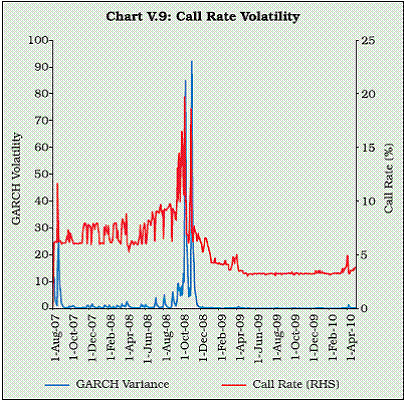
5.31 With the increasing uncertainty in global markets, the volatility in the call market also increased significantly during mid-September 2008. The volatility estimated by the GARCH(1,1) model indicates large increase in volatility in interbank rates during the second half of 2008-09 (Chart V.9). The apparent break in volatility was confirmed by the sign and statistical significance of the dummy variable of the augmented GARCH volatility equation.3 However, it may be mentioned that some of the increase in this volatility could be due to domestic factors (e.g., quarterly advance tax outflow from the banking system and festive season currency demand during October - November) (Chart V.9).
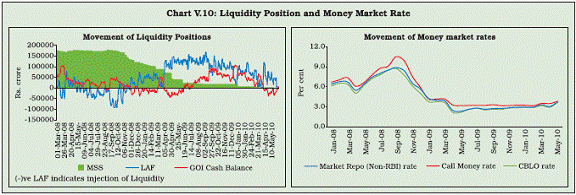
5.32 With receding inflationary pressures and accentuating global crisis, the Reserve Bank swiftly and comprehensively switched to an expansionary regime from mid-October 2008 and announced a series of measures including a cumulative 400 basis points cut in CRR, a 100 basis point cut in statutory liquidity ratio (SLR) and 425 basis points (and 275 basis points) cuts in the repo (and reverse repo) rates, respectively, to augment domestic liquidity. Following the reversal of capital flows and increase in the liquidity needs of the economy, the Reserve Bank also started unwinding of the outstanding market stabilisation scheme (MSS) balances, resulting in a steady release of liquidity. After September 2008, the issue of Treasury Bills under the MSS was suspended. With effect from November 2008, the Reserve Bank also started buyback of dated securities earlier issued under MSS to augment its efforts to hasten the pace of liquidity creation. The buyback was conducted through auctions and largely dovetailed with the normal market borrowing programme of the central government. 5.33 The measures initiated by the Reserve Bank augmented liquidity, and the weighted average call money rate declined and mostly remained within the LAF corridor from November 3, 2008 onwards. Moreover, volumes in the money market have also grown from January 2009 (Table 5.4), which suggests that there has not been any adverse perception of counterparty risk; consequently, the interbank money market functioned normally in India, in contrast to those of certain advanced economies. The average daily net outstanding liquidity injection under LAF, which had increased to around Rs.43,000-46,000 crore during September and October 2008, also declined sharply thereafter and turned into net absorption from early December 2008, reflecting the impact of these measures. 5.34 Liquidity conditions eased even further during 2009-10, mainly on account of a decline in central government cash balances, MSS unwinding and auction-based purchases under open market operation (OMO) (discussed later in the chapter)4. Following the easing of liquidity conditions and the reduction in policy rates, the call money rates declined further and hovered around the lower bound of the LAF corridor during 2009-10. 5.35 Collateralised segments now dominate activity in the money market with a share of over 75 per cent of money market operations. The CBLO and market repo volumes also picked up substantially in the last quarter of 2008-09, largely reflecting the easing of liquidity conditions and enhanced lending capacity of mutual funds. The money market rates, which started hardening from January 2008 and peaked in September 2008, have been on the downward trajectory since October 2008 reflecting various liquidity-inducing measures undertaken by the Reserve Bank (Chart V.10). Further, with the significant easing of liquidity conditions, the rate in the collateralised segments generally remained below the lower bound of the LAF corridor during 2009-10.
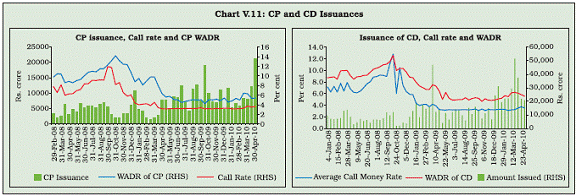
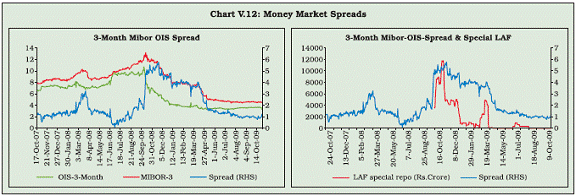
5.36 The indirect impact of the crisis also got reflected in the Certificate of Deposits (CDs) and Commercial Paper (CP) markets. In both the markets, the outstanding amounts declined and the weighted average discount rate (WADR) rose during September-October 2008. A few cases of default by issuers (in meeting the redemptions) were also reported by Issuing and Paying Agents (IPAs) in the CP market. Subsequently, the liquidity conditions eased and the outstanding amount of CP and CDs picked up (Chart V.11). The WADR in the CP and CD markets have generally declined till December 2009 in line with the other money market rates. Term Repo Facility 5.37 Dwindling foreign funding and the slump in the domestic capital market exacerbated pressures on some segments of the Indian financial system, such as mutual funds and NBFCs. Facing large redemption pressures, the mutual funds started conserving their liquidity which, in turn, affected other sections of the market, particularly NBFCs that had been dependent on mutual funds for their funding needs. The Reserve Bank, acting swiftly, introduced a term repo facility (a 14-day special repo facility for a notified amount of Rs.20,000 crore) with effect from October 15, 2008 to address such liquidity shortages. Banks were allowed temporary use of SLR securities for collateral purposes by an additional 0.5 per cent of net demand and time liabilities (NDTL). Subsequently, this facility was expanded to enable banks to meet the funding needs of NBFCs and housing finance companies (HFCs). At the same time, the notified amount was increased to Rs.60,000 crore and the relaxation in the maintenance of the SLR was enhanced up to 1.5 per cent of their NDTL from November 2008. In view of its effectiveness, the term lending facility was further extended up to March 31, 2010. A special refinance facility was also introduced on November 1, 2008 to provide funding to SCBs up to 1 per cent of their NDTL at the repo rate to enable banks to meet the liquidity demands. (Also see Section III of this chapter). 5.38 An exercise was undertaken to empirically evaluate the effect of term repo on funding liquidity stress in the Indian financial market during the crisis period. Following, Frank and Hesse (2009) study, 3-month MIBOR-OIS spread was calculated to provide a proxy for the liquidity stress in the Indian markets. The MIBOR-OIS spread increased considerably from end-September 2008 (Chart V.12), which could indicate hoarding of funding in order to cover further contingent liabilities following asset price declines, subsequent marking-to-market of securities and forced liquidations. However, following the introduction of the term repo facility, the MIBOR-OIS spread declined gradually, indicating the easing of financial stress in the financial markets. It may be mentioned that the amount under term repo facility was higher during the periods of high spread, and gradually declined with time in line with the declining spread.
5.39 The effectiveness of the term repo facility on the MIBOR /OIS volatility was empirically investigated using the MIBOR / OIS volatility (standard deviation of a 5-day moving window) as the dependent variable and dummy variable for term repo (which took value 1 post-October 14, 2008, otherwise 0) and term repo amounts as independent variables. The lagged value of the dependent variable (i.e. volatility) was also included as independent variable. In both regressions, the dummy variables had negative sign and the coefficients of dummy variables were significant at conventional levels5. The negative sign of the dummy variables (for term repo facility) indicated that the term repo facility was effective in containing liquidity stress in the Indian economy during the crisis period. Taking into account the prevailing liquidity conditions and declining spreads, the term repo facility was discontinued by the Reserve Bank from October 27, 2009. Liquidity Injection and the Reserve Bank’s Balance Sheet 5.40 With large capital outflows during the third quarter of 2008, the net foreign exchange assets (NFA) came under pressure. The Reserve Bank responded by injecting liquidity in the system through conventional OMO, provision of liquidity through repos and term repos under LAF, unwinding of MSS balances and CRR reduction. The unwinding of MSS balances not only created scope for adequate liquidity expansion by the Reserve Bank without expanding its balance sheet in any significant measure, but the timing of the unwinding could also be modulated in such a way that the large borrowing programme of the government was managed smoothly without exerting undue market stress. 5.41 Thus, the Reserve Bank addressed the financial stress faced by non-banks/banks indirectly through the banking channel and without compromising either the eligible counterparties or the asset quality of its balance sheet, which was in contrast to the approach adopted by the central banks of some of the advanced countries. By synchronising the liquidity management operations with those of exchange rate management and nondisruptive internal debt management operations, the Reserve Bank of India ensured that appropriate liquidity was maintained in the system, consistent with the objective of price and financial stability (Mohanty, 2009). The cumulative impact of the various liquidity measures put in place since mid- September 2008 augmented actual/potential liquidity in the system on the aggregate by Rs.5,61,000 crore up to September 2009. (Also see section on Policy Responses towards the end of this chapter). The term repo facility was effective in containing the liquidity stress in the Indian economy during the crisis period.
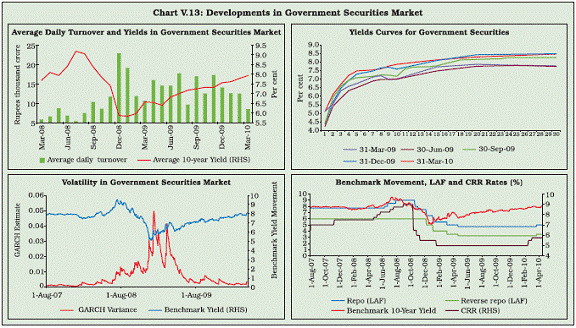
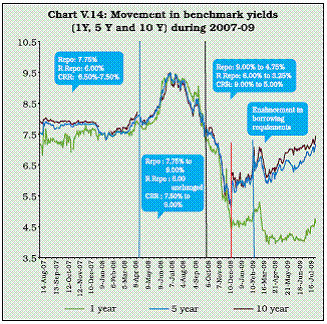
Government Securities Market 5.42 The government securities market in India has evolved over the years. Recognising the need for a well-developed government securities market, the Reserve Bank, in coordination with the government, initiated a series of measures from the early 1990s to deregulate the market of administered price and quantity controls. Consequently, the government securities market has witnessed significant transformation in various dimensions, viz., market-based price discovery, widening of the investor base, the introduction of new instruments, establishment of primary dealers, and implementation of an electronic trading and settlement infrastructure. The switchover to an auction-based system of issuance of government securities in the early 1990s was a major step. This, in turn, led to consistent increases in the size of the market in tandem with the growth in market borrowings of both the central and state governments. 5.43 The operationalisation of the Clearing Corporation of India Ltd. (CCIL) has ensured guaranteed settlement of trades and has, therefore, imparted considerable stability to the government securities market. The operation of a system of market intermediaries in the form of primary dealers (PDs) has facilitated the Reserve Bank’s smooth withdrawal from the primary market from April 1, 2006 as provided in the Fiscal Responsibility and Budget Management (FRBM) Act. Reflecting the effectiveness of various measures initiated to develop the market, turnover in the secondary market has increased manifold over the years. 5.44 The impact of the global financial crisis led India to implement extraordinary measures, both on the fiscal and monetary fronts, to stimulate domestic demand. The fiscal consolidation norms set earlier under the Fiscal Responsibility and Budget Management (FRBM) Act have been justifiably suspended for the time being, with the assurance that the government will revert to it as early as feasible. As a result, there were sharp increases in both the borrowings of the central and state governments during 2008-09 over their respective budget estimates. 5.45 The primary market yields of Treasury Bills across all maturities hardened up to August 2008 and softened thereafter, reflecting the interest rate cycle coupled with improvement in liquidity conditions from October 2008. During March 2009, however, the yields hardened from their levels in January and February 2009 due to increased market borrowings by both the central and the state governments and quarterly advance tax outflows. (Chart V.13). 5.46 The movement in the 10-year yield since April 2008 can be categorised into three broad phases (Chart V.14). During the first phase, i.e., April to mid-July 2008, the 10-year yield hardened on heightened inflationary expectations and reached a high of 9.51 per cent on July 15, 2008. During the second phase (mid-July to end- December 2008), the 10-year yield generally eased, following the reduction in inflationary pressures in tandem with the softening of crude oil prices, easing of domestic liquidity conditions and decline in domestic policy rates in response to the indirect impact of the global financial turmoil (from mid-September 2008) and monetary policy easing in the US (Table 5.5). During the third phase (since January 2009), the 10-year yield generally hardened (barring some brief interludes in February and April), notwithstanding the continued prevalence of easy liquidity conditions and further reduction in the domestic policy rates in January 2009 and March 2009. This was largely on account of the worsening of market sentiments following the upsurge in the government’s market borrowing programme for 2008-09 as well as the large market borrowing requirement of the government for 2009-10.
5.47 Like forex and money markets, the volatility of the 10-year benchmark G-sec movement increased from September 2008 (see Chart V.14). The change in the volatility has been found to be statistically significant at conventional levels. Market borrowings of the Government of India increased sharply during the last quarter of 2008- 09 to finance the additional expenditure by way of two supplementary demands for grants to support various stimulus packages. For more effective liquidity management and to ensure that the market borrowing programme of the government was conducted in a non-disruptive manner, the scope of the open market operations (OMO) was widened with effect from February 19, 2009 by including purchases of government securities through an auction-based mechanism in addition to purchases through the Negotiated Dealing System – Order Matching (NDS-OM) segment. The Reserve Bank, as against its intention to purchase government securities amounting to Rs.80,000 crore under the OMO programme for the first half of 2009-10, purchased securities amounting to Rs.57,487 crore up to end-September 2009, through the auction route. Furthermore, the Memorandum of Understanding (MoU) on the MSS was amended on February 26, 2009 to permit the transfer of the sequestered liquidity from the MSS cash account to the normal cash account of the government. 5.48 In sum, the Reserve Bank successfully managed the government market borrowing programme during the crisis year, 2008-09, and 2009-10, without creating any disruptive pressures on the government securities market. The Reserve Bank employed a combination of measures involving monetary easing and the use of innovative debt management tools such as synchronising the Market Stabilisation Scheme (MSS) buyback auctions and open market purchases with the government’s normal market borrowings and desequestering of MSS balances. By appropriately timing the release of liquidity to the financial system to coincide with the auctions of government securities, the Reserve Bank ensured a relatively smooth conduct of the government’s market borrowing programme, resulting in a decline in the cost of borrowings during 2008-09 for the first time in the past five years. Reflecting the continued need for fiscal stimulus in 2009-10 which led to large borrowing requirements, the Reserve Bank continued with an active debt management strategy so as to mitigate pressures on interest rates and avert possible crowding out of private sector demand for credit. Capital Markets and Asset Prices 5.49 The Indian equity market has witnessed a significant improvement since the reform process began in the early 1990s. The equity market in India is now comparable with international markets. The changes in regulatory and governance framework have increased investors confidence. There has been a visible improvement in trading and settlement infrastructure, risk management systems and levels of transparency. These improvements have reduced transaction costs and led to improvements in depth and liquidity 5.50 Before the onset of the sub-prime crisis in the US in August 2007, capital markets across advanced and emerging market economies had witnessed a strong rally. The mounting losses of large financial institutions on account of the subprime crisis, however, intercepted the rally and capital markets started sliding in most of the advanced economies. Confidence in many large financial institutions was severely shattered by the sub-prime mortgage losses and the share prices of these institutions, especially investment banks, crumbled drastically from the later part of 2007. Subsequently, capital markets of emerging market economies also started decelerating, primarily on account of large pullouts by foreign institutional investors (FIIs). 5.51 Although Indian banks/ financial institutions had no significant exposure to the US sub-prime market, Indian capital markets caught the global downswings in January 2008, largely driven by selling pressures by FIIs. Besides pullouts by FIIs, turmoil in international financial markets also weakened domestic sentiments and amplified the downturn in Indian capital markets. Major events involving losses of mortgage companies and international commercial/ investments banks continued to spike the stress in capital markets across advanced and emerging market economies during 2008-09. Indian stock markets also responded to these major global events, reflecting the increased financial integration of the Indian economy. Primary Markets 5.52 The primary segment of the capital market, which remained buoyant in the years before the recent crisis, subdued significantly during 2008-09 (Table 5.6). The slump in the primary market during the second half of 2008-09 was driven by heightened volatility and uncertainty in the financial markets, slowdown in growth and incumbent demand for investment and dampened sentiment due to depressed secondary markets. 5.53 The number of initial public offerings (IPOs) in the private sector plummeted significantly during the second half of 2008-09. Similarly, resources mobilised through ADRs/GDRs declined sharply in the second half of 2008-09. The private placements market that had been a major alternative source of funding for Indian corporates in the recent past also contracted in 2008-09. The primary market activities, however, revived since June 2009 and picked up sharply during the last quarter of 2009- 10 as indicated by IPOs. Secondary markets 5.54 The global crisis had a pronounced effect on financial markets in general and stock markets in particular through a rapid decline in stock prices and the market capitalisation of listed companies, leading to adverse consequences of the wealth effect on macroeconomic aggregates. Over the past two decades, stock markets had witnessed rapid growth due to globalisation, reform and advancement in information technology. The bulk of this expansion came from EMEs in the Asia- Pacific region and, as a result, market capitalisation of stock exchanges as a percentage to GDP in the low- and middle-income countries had almost converged with high-income countries during recent periods (Table 5.7). This rapid expansion of market capitalisation also provided adequate lubricant to the finance channels to transmit shocks across the equity markets, with stock markets emerging as key channels during the financial crisis. 5.55 The market capitalisation of stock exchanges in regions such as East Asia, including China, and South Asia, including India, which experienced high economic growth during 2003- 2007, surpassed the high-income OECD countries. With the global crisis, the market capitalisation of stock exchanges in East Asia and the Pacific region in 2008 fell by more than 50 per cent, comparable to the position one and a half decades ago (Table 5.8). Further, the decline was comparable to the OECD countries, which underlines the importance of global integration in transmitting shocks across the markets. 5.56 The reversal of private capital flows to emerging and developing economies was the major factor that contributed to the decline of stock markets in the EMEs. According to the IMF, private capital flows to emerging and developing economies declined by 81 per cent in 2008 from the peak in 2007. Though direct investment flows showed stability, there was a sharp decline in other private capital flows comprising portfolio flows, external debt and official assistance. 5.57 The mounting losses of large financial institutions on account of spiralling default in mortgage loans and deteriorating valuations of mortgage-backed and other securities since August 2007 triggered deleveraging by these institutions based in the US and other advanced economies. With increasing deleveraging along with weakening of earnings prospects on the back of the intensifying economic slowdown, the stock markets began decelerating from January 2008 in advanced and emerging market economies. The failure of Lehman Brothers in September 2008, however, led to a sharp jump in counterparty risk that was reflected in a steep rise in spread on credit default swaps (CDS) and, eventually, amplified the pace of decline in stock markets across countries. During the recent crisis, stock market crashes were widespread despite varying macroeconomic fundamentals across countries. Global Synchronisation 5.58 Indian stock markets also responded, taking their cue from markets in advanced economies, the epicentre of the current global crisis, and started decelerating from their peak on January 8, 2008 (the BSE Sensex was at 20,873), despite relatively robust macroeconomic fundamentals. In fact, of late, the movements in Indian stock markets have been highly synchronised with advanced and emerging market economies. The inter-temporal cyclical synchronisation of Indian stock markets has been estimated with select advanced and emerging market economies and it has gone up significantly with all these countries, barring Japan, during recent periods (Table 5.9). This increasing cyclical synchronisation of Indian stock markets reflects the increasing financial globalisation of the Indian economy over the past few years, which has been largely propelled by large inflows by foreign institutional investors (FIIs). 5.59 Foreign investors, through their buying and selling activities across countries guided by portfolio diversification objectives, contribute to price comovement and integration among regional and global stock markets (Dhal, 2009). From this perspective, it is important to analyse the impact of global stock markets on the national stock markets. An empirical analysis confirmed that the regional stock markets in Asia including India, Hong Kong, and Singapore and global markets such as the US, UK, and Japan shared a single long-run cointegrating relationship in terms of stock price indices measured in US dollars rather than the local currencies (Table 5.10). The Indian market held the key to this integration process. This was evident from the analysis that, excluding India, the other five stock markets did not show a co-integrating relationship. The coefficients of the long-run co-integration vector showed that the impact of the global markets on the Indian stock market was more pronounced than the impact of the regional markets. In terms of forecast error variance decomposition, global and regional markets together accounted for the bulk of variation in the Indian stock market. Global Developments and Equity Prices 5.60 Foreign institutional investors (FIIs) started withdrawing from Indian stock markets from January 2008 as manifested by their larger net negative investments reflecting global deleveraging. The selling pressure by FIIs in Indian stock markets accentuated during October 2008, following heightened turmoil in international financial markets fuelled by Lehman Brothers’ bankruptcy, and stock markets plummeted to a large extent. The Indian stock markets appear to have reacted to all major global events during the current crisis (Box V.3). 5.61 Along with large pullouts by FIIs as part of the deleveraging process and lowering of sentiments due to adverse events in international financial markets, the other impacts on the Indian economy were in the form of collapsing exports, tightening financial conditions and elevated uncertainty in the backdrop of the accentuated economic slowdown unleashed by the global crisis since October 2008. The dampening of the earning prospects of Indian corporates on the back of the real sector effects since the beginning of the third quarter of 2008-09 amplified the setback faced by the Indian stock markets. All these factors affected the confidence of domestic retail and institutional investors, and stock markets witnessed a continuous slide until March 2009 (Table 5.11). Box V.3 The current global crisis, which originated with the eruption of the sub-prime crisis in the US in August 2007, deepened with the unfolding of various events connected with financial markets. Some of these events and the response of Indian stock markets are discussed below.
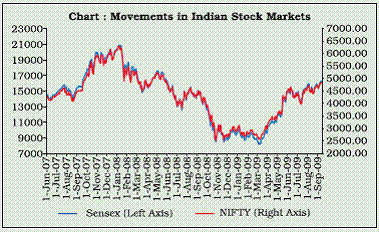
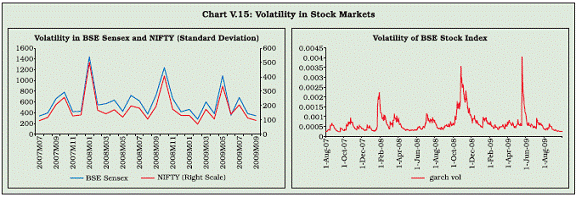
5.62 The BSE Sensex dipped by about 38 per cent to 12,860 at end-September 2008 from a peak of 20,873 on January 8, 2008, reflecting the initial impact of the crisis. Subsequently, it declined further by about 37 per cent to a new low of 8,160 on March 3, 2009 from the end-September 2008 level. The decline in the BSE Sensex from the peak to the new low was to the extent of 61 per cent. The volatility in Indian stock markets has also increased in sync with global stock markets since the beginning of 2008. The volatility measured in terms of the standard deviation of daily stock market indices (BSE Sensex and Nifty) shot up sharply in January 2008, October 2008, and May 2009, reflecting global events and domestic developments (Table 5.9). This was also confirmed when volatility was measured by GARCH (1,1) (Chart V.15). 5.63 The sharp fall in the stock markets was also visible in the major indicators. The P/E ratio and price-book value ratio of both the BSE Sensex and Nifty declined significantly during 2008-09 (Table 5.12). The market capitalisation of both the markets, which made rapid strides during the past 2-3 years, also slumped drastically by almost half during 2008-09 over the preceding year. 5.64 During 2009-10, volatilities in the stock markets declined and asset prices recovered from their previous lows across countries. In Indian markets also, FIIs returned with net purchases and retail investors and mutual funds also made a swift reversal with a buying spree from March 2009. The price-earnings and price-book value ratios of both stock markets also surged significantly at the end of March 2010 from end-March 2009, on the back of fast recovery. Similarly, the stock market’s capitalisation bounced back and, as the percentage of GDP, reached over 100 per cent at end-March 2010, which is almost the level achieved in end-March 2008. The recovery in the Indian stock markets could be attributed to a number of factors such as reduction in policy rates, the positive results of corporates and banks during 2009-10, political stability after the general elections, and stabilisation of the global economy.
Drivers of Stock Markets 5.65 In the long run, information tends to be symmetric and, hence, stock market movements are anchored to economic fundamentals. Besides the nature of available information, at times herd behaviour among investors spurred by domestic or global factors outplays the fundamentals and dictates movements in the stock markets in the short run. Similarly, other factors such as enabling liquidity, capital flows, and governance greatly influence the course of movements in stock markets. Illustratively, before the recent crisis economies across the world witnessed easing liquidity on account of accommodative monetary policy and large capital flows, and stock markets made rapid strides in advanced and emerging market economies (EMEs). As discussed above, the stock markets have become highly synchronised across countries over the past few years with increasing cross-border capitals flows, especially for FIIs. During the recent crisis also, deleveraging by FIIs along with other factors such as the economic downturn, declining exports, exposure to troubled financial institutions and toxic assets appear to have triggered a significant downturn in stock markets. 5.66 In India too, though foreign direct investment showed stability, the decline of portfolio flows played a crucial role in the decline of stock prices. An empirical analysis within the framework of the VAR model showed that FII flows were Granger-caused by developments in the real economic activity abroad measured by US industrial production growth and the differential between domestic interest rates (call money rate) and foreign interest rates (3-month LIBOR rate) (Table 5.13). The differential interest rates reflect the arbitrage opportunity. Further, a bivariate VAR model revealed that there was a significant Granger causal relationship from FII flows to the Indian stock market. The feedback causality from the BSE index to FII flows was also significant, albeit at a 10 per cent level of significance. The variation in FII flows could explain about 35 per cent of the variation in the Indian stock market. 5.67 Another exercise was undertaken to find the drivers of Indian stock markets. In this regard, a general vector autoregression (VAR) framework with monthly data from 2001 to 2009 was estimated with BSE Sensex (BSES), net FII investment (NFIIs), net investment by mutual funds (NMF), money supply (M3) and index of industrial production (IIP). The Cholesky variance decomposition suggests that, in the first period, net investment by FIIs explains about 4 per cent variation in BSES, which increases to about 35 per cent by the end of the 12th period, but descends slowly afterwards. On the other hand, variation in the BSES caused by net investments by mutual funds, IIP and money supply also rises over time and reaches 4 per cent, 6 per cent and 5 per cent, respectively, by the end of the 12th period. 5.68 The Granger Causality estimation between BSES and NFIIs, NMF, IIP and M3 in the VAR framework also suggests unidirectional causality running from NFIIs and M3 to BSES, and BSES to NMF and IIP. This shows that FII investment and money supply do exert significant influence on the movements of stock markets in India; while the relationship is the other way round in the case of investments by mutual funds wherein stock markets cause their variations. On the basis of the above empirics, it can be inferred that FIIs have been driving a large part of the swings in Indian stock markets. Asset Prices and Real Activity 5.69 Asset prices could affect private consumption demand through three key channels. First, according to the life-cycle hypothesis, as consumption is a function of agents’ lifetime resources, changes in the prices of financial (e.g., stock prices) and non-financial (e.g., housing prices) assets can significantly affect consumption. Second, real asset prices also signal expected future income growth. Given that consumption in a period would be affected by agents’ expectations about their future income, changes in asset prices may influence current consumption. Third, the availability and cost of external finance to households may depend on the assessment of the lender about their net worth. Since household net worth may undergo changes due to changes in asset prices, fluctuations in expected income may have a significant impact on consumption. 5.70 The impact of asset prices on investment may take place through three channels. First, a decline in asset prices can increase the cost of new capital relative to the existing capital. Second, as asset prices are assumed to contain information about future growth prospects, changes in asset prices would impact current investment activity (Mullins and Wadhwani, 1989). Third, through the credit channel, fluctuations in the net worth of a firm (originating from stock price shocks) impact the financing premium for the firm. Falling asset prices would lead to deterioration in the balance sheets of firms and banks and, hence, lower the lending and raise the cost of capital. 5.71 One of the key elements of the asset price channel that has gained importance is capital flows, which affects the demand for assets and then asset prices. There could also be spillover effects to other segments of markets, such as the housing market. Large capital inflows may engender high liquidity growth in the economy, which in turn can raise asset prices. Capital inflows can also lead to a sharp rise in asset prices by feeding into the investment and real activity in the economy, which in turn reduces risk perception. An adverse external shock in the form of adverse news or reversal of financial flows affects domestic asset prices in several ways. Given the greater integration of financial markets relative to the goods market, an adverse shock to equity prices in major markets could be swiftly transmitted. 5.72 The macroeconomic impact of the declining stock market was evident in various ways. In India, the share of household savings in equities to their total savings declined. Declining household savings in equities coupled with the decline of portfolio flows and stock prices adversely affected the new issues of capital raised by private companies. Accordingly, the share of new capital issues in gross domestic capital formation fell in 2008-09. 5.73 Understanding the impact of the stock market on real activity in India is important to gauge the impact of global financial shocks on the domestic economy as equity prices affect the domestic economy through both the wealth effect and corporate balance sheets. Using monthly data over April 1994 to July 2009, it was found that the real return on stocks and the growth of industrial production shared a unidirectional causal relationship due to the former significantly Grangercausing the latter (Table 5.14). This causal relationship was derived from the impact of real stock return on industries such as basic goods, capital goods and intermediate goods. These results reflect the role of stock markets in terms of wealth effect on investment activities and thus, the output growth of capital intensive industries such as capital goods and intermediate goods. 5.74 In sum, Indian capital markets were also affected by the current global crisis from January 2008 largely on account of selling pressures by FIIs, besides weakened domestic sentiments on account of turmoil in international financial markets. Indian stock markets responded to the major global events during the crisis period, reflecting the increased financial integration of the Indian economy. The steep decline witnessed from January 2008 to September 2008 was reinforced in the period after Lehman Brothers failed and stock markets reached a new low in March 2009. The deleveraging by FIIs, along with other factors such as the economic downturn, declining exports and weakened sentiments, has driven the significant downturn in stock markets during the current crisis. Declining asset prices also affected real activities such as consumption and investments. The empirical results suggest that FIIs have been driving the Indian stock markets to a large extent. III. BANKING SECTOR, MUTUAL FUNDS AND NON-BANKING FINANCIAL COMPANIES 5.75 The banking sector in India, as in most of the emerging market economies (EMEs), displayed resilience during the current global financial meltdown. The strength and resilience in the balance sheets of Indian banks was derived from them being well-capitalised and having greater exposure to domestic conventional assets, unlike advanced countries where the banking sector had extensive exposure to sub-prime mortgage markets (particularly, in the US) and other exotic structured products. Furthermore, the banking sector in India, unlike advanced countries, is dominated by commercial banking and not investment banking. 5.76 The direct effects of the global financial crisis on the Indian banking and financial system were almost negligible due to the limited exposure to riskier assets and derivatives and the relatively low presence of foreign banks (Thorat, 2009). Prima facie, Indian banks faced the stress because foreign investors pulled out of the economy and created a liquidity crunch. There was suddenly less money available to borrow or lend. The tightened global liquidity situation in the period immediately following the failure of Lehman Brothers in mid- September 2008, coming as it did on top of a turn in the credit cycle, increased the risk aversion of the financial system and made banks cautious about lending (Subbarao, 2009). At the same time, corporates and retail investors exerted redemption pressures on mutual funds, some of which got transmitted to NBFCs due to their dependence for funds on mutual funds. Thus, despite not being getting a hit on the balance sheets, banks and other financial institutions were impacted by the indirect spillovers of the crisis during 2008-09. 5.77 The capital to risk-weighted assets of Indian banks stood higher than many of the advanced and emerging market economies indicating that Indian banks were comparatively better positioned in terms of capitalisation compared to their peers across countries. All commercial banks met the minimum capital adequacy norm of 9 per cent as at end-March 2009. Similarly, Indian banks were saddled with lower non-performing loans (NPLs) vis-à-vis banks in many EMEs and advanced countries in 2008. The rate of return on assets of Indian banks, however, was on the low side compared to banks in most of the EMEs, but higher than those in advanced countries. The proportion of time deposits to total deposits improved during 2008-09 across bank groups, indicating the improved confidence of the public in banks despite the intensified turmoil in international financial markets. The share of liquid assets held by banks in their portfolios, however, declined marginally during 2008-09, except for large banks, for which it remained almost at the previous year’s level (Table 5.15).
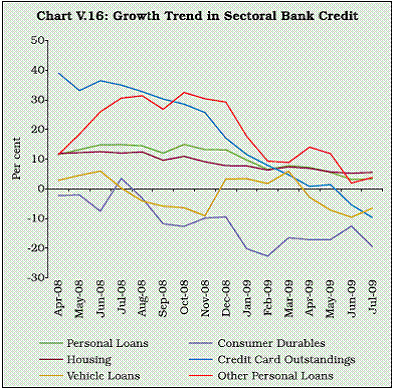
5.78 In terms of size distribution, large banks maintained a much smaller spread than their counterparts in other groups and hence, despite recording much higher interest earnings, received much lower returns on their loan portfolio during 2008-09. Notably, banks across the size-groups were able to realise higher interest rate spreads during 2008-09 compared to 2007-08, possibly on account of deposit rates easing at a faster pace than the rates on loans and advances. The surge in interest spread during the crisis period reflected the augmented confidence of the public in banks on the back of heightened volatility and uncertainty in financial markets. As a safety measure against the erosion of quality assets, all banks made higher provisions (as per cent to total loans); however, provisioning made by small-size banks were the highest during 2008-09. Scheduled commercial banks, as a precautionary measure, cut their operations in off-balance sheet items substantially in 2008-09 over the previous year, marking an exception to the prevailing upward trend. 5.79 The deposit growth of commercial banks decelerated marginally during 2008-09 compared to the previous year; on the other hand, growth in bank credit decelerated at a faster rate than deposits during 2008-09 (Table 5.16). In terms of size, the slowdown in deposit growth was greater in the case of medium and small banks during 2008-09. A similar pattern was reflected in the credit contraction being more pronounced for medium and small banks. The broad pattern of the maturity structure of banking assets/ liabilities suggests a shift from short-term maturity (up to one-year) to medium-term maturity (1-3 years and 3-5 years). 5.80 The growth in borrowings by commercial banks declined sharply during 2008-09, manifesting the liquidity pressures in the financial markets and lower credit off-take. The steep fall in the incremental credit-deposit ratio, emanating from lower credit off-take on the back of the economic slowdown, relieved commercial banks from the pressure for resource mobilisation through borrowings. Investments growth also decelerated marginally during 2008-09. However, prevailing uncertainties induced a degree of risk-averse behaviour; commercial banks parked a higher share of their available resources in terms of net demand and time liabilities (NDTL) in statutory liquidity ratio (SLR) securities. 5.81 The income growth rate in 2008-09 was much lower than that in 2007-08. However, such deceleration in income growth was somewhat offset by a decline in expenditure growth in 2008-09. The reduction in both income and expenditure growth was partly explained by the decline in overall interest rates during the latter half of the year. 5.82 To analyse the direct impact of the slowdowm on credit deceleration and other banking indicators, banks were classified into four different credit growth classes (Table 5.17). The banks which recorded negative deposit growth and a resource squeeze during 2008-09 witnessed a significant fall in their credit growth. Indeed, these banks had higher non-performing loans as well. Interestingly, these banks had a significantly lower proportion of time deposits in their deposit portfolio. The financial crisis, thus, seems to have had a greater adverse impact on banks that had fewer core deposits. During the time of distress, the stable deposit buffer played an important role in withstanding the liquidity squeeze. Banks with a significant decline in credit growth in 2008-09 witnessed a steep fall in their off-balance sheet exposure. In contrast, banks witnessing high credit growth (of over 20 per cent) expanded their off-balance sheet exposure even further during the economic slowdown. Higher credit growth was also backed by higher equity growth and provided a capital buffer in the wake of increased default risk from credit extension. Sectoral Credit Growth 5.83 The impact of liquidity easing and prudential measures is reflected in lower credit growth for the year ended June 2009. Though there was a slowdown in credit off-take from October 2008, the credit growth during the period October 2008 to June 2009 clocked an annualised growth rate of 8.9 per cent. Credit growth during during this period was higher for sectors such as infrastructure, real estate, NBFCs, SMEs, and agriculture and certain industries like iron and steel. The credit to medium and large companies declined more sharply than to small industries. However, the personal loan category was more adversely affected than other loans (Chart V.16 and Table 5.18).
Pro-cyclical behaviour of banks 5.84 It is argued in the recent literature that Basel II may contribute to pro-cyclical behaviour by banks. Pro-cyclicality is defined as easy credit in good times and tighter credit in bad times when borrowers need credit the most. In particular, this could happen with the internal rating based (IRB) approach where credit risk is a function of debtor’s income, which presumably moves with the business cycle. Pro-cyclical behaviour existed in banks prior to Basel II, but there is a concern that this behaviour will be more dramatic under Basel II. In particular, the financial crisis has generalised the concern about the pro-cyclicality embedded in the financial system and, more specifically, in institutional and regulatory aspects such as accounting rules, trading and risk-management rules, and bank capital requirements. All recent reviews of the challenges for the immediate reform of financial regulation stress the need to make the financial system less procyclical (Brunnermeier et al., 2009; FSF, 2009; Repullo and Suarez, 2009) (Chart V.17).
5.85 The impact of the crisis on India, as on many EMEs, spilled over from the real sector to the financial sector. Industry and businesses, especially the small and medium enterprise (SME) sector, had to grapple with a host of problems, such as delays in payment of bills from overseas buyers as also domestic buyers affected by the global slowdown; increase in stocks of finished goods; fall in the value of inventories, especially raw material which, in many cases, were acquired at higher prices such as metal and crude oil-based products; slowing of capacity expansion due to a fall in investment demand; and demand compression for employment-intensive industries, such as gems and jewellery, construction and allied activities, textiles, auto and auto components and other export-oriented industries. Hotels and airlines, apart from IT, also witnessed a fall in demand due to the global downturn. Major economic activities such as growth in the index of industrial production (IIP) turned negative and continued at sub-zero levels for more than two quarters in 2008-09, exports continued to contract in the second half, and capital market activities dwindled significantly. The slowdown in all the economic activities spilled over to the financial market and bank credit growth fell sharply. During the slowdown, when it was even more necessary to maintain credit flow to productive sectors, credit was hard to come by. Therefore, the pro-cyclical behaviour by banks became more evident during the crisis.
5.86 Recognising that the unexpected and swift turn of events could lead to a spiralling downturn, the Reserve Bank took a series of regulatory measures in addition to providing liquidity and special refinance (Box V.4 and see next section on Policy Responses). Since 2005-06, in the context of high growth in bank credit to certain sectors, the Reserve Bank had raised in stages the risk weights and provisioning requirements for standard assets for these sectors. In November 2008, as a countercyclical measure, the additional risk weights and provisions were withdrawn and restored to their previous levels. 5.87 The prudential regulations for restructured accounts were modified, as a one-time measure and for a limited period in view of the extraordinary external factors, to preserve the economic and productive value of assets which were otherwise viable. The modified regulations were in operation for applications for re-structuring received up to March 31, 2009 and restructured packages implemented within 120 days of receipt of application or by June 30, 2009, whichever was earlier. Banks were, therefore, required to take swift action for detecting weaknesses and putting in place the re-structured packages in order to avail of the benefits in asset classification under the modified prudential regulations (Box V.4). 5.88 The role of banks in the financial system in solving asymmetric information problems in credit markets laid the foundation of the credit channel of monetary policy. As money supply goes up, bank deposits and reserves increase, which in turn increases the quantity of bank loans. On the other hand, a contraction in deposit resources affects aggregate demand by shifting the supply schedule to the left in the bank loan market. In this context, Kashyap and Stein (2000) showed that with crosssectional differences in bank-lending response to policy shocks, the impact of monetary policy on lending behaviour is stronger for banks with less liquid balance sheets (Box V.5). Box V.5 In order to examine cross-sectional differences of banklending response to policy shocks, the Kashyap and Stein (2000) model is followed6. The model explicitly assumes a homogeneous reaction of the loan demand which is crucial for the identification of monetary policy effects on loan supply. Until recently, bank loans were the main source of finance in India, even for large firms, and thus the assumption seems reasonable. In order to allow for asymmetric responses of bank loans to changes in economic activity and in the inflation rate, interaction terms with individual bank characteristics are also included in the model. Besides, the use of first differences presumably ensures the stationarity of the variables. The asymmetric effects of monetary policy are captured by significant coefficients for the interaction terms. Because of its cross-sectional nature, the model can exploit both aspects of the data. With respect to time, the interaction effect captures the degree to which lending is liquidity-constrained during the periods of tight or loose money. On the other hand, one can look at the sensitivity of lending volume to monetary policy for a particular bank in the sense that this sensitivity is greater for banks with weaker balance sheets, which is captured by both liquidity and size. The structure of the model with a lagged dependent variable in (1) clearly demands an estimation procedure suitable for dynamic panel data. In this connection, the standard procedure in the literature during the last decade or so has been the GMM technique due to Arelleno and Bond (1991) and the same has been used here. A similar approach was followed by Pandit et al.(2006). The dataset consists of a balanced panel of a total of 1314 balance sheets (observations) spread over 18 months from January 1998 to June 2009 of all scheduled commercial banks, excluding regional rural banks (RRBs). These data are collected from the statutory returns, called Section 42(2) returns, designed to estimate reserve requirements and submitted to the Reserve Bank of India by every bank on a fortnightly basis7. Besides deposit resources, the returns report a wealth of information on most of the balance sheet indicators including cash, interbank transactions, investments, and domestic lending classified by various categories. The results8 show that the direct impact of changes on the repo rate is negative and significant when size as well as liquidity are considered as balance sheet strength. Prima facie, there is clear evidence that policy rate changes have a direct impact with a lag of at least one month on bank loans and, therefore, at least for the average bank, we may not reject the hypothesis that the bank lending channel of monetary policy transmission works well through repo rate change. The coefficient of economic activity is positive, as expected, while the coefficient for inflation is negative. Both coefficients are significant. The impact of liquidity is positive and significant, implying that banks with more liquid assets also lend more. Furthermore, the interaction coefficient of repo with liquidity also turned out to be significant and negative. That is, the impact of monetary policy on lending behaviour is stronger for banks with less liquid balance sheets. In the absence of any substitute for deposit resources, more liquid banks could relatively easily protect their loan portfolios by simply drawing down on their large buffer stock of securities. On the other hand, less liquid banks cut loans significantly in response to a contractionary monetary policy. Following Kashyap and Stein (1995), the relative hypothesis that was also tested. In other words, the effect of bank size on transmission of monetary policy was tested to ascertain whether the lending of large banks is less sensitive to monetary shocks than those of small banks. One expects that large banks have easier access to alternative finance, which would make their lending less dependent on monetary policy changes. Accordingly, the interaction effect is found to be negative and significant, suggesting that small banks do tend to feel the pressure of increased policy rates and respond by reducing their loan disbursement. Industrial Activity Effect on Bank Lending 5.89 In order to examine the impact of the economic slowdown and the interaction of liquidity on bank credit, a panel vector auto-regression (PVAR) approach was attempted. At the bank level, the variables considered were loans, deposits and liquidity (as defined earlier) and for macroeconomic and monetary developments IIP, inflation and CRR were used9. The dataset consists of a balanced panel of a total of 1314 balance sheets (observations) spread over 18 months from January 1998 to June 2009 of all scheduled commercial banks, excluding regional rural banks (RRBs). Estimated parameters10 based on the short-run equation show that decline in IIP is significantly associated with fall in credit demand. While higher inflation leads to an increase in loan demand, increase in CRR is associated with contraction in loan supply. Interest Rate Movement 5.90 The reduction in the Reserve Bank’s policy rates and the easy liquidity conditions were expected to moderate interest rates. Irrespective of ownership, Indian commercial banks have reduced their deposit and lending rates. The decline in lending rates, however, comes with a lag due to the old contractual structure of assets and liabilities. The interest rates offered by public sector banks on deposits of all maturities showed moderate easing after October 2008. Further, a decline could be seen in the deposit rates of all maturities of private sector banks and foreign banks after December 2008. The benchmark prime lending rate (BPLR) of public sector and private sector banks too showed a decline from October 2008. However, the BPLR of foreign banks showed considerable rigidity. Further, actual lending rates on non-export credit and terms loans above Rs.2 lakh eased for public sector banks, but in the case of private sector banks and foreign banks, the rates somewhat firmed up between September 2008 and December 2008, notwithstanding the fall in policy rates and inflation, and declined between December 2008 and June 2009. Initial estimates based on the data submitted by selected banks indicate that Indian banks maintained a steady spread of more than 4 per cent during the preand post-crisis periods (Chart V.18). 5.91 During the first quarter of 2009-10, the decline in deposit rates was greater than that in lending rates. Thus, the lower cost of deposits was not fully passed on to borrowers and banks continued to enjoy a higher spread, manifesting a higher allocative inefficiency even during a soft interest regime.
Mutual Funds 5.92 Some segments of the financial system, particularly non-banking entities came under severe liquidity pressures due to reduced foreign funding and the lacklustre domestic capital market. The capital flow reversals and drying up of funding from external markets for banks and corporates also created liquidity pressure on mutual funds during 2008-09. A substantial proportion of collections of mutual funds reflected bulk funds from the corporate sector under money market schemes, partly reflecting tax and other regulatory arbitrage. In the wake of credit tightening, corporates which had been parking funds substantially with mutual funds withdrew their investments from mutual funds to supplement their resources for investments. The stock market reversals exerted redemption pressure on mutual funds from retail investors too. With increasing redemption pressure from all sides and heightened uncertainty rendering it difficult for mutual funds to mobilise resources from alternate sources, the mutual funds were compelled to sell off their positions in the stock markets. While the mutual funds promised immediate redemption, their assets were relatively illiquid. Maturity mismatches between the assets and liabilities of mutual funds further aggravated the problems. 5.93 The growth of gross mobilisation by mutual funds fell sharply during 2008-09. The net mobilisation of resources by mutual funds in India declined by 118 per cent in 2008-09 as against an increase of 64 per cent in the previous year. It may be noted that the steep fall in stock prices and net resources mobilised by mutual funds have been intertwined since January 2008, reflecting the redemption pressures on mutual funds (Chart V.19 and Table 5.19). The assets held by mutual funds at the end of March 2009 declined by 17 per cent over the end of March 2008 due to large redemptions and negative valuations stemming from substantial corrections in equity prices.
5.94 The liquidity stress emanating from the stock market reversals and heightened uncertainty varied across the categories of mutual funds. Private sector mutual funds, followed by UTI, were affected the most. The net resources mobilised by private sector mutual funds turned hugely negative during 2008-09 as a result of the steep rise in redemptions by both retail and corporate investors. On the other hand, public sector mutual funds were able to withstand the redemption pressure and mobilised fresh resources during 2008-09 which continued in 2009-10 (Table 5.20).
5.95 The Reserve Bank responded swiftly to address the liquidity stress faced by the mutual funds. A term repo facility for an amount of Rs.60,000 crore under the LAF was introduced to enable banks to ease the liquidity stress faced by mutual funds, NBFCs and housing finance companies (HFCs), with an associated SLR exemption of 1.5 per cent of NDTL. Further, the policy measures initiated by the Reserve Bank and other central banks across countries have enabled the restoration of stability conditions in domestic and international financial markets and the revival of stock markets since the beginning of 2009-10. The revival in the stock markets and ample liquidity in the system buoyed sentiments and provided support to the activities of mutual funds during 2009-10. Impact on Non-Banking Finance Companies (NBFCs) 5.96 The drying up of liquidity with mutual funds, which have perennially provided resources to other sectors including NBFCs, coupled with tightening foreign funding and domestic liquidity enforced further pressure for funds availability to NBFCs. The total assets of NBFCs (excluding RNBCs) increased marginally during 2008-09 compared to a substantial rise during 2007-08 (Table 5.21). The growth in the borrowing portfolio of NBFCs, which is their major source of financing, witnessed steep deceleration. The resource mobilisation through public deposits by NBFCs declined at a higher pace during 2008-09 than in the previous year. At the same time, the Reserve Bank tightened the regulatory and soundness norms for NBFCs in order to safeguard financial stability and the interests of depositors. 5.97 On the liabilities side also, the business activities of NBFCs decelerated sharply during 2008-09. The loans & advances extended by them grew at a considerably lower rate in 2008-09 than in 2007-08, reflecting the drying up of resources from various sources due to the global financial crisis. The increase in investments made by NBFCs also fell substantially during 2008-09 compared to the previous year. The liquidity crunch forced NBFCs to cut their exposure to other assets such as hire purchase assets, equipment leasing, and the bill business. The dampening real activities led to a rise in the default of repayments, especially in the case of hire purchase assets and, hence, gross non-performing assets as a percentage of gross advances of NBFCs, which was on a descending trajectory from 2001, increased in 2009 (Table 5.22). 5.98 In view of the funding inter-linkages between NBFCs, mutual funds and commercial banks, when the contagion from the global financial crisis created selling pressures in the stock markets in India, the liquidity needs of the financial system as a whole had to be addressed by the Reserve Bank (Chakrabarty, 2009). The Reserve Bank announced a series of measures to provide respite to the financially stressed NBFCs during 2008-09 (Box V.6). In the case of NBFCs, in view of their need to raise capital, they were allowed to issue perpetual debt instruments qualifying for capital. They were also allowed further time of one year to comply with the increased Capital to Risk-Weighted Asset Ratio (CRAR) stipulation of 15 per cent as against the existing requirement of 12 per cent. Risk weight on banks’ exposures to NBFCs, which had been increased earlier, was brought down. NBFCs also benefited from the refinance facility provided to the Small Industries Development Bank of India (SIDBI) by the Reserve Bank to ease the liquidity constraint.
5.99 In sum, the financial performance of NBFCs deteriorated during 2008-09 compared with the previous year on account of exacerbated liquidity stress that eventually subdued fund based activities (Table 5.23). The growth in the fund-based income of NBFCs decelerated sharply, while the deceleration in the growth of fee-based income was moderate during 2008-09. At the same time, growth in expenditure incurred by NBFCs also decelerated during 2008-09, but the rate of deceleration was not as steep as that in income. The escalated cost-to-income ratio of NBFCs during 2008-09 over the preceding year also reflected the sharp deceleration in the growth of income. Box V.6
Financial Stress 5.100 As discussed earlier in this section, EMEs felt stress in their financial markets, especially equity, foreign exchange, and sovereign debt markets in the last quarter of 2008. Exchange rates came under severe pressure, leading to depreciation and depletion of foreign exchange reserves, while equity markets witnessed a large exodus of equity and debt funds, triggering sharp downward movements in stock prices from September 2008. There was a strong link between financial stress in advanced and emerging economies, with crises tending to occur at the same time on both sides (World Economic Outlook, IMF, April 2009). 5.101 In fact, the transmission of stress tends to be stronger and more direct in an economy that is financially well-linked to advanced economies. Sometimes, common global factors spill over rapidly across economies which are financially integrated, and financial stress moves in tandem among them. The common factors could be, inter alia, global shocks such as heightened risk aversion, a shift in market sentiments and the failure of large financial institutions that have a presence across the countries. The role of such common factors has increasingly become discernible in most of the EMEs, including India, over the past several years as these economies became increasingly integrated. Accordingly, financial stress travelled to Indian financial markets almost contemporaneously from advanced economies, especially from the third quarter of 2008-09. 5.102 Against the above background, an attempt has been made to quantify and analyse the evolving financial stress in India. Financial stress may be defined as the uncertainty and changing expectations of loss in financial markets. Financial stress for an economy may be felt in different sectors simultaneously. There are many indicators for different sectors of the economy which exhibit the occurrence in that particular sector (Table 5.24). Financial Stress Indicator (FSI) combines these different indicators into a unified indicator and provides a measure of the current degree of stress in the financial system. 5.103 The FSI increased significantly in the third quarter of 2008-09 as manifested in the steep rise in the FSI during September and October 2008. In fact, the FSI for India witnessed an upward movement from August 2007, following the unravelling of the sub-prime crisis, and peaked in October 2008, reflecting the deepening turmoil in international financial markets subsequent to the failure of Lehman Brothers in September 2008. But swift and calibrated policy measures, both monetary and fiscal, have eased the financial stress in Indian financial markets since November 2008 and since then the FSI has been on a downward trajectory (Chart V.20). 5.104 It has been observed that all major advanced economies simultaneously experienced a sudden rise in financial stress in the month of August 2008 which continued till November 2008 and receded thereafter. The FSI for India exhibited synchronised movements with that of the US, Western Europe, Japan and aggregate advanced economies (Figures V.20 & V.21). This either shows that financial stress in India and other advanced countries is driven by a common factor or that transmission of stress to Indian markets from advanced markets is contemporaneous.
5.105 To sum up, this section analysed the impact of the global financial crisis on Indian financial institutions, such as banks, mutual funds and nonbanking financial companies. As their international exposures in complex financial products was very limited, the Indian banking sector did not feel the heat in the first round. However, with the financial crisis deepening and beginning to spread across countries, especially after the fall of Lehman Brothers in September 2008, Indian financial institutions along with several other EMEs started to face the challenges of the recent financial crisis in a manner that was somewhat different from their counterparts in advanced economies. The knockon effects of the global financial crisis were felt first through the equity markets, which eventually spread to other segments of the financial market, viz., the money market and the foreign exchange market. The tightening of liquidity conditions in the domestic market and drying of resources available from international markets along with capital flow reversals imposed new challenges for financial institutions in financing the productive needs of the economy. As the impact of the crisis through the trade channel threatened to jeopardise the Indian growth story, the Reserve Bank initiated a spate of liquidity-easing and confidence-building measures to ensure that banks and mutual funds got ample resources to be able to meet the demand for credit from Indian corporates. In contrast to the loss of confidence that the banking system in advanced economies faced, Indian banking system continued to command the confidence of the public as was evident in the continued deposit growth.
5.106 The analysis of the balance sheets of the scheduled commercial banks amply illustrates how Indian banks made adjustments to take up the emerging challenges in their business operations. The behaviour of large banks stood distinctly different from those of medium and small banks. The Indian banking sector also displayed maturity in going slow with their off-balance sheet activities. The policy measures were able to contain the spread of the liquidity problems to other segments of the financial system and restore normalcy at a fast pace. The financial stress index, when analysed in the Indian case, demonstrates a steep rise in September and October 2008 and displays synchronised movements with those of the US, Western Europe, Japan and aggregate advanced economies. This underscores the high interconnectedness of financial systems globally and almost instantaneous spread of stress conditions across nations. This could be the biggest challenge to the decoupling theory. IV. POLICY RESPONSES 5.107 Before the intensification of the global financial meltdown from September 2008, both monetary and fiscal policy measures in India were guided by an overriding intention to contain spiralling inflationary expectations that were largely driven by international commodity prices. Monetary policy was striving to dampen demand-side pressures through monetary tightening. At the same time, fiscal policy was attempting to ease supply-side constraints with a slew of measures, such as slashing excise duties and custom duties and encouraging imports of necessary goods, among others. 5.108 India’s policy response to the crisis was aimed at containing the contagion from the outside – to keep the domestic money and credit markets functioning normally and see that the liquidity stress did not trigger solvency cascades. In particular, three objectives were pursued with respect to the financial sector: first, to maintain a comfortable rupee liquidity position; second, to augment foreign exchange liquidity; and third, to maintain a policy framework that would keep credit delivery on track so as to arrest the moderation in growth. Besides challenges thrown by the global financial meltdown, the policy responses also involved the challenge of balancing short-term mitigation and medium-term sustainability (the tyranny of the short-term!). This section delineates various policy responses undertaken in India against the backdrop of the global financial crisis. The measures to meet the above objectives came in several policy packages from the Government of India and the Reserve Bank of India starting in mid-September 2008. These measures were, on some occasions, in response to unanticipated global developments and, at other times, in anticipation of the impact of potential global developments on the Indian markets. Fiscal Policy Response 5.109 The unprecedented global developments in the second half of 2008-09 forced the government to adopt an expansionary fiscal stance to cushion the economy from the effects of the global crisis. This shift in the fiscal policy stance was in line with the international trend to minimise the adverse effects of the global crisis and also consistent with mainstream views that in situations of deep and prolonged economic downturn, as in the present context, fiscal policy could play a leading role in stabilisation. Although financial markets in India experienced heightened volatilities in sync with international developments generating collateral damages, the banking system remained strong and well-capitalised. The stress tests conducted on Indian banks suggest that it can withstand significant shocks arising from large potential changes in credit quality, interest rate and liquidity conditions. Therefore, the fiscal policy in India did not have to extend support to the banking sector in the form of capitalisation/ financial bailout, which was rampant in most advanced economies. Thus, the fiscal response has been highly weighted towards containing the economic slowdown by raising aggregate demand through discretionary fiscal policy. The depth and extraordinary impact of this crisis, however, clearly indicated the need for counter-cyclical public spending and, accordingly, the central government invoked the emergency provisions of the FRBM Act to seek relaxation from fiscal targets and launched fiscal stimulus packages in December 2008 and January 2009 (Subbarao, 2009). 5.110 The fiscal policy measures undertaken in the form of three fiscal stimulus packages during the second half of 2008-09 constituted tax cuts, encouraging investment on infrastructure and increased expenditure on both investment and consumption, with the latter accounting for the major share. The expansionary fiscal stance continued in the Union Budget for 2009-10, which was presented against the backdrop of moderation of growth in the economy and signs of stabilisation in the global economy. The allocation for crucial sectors such as infrastructure, education and health, rural employment and empowerment of disadvantaged sections of the population was enhanced significantly during the Union Budget 2009-10. Indeed, the Union Budget for 2009-10 went a step further and proposed to address important challenges in the short and medium term, viz., revive the economy to attain a growth of 9.0 per cent per annum at the earliest; deepen and broaden the agenda for inclusive development; reenergise the government; and improve delivery mechanisms. Notably, the fiscal policy for 2009-10 also reiterated the importance of reverting to the path of fiscal consolidation at the earliest and as soon as the negative effects of the global crisis on the Indian economy have been overcome. In order to attain medium-term sustainability, the fiscal policy also recognised the importance of institutional reforms encompassing all aspects of the Budget such as subsidies, taxes, expenditure and disinvestment. 5.111 Additional expenditure amounting to 3.0 per cent of GDP was provided through three supplementary demands for grants during October- December 2008 and February 2009. Of the expenditure measures, revenue expenditure constituted around 84 per cent and the remainder accounted for the capital component (RBI Annual Report, 2008-09). On the whole, the fiscal stimulus measures appear to have given more emphasis to support consumption demand rather than investment demand. The fiscal deficit increased to 6.0 per cent of GDP in 2008-09 from 2.7 per cent of GDP in 2007-08 (Box V.7). 5.112 It may be mentioned that the cyclical downturn, which was already underway, was reinforced by the unfolding of the recent global crisis, especially during the second half of 2008- 09, with the effect of subdued financial intermediation and a sharp fall in consumer and business confidence. Therefore, the role of fiscal policy in the current context may be different from previous episodes of normal business downturns. Thus, the efficacy of the counter-cyclical fiscal policy in containing the slowdown and reviving the economy during 2008-09 and 2009-10 needs to be judged differently than normal cyclical downturns in the past in India. During normal economic situations or economic cycles in a country like India, the fiscal policy response to boost growth may endanger the sustainability of the fiscal deficit and become detrimental to growth in the medium to long run. It was observed that growth based on a large fiscal deficit during the 1980s led to the unsustainable twin deficits in India. 5.113 Given that the recent slowdown was characterised by a sharp fall in private sector demand due to loss of confidence as well as a slowdown in exports, it was expected that the rise in government expenditure could provide the required temporary fillip to the falling aggregate demand. Monetary policy was accomodetive; when combined with the increased appetite for government securities by financial institutions, it was felt that interest rates may not increase substantially. Therefore, discretionary fiscal stimulus was supposed to have different implications from those in the past. 5.114 Fiscal policy in India appears to have attained the desired objective of constraining the slowdown in the economy to a large extent during 2008-09. The contribution of government consumption to the incremental GDP at market prices made a large jump from about 8 per cent in the first half to 80 per cent during the second half of 2008-09 (Chart V.21). This large increase in government consumption, coupled with additional expenditure especially on infrastructure undertaken by the government, possibly revived the green shoots in the economy and growth rebounded since the beginning of 2009-10 (see Chapter 6). From the above evidence it could be construed that, in the absence of fiscal stimulus, the slowdown in growth could have been much more severe during 2008-09. Exit Strategy 5.115 The fiscal stimulus measures have largely achieved the objective of containing the economic slowdown in the short-term as reflected by growth revival during 2009-10. Thus, fiscal policy, shifting the stance from containing slowdown to recovery management in order to revert back to high growth trajectory, announced a calibrated exit of expansionary stance in the Union Budget 2010-11 with partially rolling back of tax cuts and better expenditure management. The Budget 2010-11 has proposed to bring down revenue deficit (RD) and gross fiscal deficit (GFD) during 2010-11 to 4.0 per cent and 5.5 of GDP, respectively. The Medium Term Fiscal Policy Statement (MTFPS), laying down the fiscal consolidation path in terms of rolling targets, indicates that RD and GFD in 2012-13 will be brought down to 2.7 per cent and 4.1 per cent of GDP, respectively. The Government, accepting in principle the medium-term fiscal consolidation path recommended by Thirteenth Finance Commission (ThFC), has also indicated in the MTFPS to reduce the debt to GDP ratio to 48.2 per cent by 2012-13.
Box V.7 Union Budget : 2008-09 Tax cuts Excise
Service Tax
Customs
Expenditure
Industry
Infrastructure
State Governments
Other Measures
Union Budget: 2009-10 Tax Cuts Income
Excise
Customs
Expenditure
Monetary Policy Response 5.116 The monetary policy response was in terms of easing liquidity into the system through conventional measures such as cutting policy rates [cash reserve ratio (CRR), reverse repo, and statutory liquidity ratio (SLR)] and open market operations, and unconventional measures, viz., opening refinance facilities to SIDBI and EXIM Banks and clawing back prudential norms in regard to provisioning and risk weights. The total amount of actual/potential liquidity injected was Rs.5,85,000 crore (Table 5.25). 5.117 There are, however, some key differences between the actions taken by the Reserve Bank of India and the central banks in many advanced countries. First, in the process of liquidity injection the counterparties involved were banks; even liquidity measures for mutual funds, NBFCs and housing finance companies were largely channelled through the banks. Second, there was no dilution of collateral standards which were largely government securities, unlike the mortgage securities and commercial papers in the advanced economies. Third, despite a large liquidity injection, the Reserve Bank’s balance sheet did not show an unusual increase, unlike global trends, because of release of the earlier sterilised liquidity. Fourth, the availability and deployment of multiple instruments facilitated better sequencing of monetary and liquidity measures. Finally, the experience in the use of pro-cyclical provisioning norms and countercyclical regulations ahead of the global crisis helped enhance financial stability (Mohanty, 2009). 5.118 Wide-ranging initiatives were also taken in the areas of financial inclusion, employment generation in the rural and unorganised sectors, financial literacy and credit counselling. These include strengthening of rural co-operatives and regional rural banks which cater predominantly to the rural areas; liberalisation of the branch licensing policies of RRBs; encouraging multiple channels of lending such as self-help groups (SHGs), micro-finance institutions (MFIs) and adoption of the banking facilitator/banking correspondent (BC) model; simplification of the procedures and processes for lending to agriculture and micro, small and medium enterprises (MSME) sectors; and encouraging the adoption of ICT solutions to not only increase outreach but also to reduce transaction costs (Box V.8). Box V.8 Monetary Measures
Domestic Liquidity Measures
Exit
5.119 Taken together, the measures put in place by the Reserve Bank and the Government of India since mid-September 2008 have ensured that the Indian financial sector continued to function in an orderly manner. The cumulative amount of primary liquidity potentially available to the financial system through these measures was over US$ 122 billion12 or about 11 per cent of GDP13. This sizeable easing has ensured a comfortable liquidity position starting mid-November 2008 as evidenced by a number of indicators. 5.120 The monetary policy in India, like most other countries, had instituted both conventional measures and unconventional measures to be accommodative for containing the spillovers emanating from the recent global financial crisis. In the backdrop of firming up recovery and risk of rising food prices impinging on inflationary expectations, the monetary policy started its first phase of exiting its accommodative stance with reversing some of the unconventional measures during October 2009 (Box V.8). V. CONCLUDING OBSERVATIONS 5.121 In the recent period, the financial linkages have become stronger resulting in a higher degree of business cycle co-movement, which has also resulted in faster transmission of shocks across countries. In India, too, trade openness has increased along with the higher capital account openness, which was reflected in greater synchronisation of the domestic business cycles with advanced and emerging market economies. The elevated synchronisation was eventually reflected in larger transmission of global developments to the Indian economy. Further, among the trade and finance channels, the latter has been found to be more dominant in transmitting the effects of global developments to the Indian economy during the recent period. 5.122 The financial markets in India were the first to be impacted, mainly because of the reversal of capital flows as part of the global deleveraging process. The rupee-US dollar depreciated considerably in the second half of 2008-09 and turnover in the forex markets also declined sharply on the back of steep declines in merchandise exports and substantially modulated capital flows. The balance of payments came under pressure which led to a reserve drawdown. A number of measures were initiated to ease the foreign exchange supply situation, partly by assuring greater access to the Reserve Bank’s foreign reserves and partly by improving inflows in response to specific measures. Besides actual large-scale intervention sales in the foreign exchange market, the Reserve Bank also opened the forex swap facility for the banks. To ease the demand pressure from oil-importing companies during the high and rising phase of international prices, the Reserve Bank had already started special market operations in the secondary market through commercial banks, involving the direct supply of forex liquidity against the bonds of public sector oil marketing companies. The policy measures that aimed at improving the supply of forex liquidity included permitting banks to borrow from their overseas branches within prudential limits, further relaxing the external commercial borrowing policy, including allowing NBFCs and housing finance companies to borrow in foreign currency, and raising the interest rates on NRI deposits. Notwithstanding the demand pressure in the forex market, in view of depressed international asset prices, corporates were permitted to prematurely buy back their FCCBs at prevailing discounted rates. 5.123 The money market, which remained by and large orderly during the first half of 2008-09, came under liquidity pressure following the failure of Lehman Brothers and a few other global financial institutions, and volatility in the call market increased significantly. With increased volatility in the financial markets during the third quarter of 2008, the Reserve Bank had to ensure an adequate supply of rupee as well as foreign currency liquidity to restore the call money rate within the LAF corridor and also to contain volatility in the exchange rate. The Reserve Bank had to expand the net domestic assets (NDA) to compensate for the decline in reserve money due to the decline in net foreign assets so as to ensure the necessary growth in money supply consistent with the needs of economic growth, besides the provision of ample liquidity to alleviate any fears of liquidity shortage in the Indian markets. The Reserve Bank used all instruments like the LAF, OMO, CRR and MSS to augment liquidity in the system. While dealing with the challenge of expanding the NDA to offset the impact of contracting NFA on reserve money, the unwinding of MSS balances not only created the scope for adequate liquidity expansion by the Reserve Bank without expanding its balance sheet, but the timing of the unwinding could also be modulated in such a way that the large borrowing programme of the government was managed smoothly without exerting any market stress. The monetary operations of the Reserve Bank were significantly different from the experiences of many central banks of the advanced economies, even though the ultimate objective was almost the same, which was to ensure adequate liquidity in the banking system. Thus, the transmission of the Reserve Bank’s policies to the money, forex and government securities markets has been effective, thereby ensuring speedy restoration of orderly conditions over a short time span. 5.124 The credit market functioned normally in India as against almost defreezing of this market in many advanced countries. Given the overriding importance of containing the moderation in flow of credit to the private sector for sustaining the growth momentum, counter-cyclical prudential regulations were used to encourage banks to lend. The credit growth of the commercial banks, however, decelerated sharply during 2008-09, especially in the second half, on account of subdued economic activities and banks being extra cautious about viability. The banks, which recorded a negative deposit growth and resource squeeze during 2008-09, ended up witnessing a significant fall in credit growth. Interestingly, these banks had a significant lower proportion of time deposits in their deposit portfolio. 5.125 Like forex and money markets, the volatility of the 10-year benchmark G-sec movement increased from September 2008, reflecting general pressures in the financial markets and a sharp increase in the market borrowings of the Government of India during the last quarter of 2008-09. The global financial crisis also affected India through the asset price channel. Global financial and real shocks to domestic asset prices, particularly stock prices, led to erosion of household wealth and corporate balance sheets in terms of value of their collaterals. Both factors affected household consumption demand and corporate investment. Asset prices shocks also adversely affected exchange rate expectations which led to further uncertainty about external trade. The decline in stock market capitalisation following the financial crisis has been of almost comparable magnitude across OECD countries and EMEs, which underlines the increased severity of the global shocks. 5.126 The stock markets in India, responding to all major international events, started sliding from the peak in January 2008 and touched a new low in March 2009. The long-run co-integration vector showed that the impact of the global markets on Indian stocks was more pronounced than the impact of the regional markets. The global and regional markets together accounted for the bulk of the variation in the Indian stock market. A bi-variate VAR model for India indicates a significant causal relationship from the FII flows to the stock market. The feedback causality from the BSE index to FII flows was also significant, albeit less significant. 5.127 Although the banking sector in India was not directly affected by the crisis because of meagre exposure to sub-prime mortgages and to failed institutions, the liquidity stress in the money and forex markets eventually enhanced credit pressures on banks. Indian banks were also able to weather the slipovers of current global crisis due to their better financial health vis-à-vis their peers in EMEs and advanced countries. The macro-prudential dimension of systemic risk assessment has become particularly important in the context of the current global financial crisis. In India, elements of macroprudential regulation were visible even before the global crisis started, in terms of counter-cyclical use of risk-weights and provisioning norms. Macroprudential analysis could provide the early warnings for timely identification of systemic risks, while macro-prudential regulation could prevent the emergence of systemic risk in the financial system. The Reserve Bank is in the process of revising guidelines on stress testing and liquidity risk management, taking into account the new guidance issued by Basel Committee on Banking Supevision (BCBS). It is also considering laying down a risk management and capital adequacy framework for bank-sponsored private pools of capital (e.g., private equity funds/ venture capital funds), especially in view of the reputational risk arising from undertaking such activities. 5.128 The estimation of asymmetric effects of monetary policy shocks revealed that changes in policy rates as well as liquidity have a significant positive effect on bank lending and the impact of monetary policy on lending behaviour is stronger for banks with less liquid balance sheets. The falling stock prices and drying up of resources for corporates generated redemption pressure on mutual funds during the second half of 2008-09 and, at the same time, mutual funds were unable to raise funds from alternate sources. NBFCs and mutual funds, given the nature of their sources of funds, also faced a major liquidity shortage. The term-repo facility extended by the Reserve Bank to banks for onward lending to mutual funds, NBFCs and others and the recovery in the stock market at the beginning of 2009-10 provided a respite to these institutions. Indications are clearly visible that pressures on mutual funds have eased and that NBFCs too are making the necessary adjustments to balance their assets and liabilities. 5.129 In sum, all the constituents of the financial sector in India were affected directly or indirectly by the recent global crisis during 2008-09. This is also reflected in the financial stress, which increased significantly in the third quarter of 2008- 09 as manifested by the steep rise in the financial stress indicator (FSI). In fact, the FSI for India began rising from August 2007 and peaked in October 2008, reflecting the deepening turmoil in international financial markets subsequent to the failure of Lehman Brothers. The swift and calibrated monetary and fiscal policy measures have eased the financial stress in Indian financial markets greatly since November 2008 and, since then, the FSI has been on the downward trajectory. 1 The choice of the GARCH (1,1) model is based on its attribute of parsimony and its capacity to outperform most other models (White, 2000; Hansen, 2001). The details of the dummy variables and the specifications of the dummy variables are reported in the Annex. The coefficient of the dummy variable, introduced to verify the apparent break in the GARCH volatility equation, was found to be positive and statically significant at the 1 per cent level, confirming the validity of such a break.
3 The GARCH volatility equation (Equation 2) was augmented to include a dummy variable. The augmented set of information used for estimating GARCH volatility is as follows: where Rt is the dependent variable signifying the financial variable (e.g., weighted average call rate), ht is the conditional volatility of the weighted average call rate/spread augmented by Df - a dummy variable which takes the value 1 on a particular regime 0, otherwise. Df is created to capture the effect of changes in regimes. Three dummies were considered as Prelude (August 07-August 08), Problem (September 08- December 08) and Recovery (January 09 to October 09). The dummy variables, Problem and Recovery, are introduced in the variance equation to evaluate the regime shift. The estimated results using the augmented GARCH model are as under:
4 On review of the liquidity conditions, it was decided on May 5, 2009 that only one Liquidity Adjustment Facility (LAF) would be conducted daily with effect from May 6, 2009 (Wednesday) and that the second LAF would be conducted only on reporting Fridays. SLAF was reintroduced on a daily basis with effect from May 28, 2010 till July 2, 2010.
6 The regression model is specified as follows:
7 Till 1985, these data were reported on a weekly basis on Fridays and subsequently they are being reported fortnightly. However, banks file a special return in the same format on the last Friday of every month, if that is not a reporting Friday. Thus, comparability of data is maintained over monthly frequency also. 8 Parameter Estimates- Arelleno Bond Dynamic Panel Regression
9 All variables are in logarithm terms except CRR and inflation. Variables are in first difference. 10 Parameter estimates – Panel VAR are as under:
11 beta = cov(r,m)/var(m), calculated monthly over a rolling 1-year time horizon, where r = year-over-year percentage change in the Bank Total
price Index (e.g., BANKEX) and m = year-over-year percentage change in the general stock index (e.g., SENSEX). 12 The exchange rate used is the average exchange rate of Rs per US dollar for 2008-09. |
|||||||||||||||||||||||||||||||||||||||||||||||||||||||||||||||||||||||||||||||||||||||||||||||||||||||||||||||||||||||||||||||||||||||||||||||||||||||||||||||||||||||||||||||||||||||||||||||||||||||||||||||||||||||||||||||||||||||||||||||||||||||||||||||||||||||||||||||||||||||||||||||||||||||||||||||||||||||||||||||||||||||||||||||||||||||||||||||||||||||||||||||||||||||||||||||||||||||||||||||||||||||||||||||||||||||||||||||||||||||||||||||||||||||||||||||||||||||||||||||||||||||||||||||||||||||||||||||||||||||||||||||||||||||||||||||||||||||||||||||||||||||||||||||||||||||||||||||||||||||||||||||||||||||||||||||||||||||||||||||||||||||||||||||||||||||||||||||||||||||||||||||||||||||||||||||||||||||||||||||||||||||||||||||||||||||||||||||||||||||||||||||||||||||||||||||||||||||||||||||||||||||||||||||||||||||||||||||||||||||||||||||||||||||||||||||||||||||||||||||||||||||||||||||||||||||||||||||||||||||||||||||||||||||||||||||||||||||||||||||||||||||||||||||||||||||||||||||||||||||
పేజీ చివరిగా అప్డేట్ చేయబడిన తేదీ:


