6.1 Commercial banks undertake a wide variety of activities, which play a critical role in the economy of a country. They pool and absorb risks for depositors and provide a stable source of investment and working capital funds to various sectors of the economy. In addition, they provide a smooth functioning payment system that allows financial and real resources to flow relatively freely to their highest return uses. They are also a back up source of liquidity for any sector in the economy in temporar y difficulty. Banks are a particularly important source of funds for small borrowers who often have limited access to other sources of external finance. The three main interrelated functions of commercial banks are holding of deposits; creating credit through lending and investment activities; and providing a mechanism for payments and transfers of funds for various productive activities. The extension of credit or lending is, thus, the principal activity of a commercial bank.
6.2 From the early days of banking theory, the difference between deposits and lending was viewed as minimal, associated with cash balances required to satisfy uncertain cash flows and regulatory seigniorage extracted from the depository process by the central bank through required reserves held in fiat money or central bank balances (Meade, 1934). Not only is lending the primary source of banks’ income, but it provides financing for productive activity throughout the economy. Historically, understanding the role performed by the commercial banks in the economy has had its roots in macroeconomic theory. Keynes (1930) and Pesek and Saving (1967) argued that commercial banks are central to a macro economy as they act as financial intermediaries between savers and investors.
6.3 Banks in India have traditionally been the main source of credit for various sectors of the economy. They have also funded borrowing requirements of the Central and State Governments by investing in their securities. Lending and investment operations of banks in India have evolved in response to the changing needs of the economy. Prior to the initiation of financial sector reforms in the early 1990s, lending by banks was tightly regulated and banks were expected to align their lending operations to plan priorities. Bank lending was the principal focus of monetary policy under the credit planning approach adopted in 1967-68. However, in the wake of banking sector reforms, various restrictions on banks’ balance sheet were withdrawn and direct credit controls largely dismantled, though in a phased manner. Directed investments were also reduced to a significant extent. The system of administered lending rates was also dismantled and various other restrictions on banks’ lending were gradually removed in order to enable banks to operate in a flexible manner. This led to a structural transformation in the lending and investment operations of the banks. Keeping in view their impact on the overall macroeconomic performance of the country, this chapter details the lending and investment operations of banks in India, especially in the light of financial sector liberalisation measures spanning the last decade and a half.
6.4 The chapter is divided into ten sections. Section II begins with a brief review of literature on the theoretical underpinnings of lending operations of banks. It takes a broad overview of the portfolio behaviour of banks and the allocation of assets in terms of loans and investments. Section III focuses on the trends in overall credit of scheduled commercial banks in India. The major indicators of lending behaviour by banks, including the trends in the credit-deposit ratios of banks are analysed. Trends in agricultural lending by banks along with the various issues in lending to agriculture are set out in Section IV. The cross-country patterns in advances to agriculture are also traced in this section to have an insight as to how agricultural lending policies have evolved in different countries. Section V covers the trends in lending to industry with a special focus on lending to the small and medium enterprises (SMEs) sector. This section contains a cross-country analysis of lending to SMEs and explains as to how banks in some countries have overcome the constraints faced by them while lending to SMEs. Section VI analyses the trends in lending by banks to the infrastructure sector. The cross-country experiences in financing infrastructure by banks are also covered. In Section VII, rapid growth of retail loans and various issues concerning thereto are covered. Section VIII analyses the various aspects of investment behaviour of banks. Section IX, as a way forward, makes some suggestions for ensuring adequate and timely credit to various sectors of the economy. Section X sums up the main points of discussions.
II. LENDING OPERATIONS OF BANKS –THEORETICAL UNDERPINNINGS
6.5 The literature available on banking provides various theories which govern the lending operations of banks. These theories have evolved over time along with the evolution of commercial banks. However, most of these theories are based on the conventional distinction between commercial banks as creators and other private financial enterprises as brokers of loanable funds. Commercial banks can borrow at a lower interest rate and lend at higher interest rates. They relieve the market of some primary securities and substitute others’ indirect securities or financial assets whose qualities command a higher price. The margin between yields on primar y and indirect securities is the intermediaries’ compensation for the special services they supply.
6.6 The earliest theory of credit is the commercial loan theory of credit which is also referred to as the ‘real bills doctrine’. This theory, originated in England, dates back to the 18th century. Bank lending to merchants traditionally took the form of discounting of commercial bills. According to this theory, the earning assets of commercial banks must be in the form of short-term, self-liquidating loans extended to businesses for the financing of their inventory needs. It was strongly believed that banks by financing these types of loans could possess most liquid assets which will enable banks to easily meet their demand deposits obligations. In fact, the term ‘commercial bank’ owes its origin to the commercial loan theory as banking was related to the financing of commerce (Roussakis, 1997). Despite certain limitations of this theory, in practice many banks still prefer the short-term self-liquidating loans over other types.
6.7 Another major theory of bank lending is the shiftability theory which holds that a bank’s assets are shiftable, i.e., easily marketable and the liquidity of most of the assets is adequately maintained. For instance, the securities that can be easily converted into cash, possess a high degree of liquidity. In essence, the shiftability theory is based on the consideration of ‘how quickly’ the assets could be converted into cash. This theory was first set forth by H.G.Moultan in 1918. Commercial banks all over the world that hold stocks of sovereign bonds, which in present day banking is a common practice, are knowingly or unknowingly followers of this doctrine.
6.8 According to anticipated income theory (Prochnow,1949), a bank can maintain its liquidity if loan repayments are scheduled on the basis of the anticipated income of the borrower rather than the use made of the funds or the collateral offered. The basic argument of this theory is that the banks should rely on the borrower’s income earning capacity or the cash flow and the coverage of debt service requirements, rather than merely on the collateral. The debt service coverage is determined on the basis of inclusive cash-flow projections which ordinarily provide a reliable indication of the quality of the loan being financed. This theory seems to be more suitable in the practice of the modern time banking than the previous two theories.
6.9 According to the liability management theory, it is not necessary for a bank to observe traditional liquidity standards if it can go into the market and bid for funds whenever it is in need of liquidity. A bank can create additional liabilities to meet its liquidity requirements, and banks have a number of avenues to meet their liquidity requirements such as issuing CDs, borrowing from the central bank and borrowing in the capital market, among others. The liability management theory is a major breakthrough in the modern approach to commercial banking.
6.10 Banks lending operations are determined, at the micro level, based on certain considerations outlined in the theories discussed above. However, the quantum and target group of lending is determined by the financial system which a country adopts, i.e., market based financial system or bank based financial system. An important aspect of the growth process that has been widely discussed in the available literature on the subject is the type of financial system that is the most conducive to growth. Focusing from this standpoint, most of the systems of industrial finance can be grouped into two clear systems mentioned earlier. At one end is the ‘market-based finance’, where financial markets play a more important role than the banking industry. At the other end of the spectrum is the model of ‘bank-based finance’, in which savings flow to their productive uses predominantly through financial intermediaries such as banks and other financial institutions, and the capital market is less important for raising funds. Most of the industrial financing systems have evolved endogenously from their own particular circumstances of economic history - and have their own success story to tell or otherwise. The market-based system is relatively impersonal because the sources of funds could actually be atomistic household savers, directly or indirectly through mutual funds, pension funds or insurance funds. The bank-based systems are more relationship-based, because the lenders are few and large. Bank-based systems tend to be stronger in countries where the Governments have taken a direct role in industrial development such as Germany in the 19th century, and Japan, East Asia, South-East Asia, China and India, in the 20th century (Mohan, 2004).
6.11 Ever since India opted for development plans for its growth, the role and importance of banking and other financial institutions have gained in importance. Research has also confirmed the inter-linkage between finance and growth in India. The Indian growth process has, essentially been ‘finance-led’, whereby expansion in the financial sector played an enabling role in promoting capital accumulation, which, in turn, engendered higher growth (Reddy, 2006).
Portfolio Behaviour of Banks
6.12 Commercial banks hold a portfolio of assets and, given the characteristics and distribution of the liabilities, they attempt to structure their portfolio of assets in such a manner so as to yield the greatest return, subject to the constraints. Banks have four categories of assets, viz., cash in hand and balances with the central bank; assets with the banking system; investments in Government and other approved securities; and loans and advances. Quantitatively, lending and investments are the most important earning assets of banks. The quantum and also the composition of loans and investment is determined by the banks’ portfolio behaviour which, in turn, is generally determined by the present and expected levels of market interest rates, loan demand and cash demand and actions of the central banks. The study of commercial bank portfolio behaviour is important as it is a significant explanatory factor for the magnitudes and changes in the bank credit as well as the cost and flow of credit to specific sectors of the economy.
Determinants of Bank Lending
6.13 Literature sets for th divergent views regarding the determinants of bank lending. According to one view it is the demand side elements that determine the bank lending whereas the other view professes the dominance of supply side factors. The principle that the demand for bank loans determines bank portfolio behaviour is sometimes referred to as the accommodation principle. Similarly the principle that commercial banks’ responses to market forces determine their portfolio behaviour is referred to as profit maximisation principle. As per accommodation principle, bank lending is the key determinant of banks’ portfolio behaviour. The use of the term “accommodation” implies that the demandfor such loans would mainly determine bank behaviour regarding borrowing from the central bank, holdings of excess reserves, and the division of earning assets between loans and investments. Thus, the response of demand for loans to such economic variables as interest rates and economic activity would also determine bank behaviour regarding the above mentioned balance sheet accounts (Boyd and Gertler, 1993). Under the accommodation principle, bank behaviour would mainly reflect the demand of customers for loans. For example, a rise in the demand for loans from banks (supply of this form of earning asset) would be met, subject to the deposit constraint, by reductions in investments and excess reserves and an increase in borrowings from the central bank and, with banks being the mainstay of financial intermediation, the banking sector.
6.14 The profit maximisation principle implies that commercial banks’ responses to market forces determine their portfolio behaviour. If the existing distribution of assets held by the commercial bank is not the distribution desired, then the bank will attempt to adjust its portfolio of assets by increasing its holdings of some assets and decreasing its holdings of other assets. The commercial bank’s decision of allocating its portfolio of assets between the two earning assets, i.e., loans and investment are generally determined by the existing legal reserve requirements against commercial banks’ demand and time deposits. Given the de jure and de facto status of the most of banks’ liabilities, and given that an individual bank cannot predict with certainty future deposit flows, loan demands, interest rates, and actions by the monetary authorities, commercial banks desire to have a portion of their asset portfolio that represents a stock of liquidity to act as a buffer against changes in the aforesaid factors. In practice, the dominance of either demand or supply side on credit fluctuations is difficult to prove as both the factors play a determining role most of the times.
6.15 According to one view, the firms’ and households’ demandis the underlying determinant of bank credit. As per this view, the credit extended by the institutions adjusts in consonance with the demand conditions prevalent at that point of time. Cottarelli et al., (2003) put forth the view that the recent lending boom in central and eastern Europe owes its origin to an upward shift in the IS supply curve in the region following macroeconomic deregulation. Similarly, the collapse of bank lending in East Asia following the 1997-98 financial crises was led by a decline in the demand for bank loans rather than banks’ withdrawal from the credit market (Ghosh and Ghosh, 1999).
6.16 The real business cycle literature also sets forth the view that the demand for bank loans is highly procyclical. An analysis of several episodes of consumption boom in industrial and developing economies revealed that these owed their origin to consumption boom originating in terms-of-trade improvement. A positive technological shock with the resultant increase in investment and credit demand in the economy could also be one of the factors. Montiel (2000) after examining several episodes of consumption boom in industrial and developing economies between 1960 and 1995, concluded that in most of the countries, terms-of-trade improvements led to consumption boom which subsequently resulted in sharp pick up in lending by banks.
6.17 An alternative view is that fluctuations in bank lending reflect supply side developments such as changes in banks’ capacity and willingness to lend. To the extent that some firms face a high external premium in accessing the capital market, or such markets are not well developed, they are heavily dependent on bank lending. Others have argued that bank credit is, indeed, special because it could trigger innovation, particularly in industries that did not have access to external financing; (Rajan and Zingales, 1998). Thus, any shock that relaxes banks’ lending capacity - a rise in capital inflows or an easier monetary policy - could lead to increased credit supply in the economy. Moreover, such shocks could affect asset prices and balance sheets, exerting an indirect influence on banks’ capacity to lend (Mohanty et al., 2006).
6.18 Financial liberalisation in the face of poorly regulated and supervised banks and inappropriate incentive structures may also lead to increased boom and bust credit cycles in emerging economies (Hernández and Landerretche, 2002; Barth et al., 2002). Credit booms have often been preceded by strong capital flows and overheating of asset prices. However, when asset prices collapse, the banks’ non-performing assets rise. The banks become risk averse leading to a credit crunch as banks reduce their lending. The access to bank lending is also determined by the level of concentration of bank lending, regulatory regime in place and presence of foreign banks. The level of capital held by the bank also determines the willingness of the bank to support new loan proposals (Bernanke and Lown, 1991).
6.19 According to some recent studies, creditors’ rights and emergence of credit information bureaus in the emerging economies also create an enabling environment for improved lending by banks. The basic argument is that countries with better private property rights and credit risk screening mechanisms (particularly well functioning credit bureaus or credit registery systems) are able to achieve a higher credit to GDP ratio than those that lack such institutions (Mohanty et al., 2006).
6.20 To sum up, different theories have evolved from time to time to explain banks’ lending behaviour. According to the commercial loan theory, which is the earliest theory on credit, the earning assets of banks will be in the form of short-term and self-liquidating loans. According to the shiftability theory, the main consideration is how quickly the assets can be converted into cash. The anticipated income theory postulates that a bank can maintain its liquidity if loan repayments are scheduled on the basis of the anticipated income of the borrower. According to the liability management theory, it is not necessary for a bank to observe traditional liquidity standards if it can go into the market and bid for funds whenever it is in need of liquidity. Banks’ lending operations are determined at the micro level, based on certain considerations as suggested by the theories. However, the overall quantum and target group of lending is determined by the financial system which a country adopts, i.e., market based financial system or bank based financial system.
6.21 Bank lending is determined by both supply side and demand side factors. On the supply side, banks’ portfolio behaviour determines their lending. Commercial banks hold a portfolio of assets based on risk return perceptions and distribution of the liabilities so as to yield the greatest return. Loans and investments are the two most important earning assets in the asset portfolio of banks and their composition is determined by the banks’ portfolio behaviour which, in turn, is based on either accommodation principle where lending is the key determinant of banks’ portfolio or profit maximisation principle. A rise in capital inflows or an easier monetary policy could also lead to increased credit supply in the economy. Banks’ willingness to lend could also be affected by the regulatory regime in place, and whether they hold enough capital to support all the new profitable loan proposals.
III. LENDING OPERATIONS OF SCHEDULED
COMMERCIAL BANKS IN INDIA
Policy Developments
6.22 In India, prior to initiation of financial sector reforms in the early 1990s, the lending operations of the banking sector were highly regulated. These related to an administered structure of interest rates, high levels of pre-emptions in the form of reserve requirements, and credit allocation to certain sectors. There existed different credit limits and margin requirements in respect of sensitive commodities and sectors. There were requirements of prior approval from the Reserve Bank for sanction of credit beyond a threshold. Commercial banks were also required to meet mainly the short-term/working capital funds requirements. As such, banks did not have much choice in terms of allocation of resources among different asset classes.
6.23 The initiation of financial sector reforms facilitated a gradual move away from a financially repressed regime to a liberalised one. Banks were given the freedom to innovate and expand their businesses. Lending rates were freed to enable banks to price their products freely. Interest rate deregulation imparted greater efficiency to the resource allocation process (Box VI.1). The objective of the banking sector reforms was to promote a diversified, efficient and competitive financial system with the ultimate objective of improving the allocative efficiency of resources through operational flexibility, improved financial viability and institutional strengthening (Mohan, 2005). With the phasing out of the regulated regime, banks started exploring new avenues for expanding businesses.
Box VI.1
Lending Operations of Banks: Major Policy Initiatives
Since the early 1990s, several policy measures have been initiated to provide flexibility to banks in their lending and investment operations.
Lending Interest Rates
Lending interest rates of commercial banks were deregulated in October 1994 and banks were required to announce their prime lending rates (PLRs). The concept of benchmark prime lending rate (BPLR) was introduced by the Reserve Bank on April 29, 2003 to address the need for transparency in banks’ lending rates as also to reduce the complexity involved in pricing of loans. Banks are now free to prescribe respective BPLRs. Banks are also permitted to offer floating rate loan products linked to a market benchmark in a transparent manner.
Term-lending by Banks
Various restrictions on term loans by banks were gradually phased out by 1997. In terms of the guidelines prevailing before the initiation of economic reforms in 1991, banks were expected to extend term loans for small projects in participation with the State level institutions, though it was not mandatory. For large projects, however, they were allowed to participate compulsorily along with all-India financial institutions (FIs), subject to the condition that the share of the banking system would be restricted to 25 per cent of term loan assistance from banks and FIs and the aggregate term finance from the banking system could not exceed Rs.75 crore.
Exposure Limits
Regulatory limits on banks’ exposure to individual and group borrowers in India were prescribed to avoid concentration of credit. The applicable limit is 15 per cent of capital funds in the case of a single borrower and 40 per cent in the case of a group of borrowers. Credit exposure to borrowers belonging to a group may exceed the exposure norm of 40 per cent of bank’s capital funds by an additional 10 per cent (i.e., up to 50 per cent), provided the additional credit exposure is on account of extension of credit to infrastructure projects. Credit exposure to a single borrower may exceed the exposure norm of 15 per cent of bank’s capital funds by an additional 5 per cent (i.e., up to 20 per cent). In addition, banks may, in exceptional circumstances, with the approval of their boards, consider enhancement of the exposure to a borrower up to a further 5 per cent of capital funds.
Priority Sector Lending
Over the years the stipulation for lending to the priority sector has been retained, though its scope and definition was fine-tuned by including new items. Based on the recommendations of the Working Group, set up by the Reserve Bank, the priority sector norms were revised in April 2007. As per the revised norms, the sectors of the society/economy that impact large segments of the population, the weaker sections and the sectors which are employment-intensive such as agriculture and micro and small enterprises, have been retained as priority sector in the revised guidelines, which came into effect from April 30, 2007. Agriculture, small enterprise, micro credit, retail trade, education loans and housing loans up to Rs.20 lakh are the broad categories included in the priority sector.
NPA Management
The high level of non-performing loans (NPLs) of banks, apart from limiting the ability of credit institutions to recycle their funds, also weakened them by adversely affecting their profitability. The Reserve Bank and the Central Government, therefore, initiated several institutional measures to recover the past dues to banks and FIs and reduce the NPAs. These were Debt Recovery Tribunals (DRTs), Lok Adalats (people’s courts), Asset Reconstruction Companies (ARCs) and the Corporate Debt Restructuring (CDR) mechanism. Settlement Advisory Committees have also been formed at regional and head office levels of commercial banks. Furthermore, banks can also issue notices under the Securitisation and Reconstruction of Financial Assets and Enforcement of Security Interest (SARFAESI) Act, 2002 for enforcement of security interest without intervention of courts. Further, banks, (excluding securitisation companies/ reconstruction companies) have been permitted to undertake sale/purchase of NPAs. Thus, banks and other credit institutions have been given a menu of options to resolve their NPA problems.
Development of Securitisation Market
With a view to ensuring healthy development of the securitisation market, the Reserve Bank issued guidelines on securitisation of standard assets on February 1, 2006 to banks, financial institutions and non-banking financial companies.
Credit Information Bureau
Comprehensive credit information, which provides details pertaining to credit facilities already availed of by a borrower as well as his repayment track record, is critical for the smooth operations of the credit market. Lack of credit history is an important factor affecting the credit flow to relatively less creditworthy borrowers. In the absence of credit history, pricing of credit can be arbitary, the perceived credit risk can be higher and there can be adverse selection and moral hazard. Accordingly, a scheme for disclosure of information regarding defaulting borrowers of banks and financial institutions was introduced in 1994. In order to facilitate sharing of information relating to credit matters, a Credit Information Bureau (India) Limited (CIBIL) was set up in 2000, which took over the functions of dissemination of information relating to defaulting borrowers from the Reserve Bank. The Credit Information Companies (Regulation) Act was enacted in 2005 to facilitate the setting up of credit information companies.
Statutory Liquidity Ratio Provisions
At present, all scheduled commercial banks are required to maintain a uniform Statutory Liquidity Ratio (SLR) of 25 per cent of net demand and time liability as on the last Friday of the second preceding fortnight under Section 24 of the BR Act. The assets eligible for meeting the Statutory Liquidity Ratio requirements can be held in the form of cash, gold or in unencumbered approved securities. Consequent upon the amendment to Section 24 of the Banking Regulation Act, 1949, the floor rate of 25 per cent for the SLR has been removed and the Reserve Bank has also been empowered to determine the SLR eligible assets. However, no change has been made in the SLR so far in view of the prevailing macroeconomic and monetary conditions.
6.24 Diversification of por tfolios and asset adjustments by banks are now made more on the basis of risk-return considerations. Banks in India followed the accommodation principle in the pre-liberalisaton phase. However, the profit maximising principle has been dominating the banks’ portfolio behaviour in the post-liberalisation phase.
Trends in the Lending Operations of Scheduled Commercial Banks
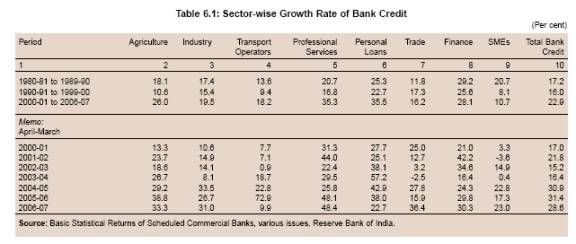
6.25 In India, like many other emerging market economies, commercial banks remain the most important source of credit supply. The total credit extended by scheduled commercial banks grew at 17.2 per cent during the 1980s and 16.0 per cent during the 1990s (Table 6.1).
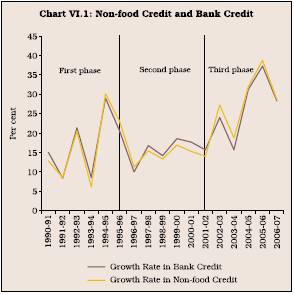
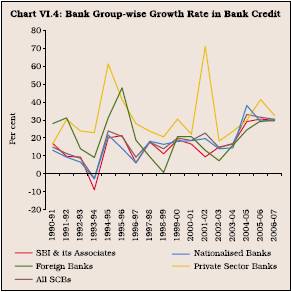
6.26 Credit by scheduled commercial banks from the early 1990s witnessed three distinct phases. In the first phase (from 1990-91 to 1995-96), bank credit growth showed erratic behaviour with the growth rate varying between 8 per cent and 29 per cent. In the second phase (from 1996-97 to 2001-02), bank credit growth decelerated sharply and ranged between 10 and 18 per cent. In the third phase (from 2002-03 to 2006-07) credit growth generally remained high (Chart VI.1).
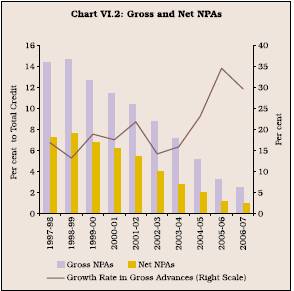
6.27 The deceleration in credit during the second phase was on account of several factors, both on the demand and the supply sides. On the supply side, introduction of prudential norms relating to income recognition, asset classification and provisioning in the early 1990s made banks cautious. Application of norms revealed large gross non-performing assets (NPAs) with scheduled commercial banks (15.7 per cent of their gross advances at end-March 1997). Banks, therefore, became wary of enlarging their loan portfolio. Regression analysis suggests that asset quality is one of the main determining factors of credit, besides time deposits and lending interest rate1. The relatively high level of NPAs, in particular, had a severe impact on weak banks. Banks’ capacity to extend credit was also impaired due to little headroom available in the capital adequacy ratio (8.7 per cent at end-March 1996). Banks found risk adjusted returns on
Government securities more attractive. Hence, despite lowering of statutory pre-emption in the form of SLR, banks continued to invest in Government securities, far in excess of the stipulated requirements. Banks’ investments in SLR securities at end-March 1996 were 36.9 per cent of net demand and time liabilities (NDTL) as against the prescribed requirement of 31.5 per cent. Banks’ investments in SLR securities remained more or less at that level (36.7 per cent) by end-March 2002, even as the SLR was brought down significantly to 25 per cent (RBI, 2007a).
6.28 On the demand side also, several factors contributed to the decline in demand for credit by the corporate sector. The industrial sector witnessed massive expansion in capacity in certain sectors, especially cement and steel, in the initial phase of reforms. However, as the quantitative restrictions were removed and import tariffs reduced, the corporate sector faced intense competition during the latter part of the 1990s. The focus of the corporate sector, thus, shifted from expanding capacity to restructuring and the industrial sector slowed down significantly. The average annual growth rate of industrial production was 5.2 per cent during 1996-97 to 2001-02 as compared with 9.4 per cent in the preceding three years. This affected the demand for credit by the corporate sector. Increased competition also forced corporates to restructure their balance sheets, whereby they increased their reliance on retained earnings and reduced their borrowings. This was evident from the debt-equity ratio, which declined from an average of 85.5 per cent during 1990-91 to 1994-95 to 65.2 per cent during 1995-96 to 1999-2000 (RBI, 2007a).
6.29 Although the Reserve Bank pursued accommodative monetary policy during this period (1996-97 to 2001-02) by reducing the cash reserve ratio (CRR) and the policy rates, viz., the Bank Rate and the reverse repo rate (the then repo rate), credit offtake did not pick up. Downward stickiness of nominal interest rates on the one hand, and the falling inflation rate on the other, led to a significant rise in real interest rates. The average real lending rates of banks increased to 12.5 per cent during 1996-97 to 2001-02 as against 6.5 per cent during 1990-91 to 1995-96 (Mohan, 2003). This also appeared to have contributed to slackness in credit expansion.
6.30 In the third phase (2002-03 to 2006-07), credit growth generally remained high. The nature of rapid credit growth from May 2002 has been structurally at variance from the historical trends. Credit, in particular, expanded at a robust pace of around 30 per cent for three consecutive years from 2004-05 to 2006-07. The credit expansion was also pro-cyclical in nature, which indicates that the strong income growth recorded in recent years also significantly contributed to credit growth (RBI, 2007a). One of the major contributory factors was an improvement in asset quality. As banks’ gross/net NPAs declined to more reasonable levels, credit growth accelerated (Chart VI.2).
6.31 Other major factors that contributed to the acceleration in credit growth were a pick-up in economic growth, moderation in inflation and inflation expectations, decline in real interest rates, rising income of households and increased competition with the entry of new private sector banks. Besides, the sharp growth in bank credit in recent years could also be attributed to factors such as financial deepening from a low base, structural shifts in supply elasticities, rise in efficiency of credit markets and policy initiatives to improve the flow of credit to sectors such as agriculture and small and medium enterprises. During this phase, retail credit, especially housing loans, emerged as the major source of credit demand as explained in Section
VII. Banks also increased their exposure to the infrastructure sector as detailed in Section VI.
6.32 The rise in the credit to GDP ratio indicates increasing financial deepening. However, rapid credit growth may pose certain risks. In view of rapid credit expansion, the Reserve Bank in April 2006 indicated that growth of non-food bank credit, including investments in bonds/debentures/shares of public sector undertakings and private corporate sector and commercial paper, would be calibrated to decelerate to around 20 per cent during 2006-07 from a growth of above 30 per cent. Keeping this in view, monetary measures were initiated to moderate the credit growth. Besides, prudential measures were also introduced in the form of increased risk weight and provisioning requirement for lending to certain sensitive sectors. The risk weight on exposures on commercial real estate was increased from 100 per cent to 125 per cent and further to 150 per cent. Banks’ total exposure to venture capital funds was included as part of their capital market exposure and they were required to assign a risk weight of 150 per cent to such exposures. The general provisioning requirement on standard advances to the sectors comprising real estate, outstanding credit card receivables, loans and advances qualifying as capital market exposure and personal loans, excluding residential housing loans, was raised to 2.00 per cent on January 31, 2007. The provisioning requirement in respect of residential housing loan was raised to 1.00 per cent from the existing 0.4 per cent for loans in excess of Rs.20 lakh. Monetary measures included an increase in the repo rate by 150 basis points in stages to 7.50 per cent by March 2007 from 6.00 per cent in September 2004. Further, CRR was raised by 150 basis points in stages from 4.50 per cent in March 2004 to 6.00 per cent by March 20072. The Reserve Bank increased the provisioning requirement for banks’ exposure in the standard asset category to systemically important NBFCs to 2.00 per cent from the earlier level of 0.4 per cent. Further, risk weight for banks’ exposure to such NBFCs was increased to 125 per cent from the earlier level of 100 per cent. Banks were prohibited from granting fresh loans in excess of Rs.20 lakh against the NR(E)RA and FCNR(B) deposits, either to depositors or to third parties.
6.33 Housing loans combined with infrastructure financing led to a sharp increase in the share of medium and long-term loans in total credit (Chart VI.3).
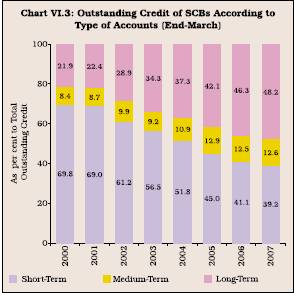
The share of long-term loans in the outstanding credit of scheduled commercial banks increased from 21.9 per cent at end-March 2000 to 34.3 per cent at end-March 2003 and further to 48.2 per cent at end-March 2007. The share of medium-term loans also showed an increase from 8.4 per cent in 2000 to 12.6 per cent in 2007.
6.34 Bank group-wise analysis indicates that credit growth of private sector banks was consistently above the overall credit growth. At times, it also showed wide variations (Chart VI.4)
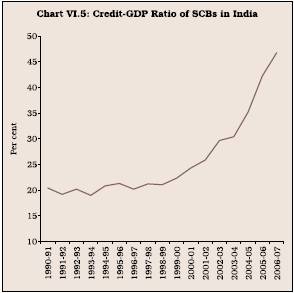
6.35 Bank credit (outstanding), which constituted 20.4 per cent of GDP at end-March 1991, increased to 22.3 per cent at end-March 2000 and 46.8 per cent at end-March 2007 (Chart VI.5).
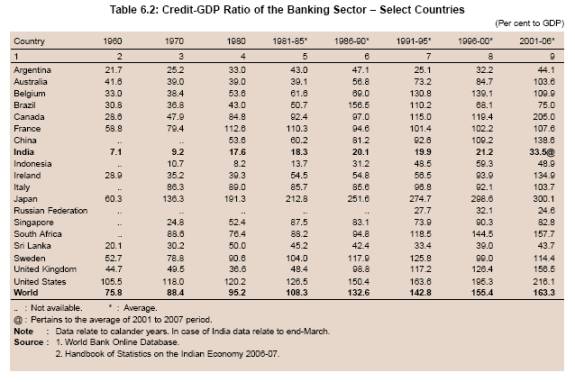
6.36 Notwithstanding the increase, the credit to GDP ratio in India was lower than that of developed and several emerging market economies (Table 6.2).
Credit-Deposit Ratio (CDR)
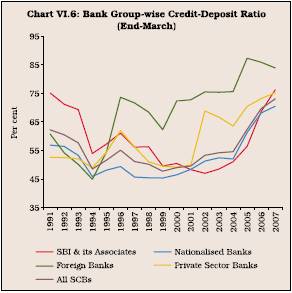
6.37 The credit-deposit ratio refers to the proportion of loan assets funded by banks from deposits mobilised. The C-D ratio of scheduled commercial banks tended to move upwards from 2000-01. The ratio, which was 48.4 per cent at end-March 1994, increased to 53.2 per cent at end-March 2002 and further to 73.0 per cent at end-March 2007. The financing of higher proportion of credit in recent years in a way was facilitated by excess SLR securities portfolio built-up by banks in the mid-1990s. An analysis of bank-group wise credit-deposit ratio during the period 1991-2007 reveals that the credit-deposit ratio of all bank groups tended to move up in line with the increase in overall credit from 2001-02. The ratio of various bank groups almost converged at around 73 per cent at end-March 2007, barring foreign bank group, which maintained significantly higher C-D ratio from 1995-96 than other bank groups. The ratio in respect of foreign banks was at around 84 per cent at end-March 2007 (Chart VI.6).
Sectoral Deployment of Credit
6.38 Economic refor ms and the evolving economic structure had a profound impact on the bank lending to the various sectors of the economy during the 1990s and the current decade. The growth of lending to agriculture by banks during the 1990s slowed down to almost one-half as compared with the 1980s. However, credit growth to agriculture picked up significantly from 2003-04 onwards as a result of concerted efforts made by the Reserve Bank and the Government to increase the flow of credit to agriculture. Bank lending to the industrial sector too slowed down, albeit marginally, in the 1990s. However, it picked up in the current decade. Credit growth to the household sector accelerated sharply in the current decade (refer Table 6.1).
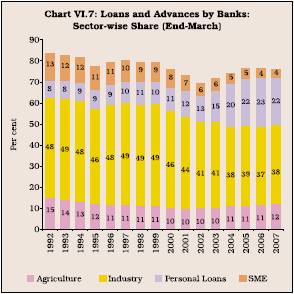
6.39 The share of personal loans in overall credit extended by SCBs increased from 6.4 per cent at end-March 1990 to 22.3 per cent at end-March 2007 (Chart VI.7 and Table 6.3). As a result, other components of credit underwent a significant change. The share of theagriculture sector in bank credit declined in the 1990s before it recovered from end-March 2002 onwards. The share of the industry and the SME sectors also declined. A detailed analysis of bank credit to various sectors is set out in the following sections.
IV. LENDING TO AGRICULTURE
6.40 The key driver for the progress of any sector is the availability of adequate credit. In the case of agriculture, it is not only the availability of credit but also the access to adequate institutional credit that matters, since most of those who are engaged in agriculture belong to the marginal and small farmer categories. In view of this, the strategy has been to strengthen the role of institutional sources of credit
to agriculture with a view to replace informal sources of credit such as moneylenders and ensuring timely credit to the agricultural sector. Moreover, since agriculture still continues to depend on the monsoon (as evident in substantial year to year variations in agricultural output), it is perceived as a high risk area (Box VI.2).
6.41 There was a perceived reluctance on the part of the banks to service high-risk activities, including agriculture. Some policy intervention was thus felt necessary to direct credit to the agricultural sector. The policy framework of agricultural finance has evolved over the years with the aim of creating an enabling environment for the smooth flow of resources to agriculture. The need for adequate institutional credit to agriculture occupied the policy space as early as 1936 and 1937 when studies showed that finance to agriculture was totally dependent on moneylenders and co-operatives and other agencies played a negligible part. Hence, during the period between 1935 and 1950, the focus of the Reserve Bank was on re-invigorating the co-operative credit movement. The increased role for commercial banks in the delivery of rural credit in national policy began as a result of the recommendations of the All India Rural Credit Review Committee set up by the Reserve Bank in July 1966 (Chairman: Shri B Venkatappiah). The role of commercial banks was further widened following the nationalisation of major commercial banks in 1969 (and in 1980) and with the introduction of the concept of priority sector advances in 1969, which was formalised in 1972 (Box VI.3). In terms of recommendations of the Working Group on Rural Banks (Chairman: Shri M Narasimham), regional rural banks (RRBs) were set up constituting the third institutional tier in the “multi-agency approach”. Following the recommendations of the Committee to Review Arrangements for Institutional Credit for Agriculture and Rural Development, a specialised institution, National Bank for Agriculture and Rural Development (NABARD) was set up in 1982. It took over the entire undertaking of the Agricultural Refinance and Development Corporation (ARDC) and the refinancing functions of the Reserve Bank in relation to State co-operatives and RRBs.
Box VI.2
Risks Associated with Lending to Agriculture
The nature of risk and its intensity faced by farmers and rural entrepreneurs vary according to the type of farming system, agricultural production, weather conditions and the prevailing economic and agricultural policies. The risks that the financial institutions face while lending to agriculture relate mainly to high interest and liquidity risk, refinance risk and credit risk.
Credit riskincreases in long-term agricultural lending, since estimation of prices, costs, market demand and technical progress becomes more difficult over longer time horizons and the likelihood of systemic risk increases. Accordingly, the margin of error inherent in loan appraisal increases proportionately to loan maturity. There is also the case of larger amounts and longer terms, which result in increasing the moral hazard risks.
Any defaults on term loans have a greater impact on the quality of portfolio of the lender. This may lead to higher costs for loan loss provisioning and affect the rating of the bank in the capital market, increasing the costs of funds. In order to contain portfolio risks, lenders are constrained to limit the share of agricultural term loans in their portfolio. The severity of this risk is more if instruments for managing systemic risks such as crop insurance, irrigation or price risk management tools are absent.
A conventional bank practice that protects the lender against possible borrower default is the requirement of loan collateral such as real estate or mortgage. Banks use loan collateral in order to screen potential clients (as a substitute for lack of customer information) and to enforce and foreclose loan contracts in the event of loan default. The preferred form of conventional bank collateral is mortgage on real property, which, however, requires clear land titles and mortgage registration. As there is generally lack of clear and secure land titles, banks face additional risk in lending to agriculture.
Lending to agriculture tends to be heavily dependent on a very narrow range of sub-sectors with bulk of the portfolios restricted to 2-3 agricultural products in any given branch. The more concentrated the portfolio is among fewer agricultural products, the more susceptible the entire portfolio to market risk and changes in the industry. Moreover, as economic activities of rural depositors are similar or interlinked, the ‘production risks’ tend to be covariant in a given community and might be passed on to the deposit-taking institution. For instance, in the event of any major crop failure and animal diseases among others, the lending institution is beset with the higher risks of massive deposit withdrawals simultaneously with higher loan demand.
One of the most common risks faced by the agriculture sector in developing countries is the vulnerability of the prices of the final products to macroeconomic factors in the rest of the world than the market for the goods and services of urban enterprises, which tend to have local markets that are less volatile, even if they are weak.
The presence of higher risks assumes criticality in lending to agriculture. It is held that experiments with crop or credit-insurance have not been very satisfactory in most of the developing countries so far. In fact, many farmers feel that where compulsory insurance is resorted to, it has only increased the burden of borrowing from institutional sources and once the transaction costs are added, the overall costs rise significantly. Perhaps, it is necessary to recognise that if some elements of insurance are ab initio not viable, extending credit becomes more risky and hence constrained (Reddy, 2005).
References:
Coffey, Elizabeth. 1998. “Agricultural Finance: Getting the Policies Right.” Agricultural Finance Revisited No.2, FAO, June.
Gichler, Thorsten. 1999. “Sources of Funds for Agricultural Lending.” Agricultural Finance Revisited No.4, FAO, December.
Reddy, Y.V. 2005. “Banking Sector Reforms in India: An Overview.” RBI Bulletin, June.
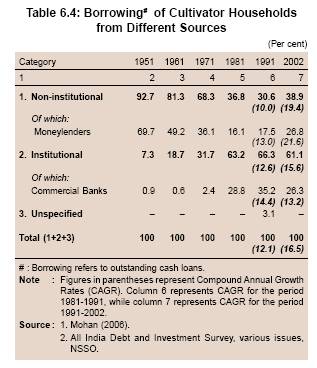
6.42 Institutional credit to cultivator households has made considerable progress since the mid-1960s. Based on the All India Debt and Investment Surveys (AIDIS) by the National Sample Survey Organisation (NSSO), the share of borrowings of cultivator households from institutional sources increased from 7.3 per cent in 1951 to 66.3 per cent in 1991, but declined to 61.1 per cent in 2002. Between 1991 and 2002, borrowings by cultivator households increased sharply, especially from non-institutional sources. The increase in household indebtedness was largely on account of consumption and similar other expenditures. It is, therefore, possible that the increase in indebtedness of cultivator households to non-institutional sources was also partly on account of consumption expenditures, which could not be easily financed from institutional sources. As a result, the share of non-institutional sources in the indebtedness of cultivator households increased between 1991 and 2002 even as indebtedness of cultivator households to institutional sources grew at a higher rate between 1991-2002 in comparison with 1981-91 (Table 6.4).
Box VI.3
Priority Sector Targets for Scheduled Commercial Banks - Revised Guidelines
The origin of priority sector prescriptions for banks in India can be traced to the Credit Policy for the year 1967-68, wherein it was emphasised that commercial banks should increase their involvement in the financing of priority sectors, viz., agriculture, exports and small-scale industries, as a matter of urgency. However, the concept of the priority sector was formalised in 1972 on the basis of the report submitted by the Informal Study Group on Statistics Relating to Advances to the Priority Sectors constituted by the Reserve Bank in May 1971. On the basis of this report, the Reserve Bank prescribed a modified return for reporting priority sector advances and certain guidelines were issued in this regard in February 1972, indicating the scope of the items to be included under various categories of priority sector. In most of these cases, the guidelines indicated only the general description of the advances to be included and no ceilings were fixed, except in the case of small-scale industry and road and water transport operators where ceilings on the value of original investments were indicated. The scope and extent of priority sector has undergone several changes since then with several new areas and sectors being brought within the purview of this sector.
As per the revised priority sector norms in April 2007, the priority sector definition was rationalised to include only those sectors that impact large sections of the population, the weaker sections and the sectors which are employment-intensive such as agriculture, and tiny and small enterprises. The broad sectors under the revised norms include agriculture (both direct and indirect), small enterprises (direct and indirect), retail trade in essential commodities and consumer cooperatives stores, micro credit, education loans and housing loans.
Under the revised norms, the overall priority sector lending targets at 40 per cent and 32 per cent for the domestic and foreign banks, respectively, as also other sub-targets, have been retained unchanged. However, these are now calculated as a percentage of adjusted net bank credit (ANBC) or credit equivalent amount of off-balance sheet exposures (OBE), whichever is higher, instead of net bank credit (NBC). ANBC includes NBC plus investments made by banks in non-SLR bonds held in HTM category.
Individual farmers, under priority sector advances, can avail of up to Rs.10 lakh against pledge/hypothecation of agricultural produce (including warehouse receipts) for a period not exceeding 12 months, irrespective of whether the farmers were given crop loans for raising the produce or not. Out of the overall 40 per cent target for domestic banks, a sub-target of 18 per cent of adjusted net bank credit or credit equivalent amount of off-balance sheet exposure, whichever is higher, has been set for lending to the agricultural sector. The 18 per cent lending target to agriculture is inclusive of finance provided by banks to farmers indirectly, i.e., through other agencies or indirect finance. However, indirect credit to agriculture should not exceed 4.5 per cent of adjusted net bank credit or 25 per cent of overall credit to agriculture (which is used for computing the performance by the banks under the sub-target of 18 per cent). Under the priority sector norms direct institutional credit to the agriculture sector includes loans sanctioned for small and marginal farmers for purchase of land for agricultural purposes. Distressed farmers indebted to non-institutional lenders can obtain loans against appropriate collateral and group security.
In the revised guidelines, with the aim of overcoming the crowding out effect against small loans, particularly to agriculture, only one-third of amount of the big-ticket loans/ advances are allowed to be classified as direct agriculture. In order to address cases where banks report a ‘nil’ or negligible net bank credit (NBC) on account of its engagement in mostly non-funded business (derivatives), the priority sector lending targets were linked to the credit equivalent of their off balance-sheet business.
In case, the domestic scheduled commercial banks are unable to meet the priority sector lending targets (40 per cent of ANBC or credit equivalent amount of off-balance sheet exposure, whichever is higher) and/or agriculture target (18 per cent of ANBC or credit equivalent amount of off-balance sheet exposure, whichever is higher), they would be allocated amounts for contribution to the Rural Infrastructure Development Fund (RIDF) established with NABARD or funds with other financial institutions, as specified by the Reserve Bank. The foreign banks with a shortfall in priority sector lending as per stipulated target/sub-targets are required to contribute to Small Enterprises Development Fund (SEDF), the necessary logistics in this respect have been put in place by Small Industries Development Bank of India (SIDBI).
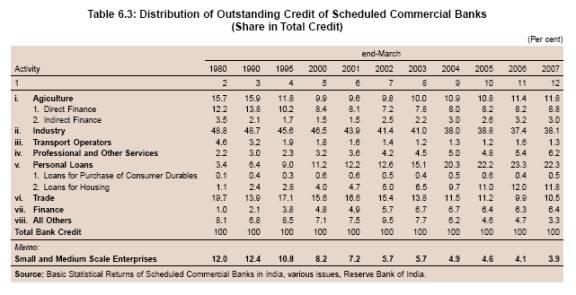
6.43 As per the statistical returns by banks3, of the direct4 institutional sources of agricultural credit, the share of co-operatives, which constituted the largest share of 57 per cent of outstanding direct institutional
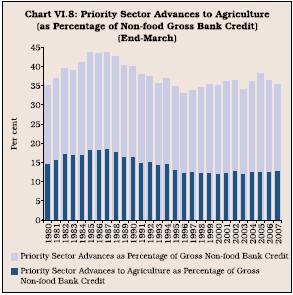
agriculture credit in 1980-81, declined to 32 per cent in 2001-02. On the other hand, the share of scheduled commercial banks (including RRBs), which constituted 43 per cent of outstanding direct institutional credit to agriculture in 1980-81, increased to 68 per cent in 2001-02, thereby emerging as the largest source of direct institutional agricultural credit. However, the share of agricultural credit in the total credit outstanding by scheduled commercial banks (SCBs) showed a sharp decline in the 1990s and at the beginning of the current decade. The share of priority sector advances to the agricultural sector by SCBs in gross non-food credit declined from a peak level of 18.4 per cent at end-March 1987 to 14.8 per cent at end-March 1991 and further to 12.1 per cent at end-March 2001 (Chart VI.8).
6.44 There has been a significant improvement in the share of SCB credit to agriculture in the recent years. The share of agricultural credit in total credit outstanding of SCBs increased from 9.8 per cent at end-March 2002 to 11.8 per cent at end-March 2007, although it was still below the level attained in the early 1990s. The
upturn could be attributed to a series of policy measures initiated to improve the credit flow to agriculture. These, among others, included the rescheduling of short-term loans into medium and long-term loans following agricultural distress in several parts of the country, higher credit targets under Special Agricultural Credit Plans for public and private sector banks, and directions to banks to double the flow of credit within three years starting from 2004-05 (RBI, 2007a). As part of the comprehensive credit policy for agriculture announced by the Government of India on June 18, 2004, agricultural credit was to be doubled within three years, with credit to increase at the rate of 30 per cent per year. In terms of financial inclusion, policy efforts were directed towards increasing the coverage of farmers by commercial banks by extending finance at the rate of 100 farmers/branch and financing of 50 lakh new farmers in a year. As a result, growth of SCB credit to agriculture, which was a low 10.6 per cent during the 1990s, accelerated to 26.0 per cent during 2000-01 to 2006-07. Growth of bank credit to agriculture accelerated significantly from 2003-04 onwards, from 23.7 per cent during 2001-02, to 29.2 per cent during 2004-05 and further to 38.8 per cent during 2005-06, before moderating to 33.3 per cent in 2006-07 (refer Table 6.1). A salient feature of the upturn was the sharp increase in the share of indirect finance5 in total credit
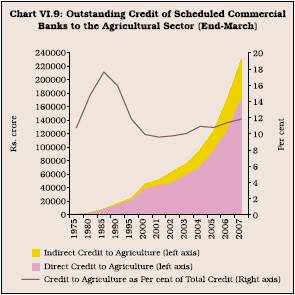
by SCBs to the agricultural sector from 16.1 per cent at end-March 2001 to 25.5 per cent at end-March 2007 (Chart VI.9). The growth in indirect finance was possibly a consequence of the broadening of the scope of items covered under the indirect bank finance to the agricultural sector.
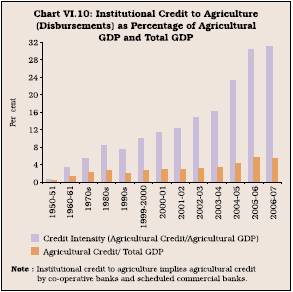
6.45 As a result of the various policy initiatives to improve the flow of credit to agriculture, credit to agriculture from institutional sources as percentage of agricultural GDP (credit intensity) increased sharply from 11.3 per cent in 2000-01 to 31 per cent in 2006-07. The share of agricultural credit from institutional sources in total GDP (at factor cost at current market prices) also rose from 2.8 per cent in 2000-01 to 5.4 per cent in 2006-07 (Chart VI.10). One striking aspect of this increase in credit intensity of the agricultural sector was that it was occurring at a time when the value added by agriculture as a ratio to GDP was witnessing a decline (Mohan, 2006).
Agricultural Credit by SCBs: Bank Group-wise
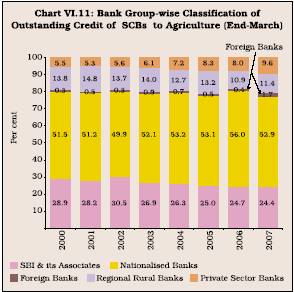
6.46 Bank group-wise distribution of credit of scheduled commercial banks suggests that at end-March 2007, more than half of outstanding bank credit to agriculture was contributed by the nationalised banks group (52.9 per cent) and around one fourth by the State Bank group (24.4 per cent). Among scheduled commercial banks,public sector banks, thus, together accounted for more than three fourths (77.3 per cent) of credit to the agricultural sector. Over the years, while the share of SBI and its associates declined, that of nationalised banks and private sector banks increased. The share of regional rural banks, which were primarily set up to provide timely institutional credit in rural areas specifically to agriculture, declined to 11.4 per cent at end-March 2007 from around 13.8 per cent at end-March 2000. The share of private sector banks witnessed a moderate increase during the period 2000-2007 (Chart VI.11).
Agricultural Credit by SCBs: By Type of Loans
6.47 The trend in credit to agriculture by SCBs based on type of account reveals that the share of long-term loans6 in total outstanding credit to agriculture has declined sharply since the early 1990s. This was in contrast to the pattern in overall bank credit, wherein the share of long-term loans in total bank credit increased sharply. The share of long-term loans to agriculture in outstanding credit by SCBs to agriculture declined sharply from 76.3 per cent at end-March 1991 to 59.3 per cent at end-March 1996, to 40.7 per cent at end-March 2005 and further to 34.7 per cent at end-March 2006 before showing an improvement to 39.8 per cent at end-March 2007.
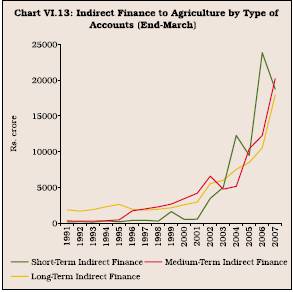
6.48 On the other hand, the share of short-term credit7 in total agricultural credit by scheduled commercial banks increased significantly from end-March 2002 while that of medium and long-term loans declined (Chart VI.12). This increase in the
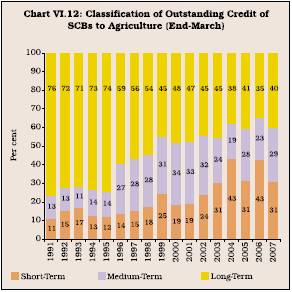
share of short-term credit from 2002 was contributed largely by the sharp increase in short-term indirect finance. Short-term indirect finance to agriculture increased from Rs.165 crore at end-March 1991 to Rs.23,829 crore at end-March 2006 before declining to Rs.18,714 crore at end-March 2007 (Chart V1.13). As a result, the share of short-term indirect credit to agriculture in short-term credit to agriculture increased from 16.2 per cent at end-March 2001 to 58.4 per cent at end-March 2006 before declining to 45.9 per cent at end-March 2007. The decline in the share of term loans could be the result of both supply and demand side constraints. On the demand side, the demand for credit for investment may have been adversely affected due to reduction in the average size of land holdings. Between 1991-92 and 2003, the number of operational holdings increased from around 93 million to around 101 million, whereas the area operated declined from around 125 million hectares to around 108 million hectares, resulting in a decline in average area operated from 1.34 hectares in 1991-92 to 1.06 hectares in 20038. On the supply side, banks might also be interested more in short-term credit as it bears low credit risk, entails lower supervision and monitoring costs, and facilitates a better asset liability management (Golait, 2007).
Agricultural Loans by SCBs: By Size of Land Holdings
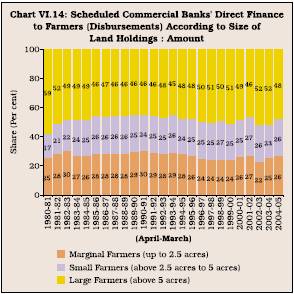
6.49 The underlying objective in granting priority sector status to agriculture was to ensure that credit flowed specifically to the small and marginal farmers, who constituted the bulk of the agricultural labour force. Data on loans disbursed by SCBs to agriculture, according to the size of land holdings, revealed that the share of marginal farmers (with land holdings up to 2.5 acres) in the total agricultural loans remained broadly at the same level between 1980-81 and 2004-05. The share of small farmers (with land holdings above 2.5 acres and up to 5 acres) increased from 16.6 per cent in 1980-81 to 26.2 per cent by 1985-86 and remained broadly at that level thereafter, while that of large farmers (with land holdings of above 5 acres) declined from 58.5 per cent in 1980-81 to 46.2 per cent in 1985-86 and remained broadly at the same level thereafter (Chart VI.14). Thus, even when loans to small and marginal farmers in absolute amount increased by more than ten times between 1990 and 2005, their share in total agricultural loans did not show any significant improvement.
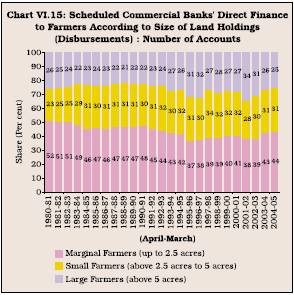
6.50 In terms of number of loan accounts, the share of marginal farmers in total number of agricultural loan accounts declined from 51.7 per cent in 1980-81 to 37.4 per cent in 1995-96, before recovering to 44 per cent in 2004-05 (Chart VI.15).
Agricultural Credit by SCBs: Small Loans to Agriculture
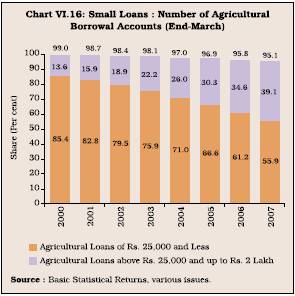
6.51 Small loans to agriculture (comprising borrowal accounts up to Rs.2 lakh as per the revised cut-off limit for small loans effective March 1999), which constituted around 99 per cent of total number of agricultural borrowal accounts at end-March 2000, declined moderately to 95.1 per cent at end-March 2007. The further break-up of small loans category shows that the share of small borrowal accounts with a credit limit of less than Rs.25,000 in total number of agricultural borrowal accounts declined from 85.4 per cent at end-March 2000 to 55.9 per cent at end-March 2007. However, the share of small borrowal accounts with credit limit greater than Rs.25,000 and up to Rs.2 lakh in total number of agricultural accounts increased from 13.6 per cent at end-March 2000 to 39.1 per cent at end-March 2007 (Chart VI.16).
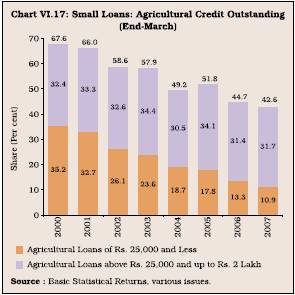
6.52 The share of agricultural credit outstanding to small borrowal accounts up to Rs.2 lakh in total agricultural credit declined from 80.9 per cent at end-March 1992 to 67.6 per cent at end-March 2000 and further to 42.6 per cent at end-March 2007. This was primarily on account of a significant decline in the share of agricultural credit outstanding in respect of small borrowal accounts with a credit limit size class of Rs.25,000 and less (Chart VI.17).
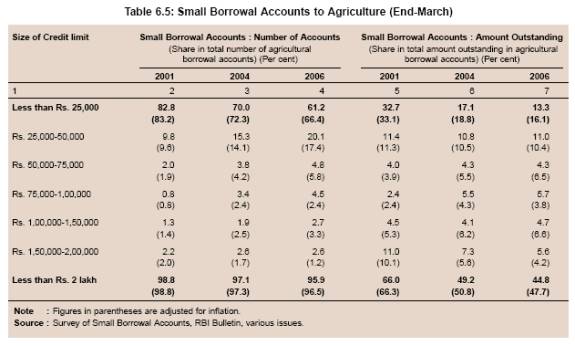
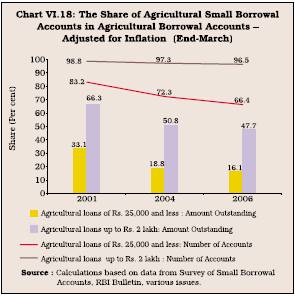
6.53 The decline in the share of agricultural small borrowal accounts (which comprise accounts up to credit limit size of Rs.2 lakh) in terms of number of accounts and amount outstanding was partly due to inflation effects. The credit limit size classes are expressed in nominal terms and over a period of time, on account of inflation, there is a possibility that the value of these credit limit size classes in real terms has fallen. On the basis of the 'Survey of Small Borrowal Accounts', for the period 2001-2006, after adjusting the credit limit size classes under small borrowal accounts for inflation9, the decline in the share of number of agricultural small borrowal accounts in total number of agricultural borrowal accounts persisted, although the extent of decline was somewhat lower. The share of number of small borrowal accounts with a credit limit of Rs.25,000 and less (which is the credit limit size with the most number of agricultural small borrowal accounts), after adjusting for inflation declined. However, the decline was of a lower order when adjusted for effects of inflation. The share of amount outstanding under agricultural small borrowal accounts in total credit outstanding to agriculture, after adjusting for inflation effects, also witnessed a decline, although of a lower order than without adjusting for inflation effects (Table 6.5 and Chart VI.18).
Cross-Countr y Exper iences in Lending to Agriculture
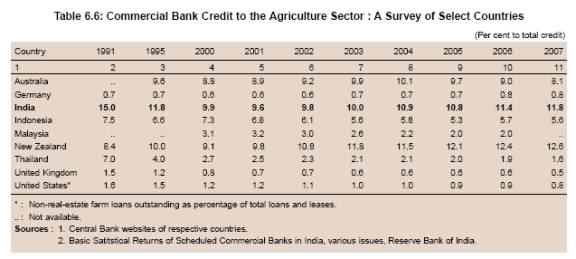
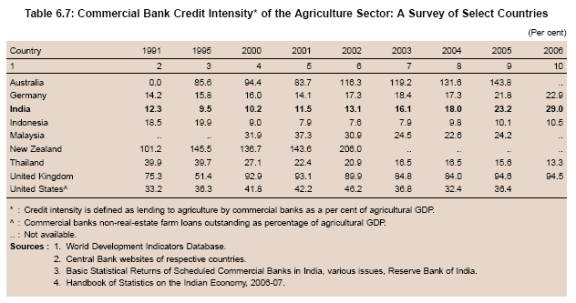
6.54 In 2007, New Zealand was the only country in the sample studied in which the agricultural credit share in total credit of commercial banks was higher than that of India (Table 6.6). Among the countries reviewed commercial bank credit intensity of the agricultural sector in India (i.e., agricultural credit of commercial banks as percentage of agricultural GDP) was similar to that in other East Asian emerging economies. However, credit intensity of agriculture was significantly higher in countries such as New Zealand, Australia, the UK and the US (Table 6.7). This could be mainly due to the higher level of commercialisation of agriculture in these countries, which demands increased credit for technological upgradation, for food processing activities and also for marketing systems for agricultural products.
6.55 To sum up, in India, the share of institutional credit in total agricultural credit has increased significantly since the mid-1960s (Government of India, 2007b). Co-operative banks were the predominant source of institutional agricultural credit in the 1970s and the early 1980s, while scheduled commercial banks emerged as a major source from the mid-1980s. The
share of institutional credit in the indebtedness of cultivator households declined between 1991 and 2002. This was mainly on account of a sharp increase in borrowing from non-institutional sources. Borrowings by cultivator households from institutional sources in the 1990s continued to grow more or less
at the same rate as during the 1980s. However, credit growth to agriculture by SCBs picked up significantly from 2003-04. As a result, the share of credit to agriculture in total credit by SCBs increased in recent years. Priority sector advances to agriculture as percentage of non-food bank credit also increased. As a result, credit intensity of the agricultural sector improved. However, some disquieting features were also observed. One, the share of long-term loans in total credit to agriculture declined almost consistently between 1991 and 2006; the share in 2006 was less than half of the share in 1991. Two, the share of marginal farmers in direct finance to farmers and in total credit accounts held by them showed little perceptible improvement. Three, the share of loans up to Rs.2 lakh, interest rates on which continue to be partially regulated, witnessed a decline both in credit accounts and amount outstanding. However, this decline persists even after adjusting for inflation, although the decline was of a lower order after adjusting for inflation.
Issues in Bank Credit to Agriculture
6.56 Agricultural credit as percentage of total bank credit showed a persistent decline from the early
1990s to 2000-01. This period was also characterised by a decline in the share of agriculture in GDP. Therefore, a more relevant measure to evaluate the agricultural credit performance would be credit intensity, i.e., agricultural credit as percentage of agricultural GDP. Credit intensity of agriculture, which rose continuously between the early 1950s and the 1980s, declined in the 1990s. Growth in bank credit to agriculture, however, accelerated significantly from 2003-04 on account of the various policy initiatives by the Government and the Reserve Bank. As a result,
credit intensity began to increase sharply from 2003-04 onwards. However, insofar as the priority sector credit norms for agriculture are concerned, the credit flow to agriculture has been below the priority sector target of 18 per cent for agriculture since early 1990s. Only eight of the 28 public sector and three of the 26 private sector banks met the target of extending 18 per cent of the net credit outstanding to agriculture at end-March 2007 (RBI, 2007b). The shortfalls in priority sector lending targets by the commercial banks are required to be deposited with the Rural Infrastructure Development Fund (RIDF) maintained with NABARD. Thirteen annual tranches of RIDF have so far added up to Rs.72,000 crore (NABARD, 2007). The Union Budget for 2008-09 has budgeted the corpus of fourteenth tranche of RIDF, i.e., RIDF-XIV for 2008-09 at Rs.14,000 crore.
6.57 Although the overall flow of institutional credit has increased in recent years, there are still several issues in agricultural credit delivery arising out of structural transformation taking place in the agricultural sector. First, a change in the pattern of demand for agriculture is emerging as the agricultural sector is getting increasingly diversified and the required scale of finance is increasing. Second, though substantial proportion of Indian agriculture continues to be a ‘small farm’ based economic activity, it is increasingly moving from a system of farmers’ own-resource based subsistence farming to input-based intensive commercial farming. However, at present, the banking system in India is geared more to financing the traditional crops like cereals. It needs to reorient itself to meet the changing requirements of commercialisation of agriculture with heterogeneous production cycles. There is an increased demand for allied activities such as dairy, fishing and livestock, cash crops, besides ancillary activities such as sorting, grading, processing, packaging and transporting to final destinations and markets. Other service sector activities that spin-off the main activities are also growing. On the part of the banks, this would call for designing innovative schemes and products which recognise the differing nature of agri-business and supply chains for different products. More importantly, increased commercialisation of agriculture would call for newer forms of credit assessment and risk-management systems to be put in place, besides upgrading skills and changes in attitudes and mindsets. The banking system may also have to address the problem of “financial dualism”, characterised by faster modernisation of urban financial markets compared with their rural counterparts and the “digital divide”, which separates those using modern computers and communication technologies from those who do not. Financial dualism could result in large farmers, agri-business and rural industries obtaining financial services from modern urban financial institutions, while small and marginal farmers and landless labourers may have to depend on micro-finance and personal savings (Mohan, 2006). More or less similar issues in effective credit delivery to the agriculture sector are confronted by several other developing countries and even advanced countries (Box VI.4).
International Experiences in Credit to the Agricultural Sector
6.58 Broadly, agricultural finance systems in various countries can be classified into three categories, viz., the developmental model, the mixed market model and the market liberal model (Coleman and Grant, 1998). In developmental model, the state plays a proactive and dominant role in agricultural finance activities. This, among others, takes the form of providing long-term credit, where commercial banks are reluctant to participate. For this purpose, specialised corporations are established, interest rates are charged lower and subsidised loans are provided to agriculture. In a mixed market model, there is an orientation towards market-based provision of infrastructure for agriculture, while at the same time a special role for direct state intervention is retained. In such a model, though state supported agencies exist, they cater to the broader agri-food sector rather than agriculture producers and they work in direct competition with the commercial banks. Finally, in a market liberal model, there exists no specific support for agricultural farmers and marginal producers and the credit needs of agriculture, as in the case of other sectors, are met by the banking system. Most of the countries follow one of the three models or a mix of the three. However, the specific lending practices have evolved in accordance with the country-specific needs and characteristics (Box VI.5).
6.59 Most developing countries followed largely ‘supply-side’ oriented directed credit programme till the 1980s. A review of agricultural credit delivery mechanisms in developing countries revealed that results of the supply-led thrust to agricultural credit were disappointing for several reasons. First, for agriculture, more than liquidity the immediate need is that of flexible services, which are generally provided by informal lenders. Second, despite empirical evidence of significant saving potential of small farmers, the agricultural credit markets failed, which could be attributed to inadequate public investment in legal and physical infrastructure, enforcement mechanisms and commodity risk mitigating mechanisms. Third, the fungible nature of money, provided as credit, very often resulted in funds being used for purposes other than investment, thereby reducing the effectiveness of credit in enhancing productivity. There were some examples of successful credit programmes, which were primarily due to strong village co-operative systems and social cohesiveness along with institution building and development of legal and physical infrastructure (Yaron, 1992; FAO, 1998; Meyer and Nagarajan, 2000). However, with non-sustainability of directed credit in many developing countries, ‘demand-centric approach’ – where the stress is more to meet the unique credit requirements of the farmers, especially the small and marginal farmers through specific products – has been adopted, focusing on the viability of banking. Noteworthy among them are the success stories of Bank Rakyat Indonesia (BRI) and its BRI- UD (Unit Desai) system in Indonesia and Bank for Agriculture and Agricultural Co-operatives (BAAC) in Thailand (Box VI.6).
Box VI.4
Issues in Agricultural Credit - Developing Countries’ Perspective
Agriculture plays an essential role in developing economies, especially because the large proportion of the population is engaged in agriculture in developing countries as also for strategic reason of ensuring food security. The variety in farming activities and farm management poses challenges and opportunities to agricultural and rural lenders. It is common that policymakers, particularly in developing countries, have been confronted with the task of resolving a number of issues in agricultural lending.
The basic challenge faced is that providing finance to agriculture and rural development is not seen as a commercial and business opportunity by the banks or for that matter by the formal financial systems. Unlike in the past, the present day agriculture has become increasingly capital intensive which requires access to working capital and seasonal loans along with medium and long-term credit for on-farm investments and cannot modernise without the suppor t of a strong financial system. Significantly, even small farmers generally have no access to formal credit because the financial system is not innovative or sufficiently efficient to reduce transaction costs and to provide ‘tailor-made’ products to small clients at affordable cost.
Two major factors that hamper the smooth flow of credit to agriculture are the absence of effective credit delivery systems and the lack of adequate credit absorptive capacity of the rural populace.
In agricultural lending, the cost for delivery and monitoring of credit is found to be very high and the banks have not yet found an easy solution to manage the cost of credit delivery and supervision in the agricultural sector within the discipline of balance sheet numbers. Distances between clients and financial intermediaries, transport and communication difficulties, and the risky nature of agriculture that is vulnerable to natural disasters, boost these costs. The challenge still is to design and deliver the provision of loan products to better suit the farming community. Weak land titling and cumbersome and costly court procedures also compound the problems of providing conventional collateral for loans in rural areas, thereby further increasing the risks of rural lending. Another major issue confronting the agricultural and rural credit is that standard credit programmes are not suited to the heterogeneous needs of small farmers. Subsidised interest rates blocked the emergence of vigorous and competitive rural financial markets, fostered loan repayment indiscipline, prevented banks from covering costs, and discouraged local savings mobilisation. Complexity of various outdated procedures and the related paper-work involved in provision of credit is another issue in agricultural lending.
Rural financial markets cannot thrive and grow if their clients lack creditworthiness. The low absorption capacity of farmers, inability to repay loans, and the inability to save because their incomes are depressed, all result in low creditworthiness. Notwithstanding improvements in the information technology, banks lack essential information on the credit history of potential clients, the viability of on-farm investments, the self-financing capacity of farmers and their repayment capability. Lack of these vital pieces of information hampers the timely credit reach for agriculture and rural development.
As most of the farmers are either small or marginal in the developing countries, they lack the absorptive capacity both in terms of cost and the size of loans and advances which are of cost effective size to be handled by the banks. Since many of the financial transactions in rural areas are small -both for loans and for deposits - the transaction cost per unit of money involved is necessarily high compared to larger transactions. Most of the banks either lack risk management system or they feel it is not necessary to have one, especially when it comes to financing agriculture.
References:
Klien Brigette, Meyer Richard, Hanning Alfred, Burnett Jill and Ficbig Michael. 1999. “Better Practices in Agriculture Lending.” Agricultural Finance Revisited No.3, FAO, December.
RBI. 2004. “Report of the Advisory Committee on Flow of Credit to Agriculture and Related Activities from the Banking System.” June.
6.60 To sum up, institutional credit to agriculture has made considerable progress since the mid-1960s. The share of institutional agricultural credit in total credit to agriculture increased from 18.7 per cent in 1961 to 66.3 per cent in 1991. In particular,
Box VI.5
Agricultural Lending Practices: Cross-Country Experiences
Agricultural lending markets during the past few years have witnessed a structural change. Dissatisfaction with the outcome of traditional agricultural credit policies and the inconsistencies among these policies and a shift in the dominant development paradigm from central planning to one that relies on market forces have led to agricultural policy reassessments in many countries. In many developing countries, directed credit programmes, on account of their limited outreach and sustainability, have been phased out and many agricultural development banks have been liquidated. Further with the withdrawal of the state and donor and development agencies from agricultural and rural finance there was an urgent need to devise mechanisms that helped to deliver term finance for working capital requirements of small farmers and to provide inter-linked credit arrangements to small farmers to better orient their agricultural products to the market.
In several countries, such as Brazil, Indonesia, Mexico, and Sri Lanka, supply-led and directed credit programmes were the dominant tool used to spur agricultural development during the three decades prior to the 1990s. In centrally planned countries, directed credit was likewise a prominent instrument used to implement agricultural production plans. The assumption behind these efforts was that many farmers faced liquidity constraints that limited their ability to make farm investments and to use additional modern inputs. Relaxing these constraints by providing them with loans, therefore, was thought to be an easy way of stimulating farm investment, boosting the use of modern inputs, and augmenting farm production. Subsidies play an important role in directed credit and are, perhaps, its distinguishing characteristic. These subsidies can take the form of concessional credit. Worldwide, the switch from directed credit to financial market development is only partial.
In many countries, the Governments have tried to increase the amount of money available for investment in agriculture by introducing regulations affecting urban-based commercial banks. In these cases, banks that are normally not involved in agricultural lending are required by law to lend a fixed quota of their total loans to the agricultural sector. Either they have to allocate this fixed share of their portfolio directly in the sector or indirectly through specialised banks which on-lend these compulsory funds to the final borrower. In some cases shortfalls of commercial banks, which were not able to lend the required amount directly to the final borrower, constitute a considerable part of agricultural development banks resources (e.g., the Agricultural Bank of Iran and the Bank for Agriculture and Agricultural Co-operatives, BAAC, in Thailand in the past). Many Asian countries established portfolio allocation targets for commercial banks. In Iran and the Philippines, the target of credit allocations in the agricultural sector was set at 25 per cent, in Thailand at 20 per cent.
Directed agricultural credit programmes continue to play a strong role in some developing countries, such as the Philippines. However, in countries such as Chile, El Salvador, Indonesia, Peru, and Uganda, only a few remnants of the old directed credit approach remain. In many other countries the conversion to the new approach has been less complete. Typically, partial conversions involve interest rate deregulation and a reduction of subsidies and fewer facilities in central banks providing concessionary funds to lenders.
Since the late 1980s there has been a significant shift in the approach to agricultural and rural development from that of a strategy that was predominantly supply-led towards an approach that was more market-oriented with the aim of developing rural financial systems that were sustainable in the long run. However, often, in the formative years, its implementation had resulted in the decline of institutional credit to agriculture as most banks neither had the rural branch network nor the agricultural lending expertise to serve small farmer clients. This has resulted in agricultural credit still being heavily dependent on informal, non-institutional sources.
References :
Coleman, W.D. and Wyn P. Grant. 1998. “Policy Convergence and Policy Feedback: Agricultural Finance Policies in a Globalizing Era”. European Journal of Political Research, Vol. 34, No.2, pp. 225-47.
Klien Brigette, Meyer Richard, Hanning Alfred, Burnett Jill and Ficbig Michael. 1999. “Better Practices in Agriculture Lending.” Agricultural Finance Revisited No.3, FAO, December.
commercial banks’ credit to agriculture expanded rapidly in the early 1970s and the 1980s. Commercial banks’ credit to agriculture exhibited sluggish growth in the 1990s. However, the share of agricultural credit in total credit outstanding of SCBs showed an upturn beginning from end-March 2002, increasing from 9.8 per cent in 2002, to 10.9 per cent in 2004, to 11.4 per cent in 2006 and 11.8 per cent in 2007. Bank credit to agriculture increased sharply from 2003-04 due to the implementation of the Government policy of doubling agricultural credit and various other initiatives taken by the Reserve Bank. As a result, credit intensity of agriculture from institutional sources increased significantly from 11.3 per cent in 2000-01, to 16.3 per cent in 2003-04 and further to 31.0 per cent in 2006-07.
Box VI.6
Agriculture Credit – An International Perspective of Successful Experiences
Bank Rakyat Indonesia (BRI) is a state-owned foreign exchange commercial bank in Indonesia established with the aim of development of the agricultural sector. BRI had almost universal coverage of the country and the depth of its coverage increased with the establishment of the BRI-Unit Desai (UD), which came into existence in 1984 and as a successor to BIMAS (Mass Guidance) programme of supplying directed credit for rice cultivation. With the active backing of the Government, the BIMAS program branch units were restructured to be the Unit Desai System of BRI. Each BRI-UD was given a mandate to provide credit to rural areas on a self-sustaining basis. BRI-UD catered exclusively to micro and small customers in rural areas with the aim of running it on a commercially viable basis without any support by means of subsidy from the Government. BRI-UD became profitable within a few years of its inception and has hence become a global leader in rural financial intermediation (Yaron et al., 1997). Hence, Unit Desai system of BIMAS regime, which essentially focused on directed agricultural credit, was transformed into a broad-based rural credit institution under BRI, operating with positive lending rates, sufficient to cover operational costs and providing wide ranging financial services to the rural poor (Yaron et al., 1997). The organisation of BRI-UD enjoys a considerable degree of autonomy from its parent concern, the BRI, and is highly decentralised in its operations. The stable macroeconomic environment up to 1997 has been one of the major factors for the rapid growth of BRI-UD (Meyer and Nagarajan, 2000). High interest rate policy and high spreads between deposits and loans have been the other major factors in the success of BRI-UD. It helped the bank to cover the costs of servicing small loans and deposits and subsequently enabled the bank to depend less on subsidy for daily operations. Hence, even though the very small deposits earn no interest, the availability of well-designed and attractive saving products were instrumental in the high level of coverage of rural poor by the BRI-UD (Yaron et al., 1997).
The Bank for Agriculture and Agricultural Cooperatives (BAAC), a Government owned institution, in Thailand is a pioneering example among rural agricultural finance institutions. The BAAC was constituted to provide credit exclusively to the agricultural sector and replaced the Bank of Cooperatives. BAAC provides credit both directly and through agriculture cooperatives and farmers’ associations at interest rates below the market rate. However, since 1999, as part of efforts at reforming the Bank’s interest rate policy BAAC started to follow a policy of charging a minimum lending rate, irrespective of the loan size and borrowers with good performance and track record were given preferential interest rates (BAAC, 2004). Commercial banks that are unable to meet the statutory minimum lending of 20 per cent of their funds to agriculture are required to park their funds with BAAC and the administrative cost of maintaining these funds is borne by the commercial banks.
Since 1998, BAAC has been following a policy of decentralisation of its banking operations resulting in a substantial increase in the number of field offices and branches. Each BAAC branch since 1994 has been organised as a profit centre and return on assets (ROA) is now taken as a major yardstick for branch performance. Significantly, the portfolio of loans of BAAC is predominantly long-term in nature and BAAC has an unparalleled coverage of around 92 per cent of total farm households in Thailand (BAAC, 2004). Of late, BAAC has been diversifying its operations to become a rural bank offering a host of services from its traditional role of an agricultural lending bank. Successful human resource management has been identified as the key to BAAC’s success coupled with the stress on financial sustainability and a robust management information system (Murakai et al., 1998).
References:
BAAC . 2004. “How Can Public Bank Contribute to Outreach in Rural Areas?” Paper presented by Mr. Supachai Sathakarn, BAAC Senior Vice-President at Regional Symposium of The 48th Asia-Pacific Rural and Agricultural Credit Association(APRACA) Ex-Com Meeting, 10 October 2004, Tehran, Iran.
Meyer, Richard. L. and Geetha Nagarajan .2000.“Study of Rural Asia: Volume 3: Rural Financial Markets in Asia: Policies Paradigms, and Performance.” Asian Development Bank, published by Oxford University Press for ADB. Muraki, Tetsutaro et al., 1998. “The Thai Bank for Agriculture and Agricultural Cooperatives”. Case Studies in Microfinance, Sustainable Banking with the Poor, World Bank, Asia Series. Yaron, Jacob et al., 1997. “Rural Finance: Issues, Design and Best Practices.” Environmentally and Socially Sustainable Development Studies and Monographs Series, No. 14, Rural Development, World Bank.
6.61 Notwithstanding the recent improvement in the extension of credit to agriculture some disconcerting features were also noticed. First, the share of long-term loans in total agricultural credit declined during the 1990s as well as the current decade. Both demand side as well as supply side factors led to this decline. Second, the share of marginal farmers in direct finance to farmers, in terms of loans disbursed and number of loan accounts, showed little perceptible improvement. Third, the share of small borrowal accounts (up to Rs.2 lakh) also declined during the current decade even after adjusting for inflation.
6.62 An antiquated legal framework and outdated tenancy laws have hampered the flow of credit and development of strong and efficient agricultural credit institutions. Banks, on their part, need to make a better analysis on where the risks are in the extension of agricultural credit, and then find market-oriented solutions for mitigating such risks. Banks need to adopt a more specialised approach as between different agricultural sectors and regions in order to achieve a better understanding of agricultural credit needs and risks on a disaggregated basis. A comparison of commercial bank credit to agriculture in India with that of other countries shows that bank credit to agriculture as percentage of total bank credit in India was on the higher side. However, credit intensity of agriculture in highly commercialised agricultural systems such as New Zealand, Australia and the UK, among others, was significantly higher than that in India. A review of the cross-country experiences suggests that the absence of effective credit-delivery systems and lack of adequate credit absorptive capacity of the rural population are the two major factors that hamper the smooth flow of credit to agriculture. Till the 1980s, several developing countries followed largely ‘supply-side’ oriented directed credit programmes. However, owing to the disappointing results of supply-led approach, agriculture and rural banking institutions in some countries such as Indonesia and Thailand have moved on to a demand-centric approach under which stress is on a combination of attractive savings and loan products suited to meet the specific needs of the rural poor coupled with the efficient risk management practices. This concept also emphasises viability of banking institutions.
V. CREDIT TO INDUSTRY
6.63 The banking system in India has been actively involved in financing various sectors of the economy, of which, financing of industry, in general, and SMEs, in particular, has been of high significance. Banks have, historically, financed short-term working capital requirements of industry, while long-term funding requirements were met by development finance institutions (DFIs), the initiation of which dates back to as early as 1947 when the Industrial Finance Corporation of India was established exclusively to extend term loans to industry. This was followed by the establishment of several DFIs, both in public and private sectors. However, with the initiation of financial sector reforms in the early 1990s to promote a competitive environment in the financial sector to enhance the allocative efficiency of resources, the industrial finance structure has changed with the conversion of two major DFIs into banks.
6.64 The compound annual growth of credit by scheduled commercial banks to industry, which grew by 17.4 per cent during the 1980s, decelerated to around 15.4 per cent during the 1990s. In the current decade, the credit to industry grew at a moderate pace up to 2003-04, but accelerated sharply to 33.5 per cent in 2004-05 and remained high at 31.0 per cent in 2006-07 (refer Table 6.1).
6.65 The overall deceleration in bank credit to industry in the 1990s was on account of industry’s increased reliance on other sources of funding, especially the equity market in the first half of the 1990s. However, bank credit to industry accelerated in the current decade (2000-01 to 2005-06) even as the corporate sector reduced its reliance on the external sources. The share of internal sources, which averaged 34.1 per cent during 1985-86 to 1990-91, increased to 56.1 per cent during 2001-02 to 2005-06. Within external sources, the share of bank credit increased sharply. As the economy develops, large corporates are in a position to raise resources from the domestic and international capital markets. It is, therefore, natural that the corporates reduce their dependence on the banking sector. This trend, observed in the 1990s, was reversed in the current decade (Table 6.8).
6.66 The share of credit to industry in total bank credit declined over the years. Also over the years, the share of industry in total GDP declined. As a result, credit intensity of industry increased in recent years. One of the reasons for increased credit intensity was increased dependence of corporates on banks for funding their medium to long-term requirements. The industrial sector accounted for 53.0 per cent of total bank credit in 1990-91 as against its share of 22.0 per cent in the GDP. However, by end-March 2007, the share of bank credit to industry declined sharply to 36.2 per cent, while its share in GDP declined marginally to 20 per cent. As a result, credit intensity of industry (credit to industry as percentage of sectoral GDP) increased from 55.7 per cent in 1990-91 to 90.0 per cent in 2006-07 (Chart VI.19).
6.67 With the conversion of two major DFIs into banks in the first half of the 2000s, banks increasingly stepped up the medium to long-term funding requirements of industry (including infrastructure) (RBI, 2007a). Accordingly, in recent years, the
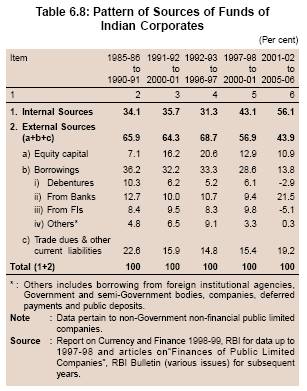
proportion of long-term credit extended by the SCBs to industry increased sharply from 11.6 per cent at end-March 1995 to 44.1 per cent by end-March 2007
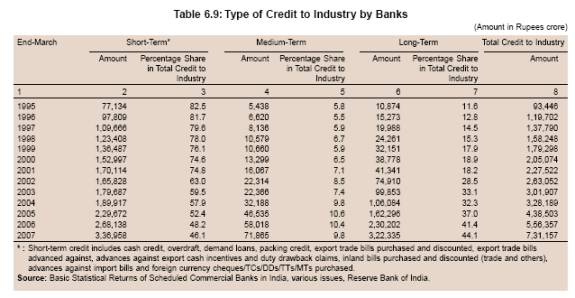
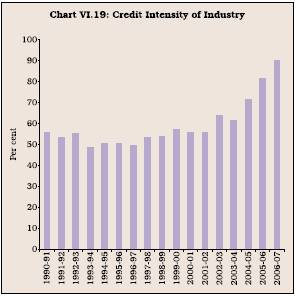
(Table 6.9). As a result, the share of short-term loans to industry in total short-term loans by banks declined between 1995 and 2007, while that of medium and long-term loans increased (Table 6.10).
6.68 With the development of alternative sources of funds, the reliance of industry on commercial banks for meeting their credit requirements declines, as alluded to earlier. A survey of select countries shows that the share of bank credit to industry has declined
since 1991 in all countries in the sample studied, barring Thailand in which it increased marginally. Significantly, the share of credit to industry in India in 2007 was the highest among all countries (Table 6.11). This was despite the fact that the share of the industrial sector in GDP in these countries was significantly higher than that of India. This suggests that corporates are still heavily dependent on the banking sector in India in comparison with other countries. The dependence increases further if banks’ support to industry in the form of non-traditional investments (investment in shares/debentures) is also taken into account. For instance, banks’ investment
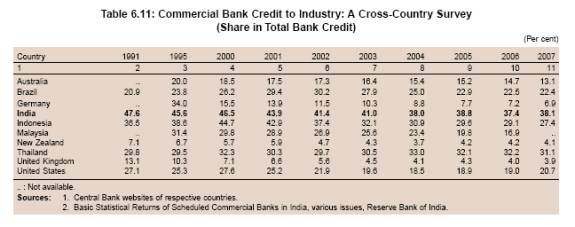
in the instruments of commercial papers, corporate bonds, equities increased during the second half of the 1990s, although such investments declined somewhat from 2000-01 onwards.
6.69 A cross country survey revealed that credit intensity of industry (industrial credit to industrial GDP ratio) in India was the highest among the select countries studied. Also, in contrast to most other countries, credit intensity of industry in India increased significantly in recent years (Table 6.12).
Bank Lending to Small and Medium Enterprises (SMEs)
6.70 SMEs constitute an important segment of the industrial and services sectors of India due to their growth potential, employment generation capacity, export generation and their role as seedbed to new entrepreneurship. The contribution of SMEs in the Indian economic development has been immense. Their share was over 40 per cent of total value added in the economy. It is significant to note that about 33 per cent of total exports are generated by small scale industries (SSIs).
6.71 The development of the small scale sector has been an important plank of India’s industrial policy. SSIs in India have been given a distinct identity and the Government has accorded high priority to this sector on account of the vital role it plays in balanced and sustainable economic growth. SMEs are typically much more informationally opaque than large corporations because they often do not have certified audited financial statements to yield credible financial information on a regular basis. Moreover, these firms usually do not have publicly traded equity or debt, yielding no market prices or
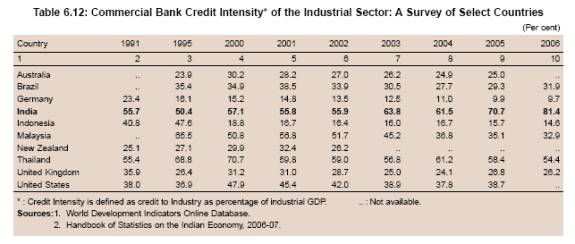
public ratings that might suggest their quality (Berger and Frame, 2005). Modern development theories increasingly emphasise the key role of inadequate access to finance which leads to slower growth of these firms (World Bank, 2008). The major problems faced by the SSI sector relates to non-availability of loan without collaterals, delay in getting the loan, high cost of funds, delayed payments, marketing problems and sickness among others. Lending to the SME sector, therefore, has necessitated some kind of institutions in many countries.
6.72 In India, an enunciation of the need to channel the flow of credit to certain sectors, in the larger interest of the economy, can be traced back to the Reserve Bank’s credit policy for the year 1967-68. Subsequently, the nationalisation of major banks in 1969 signalled the need for redefining the lending priorities. Thus, the concept of priority sector lending was evolved to ensure that assistance from the banking system flowed in an increasing measure to the vital sectors of the economy and according to national priorities (RBI, 2007b). In the 40 per cent mandated target for banks for the ‘priority sector’, the SSI sector was also included.
6.73 There have been several disconcerting features of credit flow to the small scale industries sector in recent years as is evident from the various indicators. First, the average annual growth of SSI advances decelerated to 7.2 per cent during 2000-2005 from 13.1 per cent during the 1990s. The growth rate picked-up to 22.3 per cent in 2005-06 and 29.2 per cent in 2006-07. The SSI sector’s share in credit to industry declined significantly, which itself has also declined. As a result, the share of credit to the SSI sector in total credit declined sharply (Table 6.13). Second, the share of the SSI sector in total priority sector advances declined steadily from 43.7 per cent at end-March 1998 to 17.9 per cent at end-March 2006. It picked up marginally to 18.6 per cent at end March-2007. Though the decline in the share of the SSI sector in total priority sector advances was across the bank groups, it was much sharper in the case of private sector banks; from 55.4 per cent as at end-March 1996 to 43.6 per cent as at end-March 2000 and to 9.1 per cent as at end-March 2007. During the same period, the share was 42.4 per cent, 36.1 per cent and 20.1 per cent, respectively, for public sector banks. Inclusion of new sectors in the priority sector domain could be one of the reasons for the drastic fall in the share of the SSI sector in total priority sector lending. Third, the share of credit to the SSI sector in non-food bank credit declined from 15.1 per cent in 1990-91 to 6.5 per cent in 2006-07. SSI advances by public sector banks as percentage of net bank credit declined to 8.0 per cent at end-March 2007 as compared with 8.1 per cent at end-March 2006 and 9.5 per cent at end March 2005. In the case of private banks, it declined to 3.9 per cent from 4.2 per cent and 5.4 per cent, respectively, during the same time period. Fourth, although credit growth to the SSI sector accelerated in 2004-05 to 2006-07, the share of SSI credit in total non-food gross bank credit and in total credit to the industrial sector remained almost stagnant (Chart VI.20). Fifth, the number of loan accounts of the SSI sector with scheduled commercial banks declined from 5.8 million at end-March 1992 to 2.2 million at end-March 2006 and further to 1.9 million at end-March 2007.
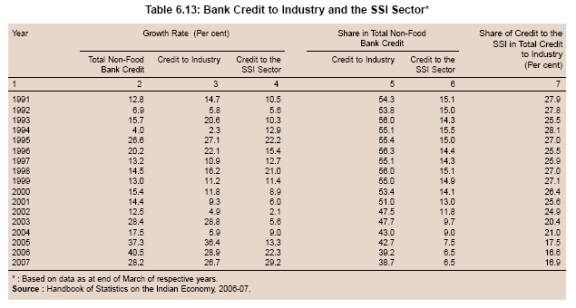
6.74 The main reason for the slowdown of credit to the SSI sector was its poor performance and consequent risk aversion by banks. The activity of the SSI sector slowed down significantly between 1997-98 and 2002-03 with the value of production growing at an average annual rate of 7.7 per cent as compared with 11.1 per cent in the 1980s. The poor performance of the SSI sector was also reflected in the significantly higher level of NPAs in this sector (Table 6.14). Banks,
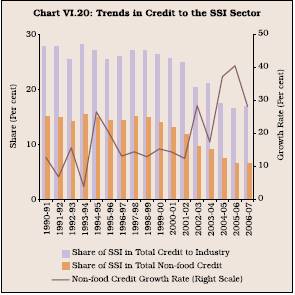
therefore, became somewhat risk averse and reduced their exposure to the SSI sector (RBI, 2007a).
6.75 In recent years (i.e., from 2003-04 to 2006-07), the performance of the SSI sector has improved. Accordingly, NPAs in the SSI sector have also declined significantly. This was reflected in the improved flow of credit to the SSI sector during the period 2004-07. As a result, credit intensity of the SSI sector, after declining almost consistently between 1997-98 and 2004-05, increased somewhat in 2005-06 and 2006-07 (Chart VI.21). The credit to the SSI sector, to an extent, does not give a true picture as different banks appeared to have followed different definitions of the SSI sector. The definition of small and medium
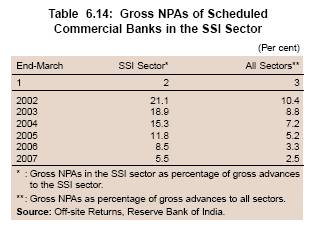
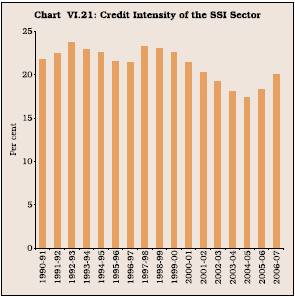
enterprises has now been clearly laid down in the Micro, Small and Medium Enterprises Development Act, 2006. Therefore, it is expected that there would be an improvement in the data reporting and the proper assessment of credit to the SME sector.
6.76 The analysis of bank group-wise credit to SMEs revealed that credit disbursement from all bank groups, both as percentage of credit to industry and percentage of total credit, experienced a sharp decline during the period 1996-2007 (Table 6.15 and Chart VI.22). The share of the SME sector in credit to industry, which was 25.9 per cent at end-March 1997, declined to 16.9 per cent by end-March 2007. The
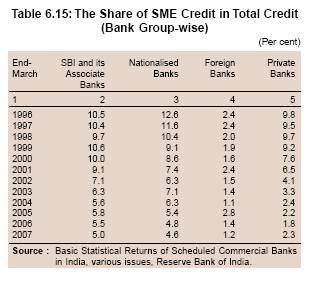
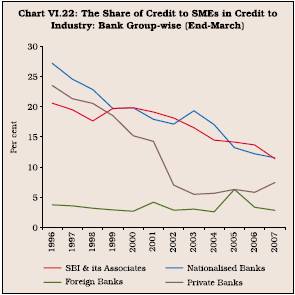
decline was sharper in the SMEs’ share in total bank credit. Though the decline was noticed across all bank groups, it was more pronounced in the case of private sector banks. Of all the bank groups, the share of the SME sector in credit to industry was the lowest in the case of foreign bank group (Chart VI.22).
6.77 Growth in credit extended by scheduled commercial banks to industry, which had decelerated in the 1990s in comparison with the 1980s, accelerated in the current decade. This, to an extent, was due to increase in the share of medium and long-term loans. As a result, credit intensity of industry increased significantly in recent years. Notwithstanding the decline in the share of industry in the overall bank credit, it continued to rely heavily on the banking sector, which was one of the highest in select countries studied. Credit to the SSI sector decelerated sharply in the latter part of the 1990s and the initial years of the current decade. The credit growth to the SSI sector was particularly low between 1999-2000 and 2003-04. However, as a result of the efforts of the Reserve Bank and the Government, the credit growth to the SSI sector started picking up from 2004-05 and grew at a robust pace during 2006-07.
Issues in Lending to the SME Sector and the Measures Initiated
6.78 The institutional credit extended to SMEs has gone down in relation to credit to industry and other sectors as was borne out by the analysis earlier in this section. The problem on the supply side has been the reluctance on the part of banks to lend to SMEs, except against secur ities or against hypothecations of plant and machinery that are disproportionate to the value of the loan. Other bottlenecks, according to a FICCI survey (2004), include delays in loan approval, sanction and disbursal, lack of information and transparency, centralisation of authority in bank headquarters and poor collateral security norms. These problems are reflected in the SMEs’ share in non-food bank credit, which declined from 15.1 per cent at end-March 1991 to 6.5 per cent at end-March 2007. SMEs have historically faced significant difficulties in accessing funding for creditworthy projects. One of the most common complaints by the potential lenders is lack of reliable information about them (Box VI. 7).
6.79 The SMEs are generally proprietary concerns and this may have also impeded the smooth flow of institutional credit to SMEs. The share of proprietary concerns in the ownership of SMEs increased sharply from around 61.0 per cent in 1972-73 to around 95.8 per cent in 2001-02 as per the Third All-India Census of SSIs conducted in 2001-02. On the other hand, the share of partnership concerns declined from 35.0 per cent in 1972-73 to around 1.9 per cent in 2001-02 (Table 6.16). The proprietary concerns have limited credit history or only the credit history of their owners on the basis of which banks can determine their lending decisions. Therefore, the change in the ownership pattern appeared to have affected the access to credit by SMEs.
6.80 During the post-reform period, cost of funds for the SME sector also went down in line with the general decline in interest rates for various sectors of economy. Benchmark prime lending rate and interest rates charged to various sectors have tended to converge over the years (Chart VI.23). However, large corporates are able to negotiate fine rates with banks and are able to bring down their overall interest costs. In addition, large corporates have the option of accessing the domestic and international capital markets for funds. The burden of adjustment has, therefore, fallen on SMEs, which have limited access to funds. The high interest rates paid by SMEs may not always be in accordance with their risk profile (Mohan, 2004). It may be noted that in recent years there has been a decline in interest rates to the SME sector. This may be on account of policy initiatives taken and better assessment by the banks of the risks in this sector.
Box VI.7
Difficulties Faced by the Banking Sector in Extending Credit to SMEs
The difficulties faced by the banks in extending credit to SMEs mainly stem from informational opacity and lack of credit history. Unlike large corporations, small businesses are typically much more informationally opaque, because they often do not have certified audited financial statements to yield credible financial information on a regular basis. Also, these firms usually do not have publicly traded equity or debt, yielding no market prices or public ratings that might suggest their quality.
High-risk perception associated with small-scale sector stems from a number of factors such as weak financial strength, inability to provide adequate collateral and other factors. Inability to properly appraise the new projects, new firms and new activities by bankers often results in banks shunning a small borrower. To a greater extent, as the banks are not able to assess the actual or potential risks about the borrower from the SME sector, there is likelihood that banks may arrive at a wrong perception about the borrower.
Asymmetric information about the business prospects of small scale projects and financial standing of the small borrowers arises because small-scale borrowers generally do not have a well-documented credit history. As a result of asymmetric information and high-risk perception, banks rely heavily upon the collateral-based lending rather than cash-flow analysis
while working with small-scale sector borrowers. Although there is a threshold up to which bankers should not insist on collateral, they seldom assume the risk involved in non-collateralised lending. The surveys conducted by the Reserve Bank revealed that many bank branches insisted on collaterals even for loans up to Rs.5 lakh.
Moral hazard problems are associated with the possibility of small scale sector diverting funds to alternative projects or they develop the propensity to take excessive risks. Also, owing to the small amounts of each loan, the aggregate costs of information gathering, due diligence, loan processing and monitoring are much higher than for loans to large corporate borrowers. Therefore, financial institutions charge relatively higher interest rates to small scale sector than to larger companies in order to compensate for the higher costs of information collection, the smaller volume of external financing and perceived greater credit risk.
Other reasons often stated by banks for the weak growth of SME credit are (i) the large number of unregistered enterprises, which require different lending and risk management techniques, processes, and skills; (ii) lack of a secured transactions law to regulate assignment and registry of movables; and (iii) the difficulty and high cost of registering property and enforcing contracts.
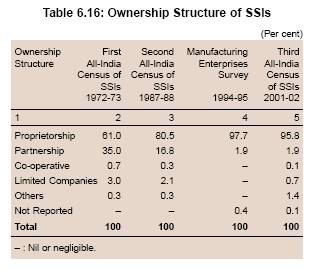
6.81 The key issue in improving the credit flow to the SME sector is to enable the banking institutions to improve their credit assessment capabilities with regard to small scale enterprises so that they can distinguish adequately between good and bad credit. Small scale must not be equated with high risk. It, therefore, was considered necessary to undertake measures for smoothening the flow of credit to this sector. Accordingly, various policy initiatives were undertaken to address the issue of paucity of credit to SMEs (Box VI.8).
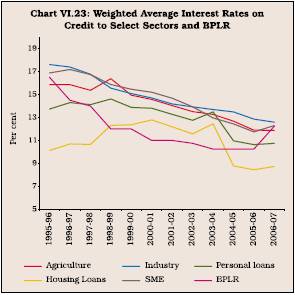
Box VI.8
Initiatives to Improve the Credit Flow to SMEs
Recognising the importance of the SME sector, the Government of India and the Reserve Bank had constituted several committees and working groups, viz., Nayak Committee (1992), Kapoor Committee (1992), S. P. Gupta Working Group (2000), Ganguly Committee (2004) and Murthy Group (2005). These Committees/Groups have made several recommendations for improving the credit flow to the SME sector. On the recommendations of these Groups, several policy actions were taken.
In 2006, the Parliament enacted Micro, Small and Medium Enterprises Development (MSMED) Act, 2006. The Act lays down definition and framework for SMEs in India. The Act has removed distortions which create perverse incentive for small business to remain small and not move/graduate to medium sized firms, reaping economies of scale and contributing growth and employment.
The past approach based on preferential treatment of SSIs and targeted loan at subsidised interest rates is being changed. The artificial barriers to entry and regulated credit market are not suitable for optimal size and efficiency of SSIs. The Government has pruned a number of items from the list of products reserved for SSIs to infuse competition and provide incentive to small firms to grow organically and reap benefits of scale.
To strengthen the framework for tackling loan defaults and contract enforcement, the Parliament enacted the Securitisation and Reconstruction of Financial Assets and Enforcement of Security Interest (SARFAESI) Act, 2002.
As better information can directly increase the financing for SMEs by reducing the cost and risk arising from information asymmetries, the Parliament also enacted Credit Information Companies (Regulation) Act, 2005. The Act has strengthened the legal mechanism. The credit information companies can also be set up to collect, process and share credit information on the borrowers of the banks and financial institutions.
A debt restructuring mechanism for nursing of sick units in the SME sector and a one-time settlement (OTS) scheme for SME accounts in the books of banks as on March 31, 2004 were formulated and advised to all commercial banks and public sector banks, respectively, for implementation.
The Reserve Bank has constituted empowered committees at the Regional Offices to review the progress in SME financing and rehabilitation of sick SSI and SME units, and coordinate with other banks/financial institutions and the State Governments in removing bottlenecks, if any, to ensure smooth flow of credit to the sector. These regional level committees may decide the need to have similar committees at cluster/district levels.
Box VI.9
Lending to SMEs – Recent Initiatives taken by Banks in India - A Brief Survey
State Bank of India has adopted a cluster financing approach through its Project Uptech, where the units from similar industry are identified for process improvement. This means that units, which come forward to adopt innovations, get financial assistance for upgradation costs. ICICI Bank has introduced a simplified loan product, an unsecured loan up to Rs 25 lakh for the SME sector. This is ideal for promoters with big ideas and little collateral security. SMEs can also apply for loans through the bank’s website now. Another service in the pipeline is the roping in of legal and taxation experts as channel partners whose services SME units could utilise.
Oriental Bank of Commerce (OBC) is in the process of setting up a specialised cell for the SME sector. Apart from processing and imparting loans for this sector, the cell would carry out marketing activity and follow up loan cases for customers of SMEs. The cells would be set up at all the 29 OBC regional centres across the country. Standard Chartered Bank has a separate business unit called Standard Chartered Investment & Loans Ltd. (SCILL) operating currently in 16 cities. The bank has drawn up a road map to extend SCILL’s network to 60 cities. HSBC is offering mass-banking service through its 21 branches in 16 cities across the country. The minimum income level required for getting a loan from HSBC is just Rs 3,500 per month for salaried employees and Rs 10,000 per year for the self-employed. Understandably, risk management for this sector is a huge issue with banks. Credit Rating Information Services of India Ltd. (CRISIL) has stepped in to provide a rating service for the SME sector. According to this rating programme, SMEs would be rated on a scale of one to eight, with scale one indicating the highest credit quality and the scale eight, hinting at default possibilities. The ratings assigned to SMEs would also function as a self-improvement tool for them. SBI, ICICI Bank and Standard Chartered Bank have joined hands with the Small Industries Development Bank of India (SIDBI) and have floated a rating agency for the SME segment. The rating agency, Small and Medium Enterprises Rating Agency of India Limited (SMERA), will rate the company’s overall strength; unlike most rating agencies whose core business are to rate debt instruments.
Source : SME Rating Agency of India Ltd. at http:// www.smera.in
6.82 In the recent period, a number of initiatives have been taken by banks in India to improve the credit flow to the SME sector (Box VI.9).
6.83 With the introduction of Basel II capital norms, the question arises whether banks would tend to behave differently from the past. Literature amply suggests that internationally, banks responded to the change in capital ratios (Basel I) either by mere cosmetic changes in the form of reducing the total assets growth or by exploiting differences between capital as measured for regulatory purposes and the bank’s true economic capital. Empirical studies also underline the fact that banks have responded to the change in regulations by reducing their risk exposure. This was done by perhaps refusing to make new loans, while allowing their loans to be repaid (Nachane et al., 2001). Some studies conducted during the late 1980s and the 1990s concluded that supply of loans to the SME sector declined due to regulatory capital requirements (Nachane et al., 2001). Berger and Udell (1994) and Wall and Peterson (1995) found that banks in US in the early 1990s, subject to a formal regulatory mandate to increase their capital ratios, reduced their loan portfolios significantly. However, the likely impact of Basel II norms on lending to the SME sector is not clear at this stage (Box VI.10).
Financing of SMEs – Cross-Country Experiences
6.84 The analysis of types and sources of financing and the policy approaches followed by different countries around the world suggests that the SMEs typically finance their operations quite differently from large corporations. SMEs do face severe problems in obtaining financial support from the organised sector in most of the EMEs. However, SMEs, still, both in developed and developing countries, depend on the banking system a great deal for their financing needs (Box VI.11).
6.85 While many country-level and microeconomic studies have assessed the importance of SMEs in the economic development and industrialisation process, lack of reliable cross-country data have impeded a rigorous cross-country analysis so far. However, various surveys of firms, viz., the Regional Program on Enterprise Development (RPED) studies for sub-Saharan Africa in the 1990s, Business Environment and Enterprises Performance Surveys (BEEPS) for the transition economies, the World Business Environment Survey (WBES 1999-2000) and the Investment Climate Survey (ICS 2002) over the past 10 years have expanded the information available about financing patterns of and access constraints on small firms and even micro-enterprises
Box VI.10
Basel II and Lending to the SME Sector – Banks’ Behaviour
Since most of SSI sector firms are proprietorship firms and run on family-based management, the SMEs generally have no or very short credit history which makes it difficult for the banks to accurately assess and rate the credit risk. Banks with an excellent data about their clients will be able to assess their risks more accurately and accordingly provide the capital. However, the basic rule will remain the same that higher the risk, lesser the banks’ preference to lend to the sector if the banks are risk averse.
Under Basel II, banks will have the option of calculating their credit risk (and, hence, minimum capital requirements) either using a standardised approach or an internal ratings based (IRB) approach. With respect to SME loans in particular, banks will also have the option of including their SME exposures as part of a retail portfolio (subject to certain conditions) or in a commercial portfolio. Depending on as to which option is chosen, the risk weighting attached to SME exposures will vary and, by implication, the amount of capital that a bank has to have will also vary.
A survey reported that larger banks that can afford to have sophisticated risk measurement techniques will have lower minimum capital requirements. Further, it pointed out that it is possible there may be a scope for increasing the supply of lending to SMEs and/or reduction in margins (as banks more closely align interest rates with economic cost). Those banks which successfully employ the IRB approach should, in theory, be better placed to avoid over-pricing good risks and under-pricing bad risks. It follows that there may, therefore, be some migration of higher risk SME loans to those banks which do not adopt the IRB approach and which, by implication, rely on less sophisticated and more standardised measures of risk.
However, unless a detailed study is conducted to understand the potential impact on the banks’ lending of Basel II, it would be difficult to indicate as to what would be the impact of Basel II norms on lending to SME sector. It is necessary to work on to establish the relationship between the probability of default and the amount of capital that a bank must hold under the IRB approach. One more possibility is that the major banks may consider that they are pricing the loans according to the true risk of exposure. Therefore, any enhanced sensitivity of regulatory capital requirements to risk may be doing nothing more than aligning the regulatory environment with current practice.
The introduction of Basel II is not being perceived by the banks as an impediment to lending to SMEs (or other customer groups) and, indeed, may be being perceived as ratifying current practice. The small size of SMEs means that the information asymmetry problem may be more acute for this segment of the market. In the SME market, the use of collateral is a particularly important feature and therefore, the likelihood of a decline in the flow of credit to SMEs on a large scale is not likely.
In the Indian context, a number of committee reports and studies have pointed out that there are some specific segments of the SME market where banks are reluctant to provide loans. This is more because banks perceive them as high risk areas. This perception may or may not be true in the actual scenario. In the backdrop of the new Basel II agreement, banks have been stated to be changing their behaviour and concentrating more towards assessing the relative riskiness of their clients. To estimate the risk of their client firms, banks need more information than before. SMEs that can prove that they are stable can expect to benefit with lower interest rates and better access to loans.
References:
Ghosh, Saibal, D M Nachane, Partha Ray. 2004. “Behaviour of Bank Capital: Issues and Evidence from India”. EPW, March.
Sen, Sunanda, Soumya Kanti Ghosh. 2005. “Basel Norms, Indian Banking Sector and Impact on Credit to SMEs and the Poor”. EPW, March.
across countries. These surveys did show that more than 40 per cent of large firms use external finance, in comparison with just over 20 per cent small firms. For financing new investments also, small firms use only 15 per cent from external sources, while large firms finance 30 per cent from external finance. Beck T. and Asli Demirguc-Kunt (2005) observed that size, ownership and age of the firms were the most reliable predictors of firms’ financing. They found that older, larger and foreign-owned firms report lower financing obstacles. From this follows the corollary that smaller and relatively newer firms face considerably higher financing obstacles. Data also show that small firms finance a smaller share of their investment with formal sources of external finance (Beck et al., 2003). Globally, while finance is identified as the second leading constraint by SMEs, for large enterprises, it ranks fourth (Batra et al., 2002). Internal funds were the main source of financing for SMEs across the countries.
6.86 As per the WBES Survey, the financing constraints faced by the percentage of firms were lower in OECD countries and East Africa and China as compared with other regions. While maximum percentage of firms in Latin America, South Asia and Africa rated high interest rates as the major constraint, firms in East Africa and China did not face this as a major constraint. Lack of access to long-term loans was another major financing constraint cited by more than 50 per cent of the surveyed firms in all the regions, except OECD countries and East Africa and China. Collateral requirement also acted as a major financing constraint in almost all the regions (Table 6.17).
Box VI.11
Financing of SMEs: Experiences of Advanced and Emerging Economies
Developed countries have larger SME sectors in manufacturing in terms of their contribution to total employment and to GDP (World Bank, 2005). Studies also show that SMEs in developed countries have better access to institutional finance as compared to those in developing countries. Even in their early stages of development, institutional credit support for SMEs was robust in the developed countries. Cull, et al. (2005) explored the financing patterns of SMEs in the core North Atlantic Economies during the 19th and early 20th centuries and they found that the main institutions associated with modern finance – banks and securities markets – were of marginal significance to SMEs, but an impressive variety of local institutions emerged to cater to their financing requirements. These intermediaries took different forms. For instance, they functioned as notaries in France and cooperative institutions in Germany. Significantly, most of these institutions were demand driven and were established through private initiatives. While governments played a little role in creating these institutions, they allowed their emergence through a generally permissive regulatory environment.
In the US, depository institutions – commercial banks, thrift institutions (savings bank and savings associations) and credit unions – and non depository institutions* are the suppliers of financial services to SMEs. In 2003, depository institutions were used by 96 per cent of all surveyed firms - the same as was in 1998 (Fed Survey, 2006). Among depository institutions, use of commercial banks was highest, i.e., 87 per cent. The percentage of firms using commercial banks increases as firm size increases.
European Network for Social and Economic Research (ENSR) Enterprise Survey 2003 and SME Access to Finance Survey 2005 analysed the financial access and constraints faced by SMEs in European Union. According to the Survey 2003, 13 per cent of the SMEs considered access to finance as a major barrier, though the majority considered lack of skilled labour as major constraint. However, majority of European SMEs depend on bank financing and there seems to be a lack of alternative financial source. In most of the member states these enterprises use bank finance, i.e., overdrafts and bank loans. But leasing also constitutes an important source of finance. In Spain, France, Luxembourg, the Netherlands and Portugal, leasing is used more often than overdrafts. Factoring is also an important source in France.
The funding of SMEs has a number of specific features. In France, SMEs generally rely heavily on bank financing, whereas large firms can directly access capital markets. According to ENSR Enterprises Survey 2003, smaller firms use relatively more bank financing than larger enterprises. Approximately 80 per cent of all enterprises have at least one credit line. Significant differences in the use of bank credit persist among countries. In some countries such as Ireland and Iceland, almost every SME (95 per cent and more) has one or more credit lines, whereas in other countries such as Finland, this applies to about 70 per cent of SMEs.
Often the problem of inadequate information is mentioned as one of main aspects hampering bank finance to SMEs, even among the developed countries. The balance sheet and profit and loss account (60 per cent) are the most commonly requested documents by banks.
Lending to SMEs is by and large based on collateral than it is for larger enterprises. The most common requirement for bank financing even among the developed countries are collateral. The real estate is most common collateral, followed by personal/private savings book. Inventories are generally not accepted as collateral. In recent years, SMEs’ access to bank financing has become reasonably easy.
Among the EMEs, Malaysia is one of the leading economies in the promotion and development of SMEs. In Malaysia, most of the SMEs use their own internally generated funds and funds sourced from friends and family members to finance their business operations. In contrast to 50 per cent large companies, only 16 per cent of SMEs indicated their reliance on financing from financial institutions (commercial banks and development finance institutions). Indeed only 10 per cent of micro enterprises depend on external source of finance. According to the Census of Establishment and Enterprises 2005, lack of collateral was the most important obstacle faced by SMEs while seeking financing from banking institutions. This was followed by insufficient loan documentation and lack of financial track record, as well as financial viability. The main types of credit facilities utilised by SMEs are short-term and long-term loans, as well as leasing. Malaysia has set up dedicated development finance institutions to accelerate the growth of strategic sectors identified by the government, viz., SME Bank, EXIM Bank, Malayasian Industrial Development Finance (MIDF), Bank Pertanian Malaysia and Bank Pembabgunan Malaysia Berhad for high technology and Information Communication Technology (ICT) companies. Besides there is Credit Guarantee Corporation Malaysia Berhad (CGC) as Malaysia’s primary guarantee provider to SMEs with insufficient collateral to obtain credit from banking institutions.
In Indonesia more than 70 per cent of micro, small and medium enterprises (MSMEs) are inherited from parents. More than 70 per cent of business capital of micro-enterprises and 65 per cent of capital for small-scale businesses is raised through self-financing. Although it is claimed that there is need for finance but not all MSMEs submit for credit applications. Reasons cited include lack of collateral (for micro-enterprises) and high interest rate (for small and medium enterprises).
References:
Batra, Geeta, Daniel Kaufmann, Andrew H. W. Stone. 2002. “Voices of the Firms 2000: Investment Climate and the Governance Findings of the World Business Environment Survey.” The World Bank Group.
Beck Thorsten, Asli Demirguc-Kunt, 2005. “Small and Medium-Size Enterprises: Overcoming Growth Constraints.” The World Bank Group, February.
Cull Robert, Lance E.Davis, Naomi R. Lamoreaux, Jean-Laurent Rosenthal, 2005, “Historical Financing of Small and Medium-Sized Enterprises”. NBER Working Paper Series, October.
6.87 A cross country analysis of the investment financing pattern of SMEs conducted in 2000 shows that firms in Latin American countries used external finances ranging between 43 per cent in Argentina to 57 per cent in Chile. Among the external sources of financing, commercial banks had a predominant share in most of the emerging economies, except China. In the case of developed countries, equity finance also constituted an important source of external finance (Table 6.18). In Poland and Germany, equity finance was considerably high at 27.6 per cent and 23.1 per cent, respectively. Informal sector’s (moneylenders) share in financing varies from 5.9 per cent in China to zero per cent in Indonesia.
6.88 To sum up, various indicators, such as share of credit to the SSI sector in credit to industry and total credit, decline in credit intensity of the SSI sector, decline in SSI’s share in the priority sector lending, indicate that policy initiatives to improve the flow of credit to the sector have not been very successful. There are many conventional explanations for tepid growth of credit to SMEs, viz., lack of sufficient collateral, opacity in operations, dominance of proprietorship pattern of ownership and lack of credit history because most of the firms are young. Lack of appropriate collateral with the SMEs appears to be one of the major reasons for the slow credit growth to the SME sector. In recent years, banks have increased their exposure to the infrastructure and the retail sectors. Availability of superior quality of collateral with industry, individuals and the retail sector could be one possible explanation for this shift in the lending pattern of the banks. However, it also points towards a bigger and more critical problem of the credit appraisal system, i.e., lack of adequate risk assessment techniques. Finding new entrepreneurs, new ideas, new products and new services to finance need greater effor t and more sophisticated risk management system. Indian banks are handicapped by absence of centralised information and record management system for small and medium enterprises (Mohan, 2008). As the Credit Information Companies Act has already been enacted and the necessary guidelines in this regard have also been laid down by the Reserve Bank, it is expected that the setting up of credit information companies would help mitigate the problem.
6.89 SMEs in both developing and developed economies depend heavily on the banking sector for their financing needs. Irrespective of the level of development, the major hurdle faced by SMEs is lack of collateral and insufficient information. Various cross country surveys suggest that high interest rates, lack
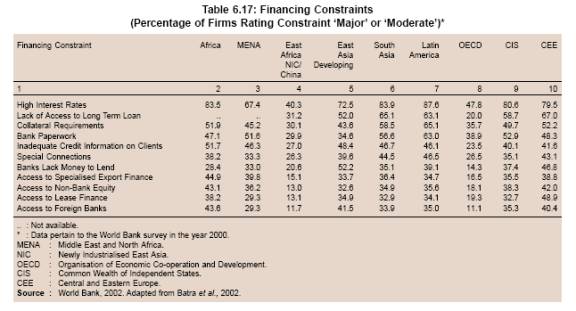
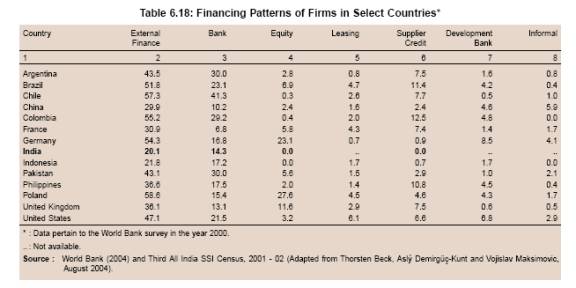
of access to long-term finance were the two major constraints faced by the SMEs. In developed economies with better financial systems, access to finance is much higher. Besides, they have devised various programmes for improving the credit flow to this sector, viz., venture capital, credit registry, specialised institutions for financing to SMEs, cluster-based financing and improving financial knowledge of SMEs, among others. Emerging economies have also given special emphasis on credit needs of the SME sector due to their strategic status in their economies. Since financial markets in these economies are not as much developed as in developed economies, they have established specialised institutions for the purpose. To avoid information asymmetry, most of the countries have dedicated credit guarantee institutions.
VI. INFRASTRUCTURE LENDING
6.90 Infrastructure is broadly defined as the physical framework of facilities through which goods and services are provided to the public and cover services as diverse as transportation, power generation, transmission and distribution, telecommunications, port handling facilities, water supply and sewage disposal, urban mass transport systems and other urban infrastructure, irrigation, medical, educational and other primary services. While provision of certain infrastructure services have a direct bearing on the level of business and commercial activity in a country, others are crucial for strengthening its social infrastructure (Mohan, 1996).
6.91 Paucity of adequate investments in infrastructure constraining growth was highlighted in the India Infrastructure Report 2001, which argued that the supply as well as demand constraints arising out of inadequate infrastructure had resulted in lower growth rates in the 1990s than what could have been possibly achieved with sufficient infrastructure. Infrastructural deficiencies at the State level and interState disparities in physical, social and economic infrastructure facilities were identified as contributing to the growing regional income disparities (Ghosh and De, 2004). According to the Eleventh Plan, additional investments in infrastructure to the extent of about Rs.12,00,000 to Rs.14,00,000 crore (at 2005-06 prices) would be necessary in order to attain the medium-term growth target of 9 per cent per annum, which is the target growth rate for Eleventh Five Year Plan. As per the Committee on Infrastructure Financing (Chairman: Shri Deepak Parekh), the above estimates may be an underestimation of financing needs. The Committee has put the investment required for the infrastructure sector during the Eleventh Plan at Rs.15,00,000 to Rs.17,00,000 crore, at 2005-06 prices, assuming that the real GDP grows at 9 per cent per annum and the annual inflation remains at 5 per cent. Furthermore, in order to achieve this ambitious target, half of the incremental domestic savings during the Eleventh Five Year Plan would have to be directed towards the infrastructure sector from the existing level of 15-20 per cent (Government of India, 2007a).
The Role of Commercial Banks in Infrastructure Financing
6.92 Infrastructure projects are usually characterised by large and lumpy investments. Most of the infrastructure projects are public goods. Infrastructure projects have long pay back periods and special features that make their financing more difficult. Therefore, the question arises as to what should be the mode of ownership and financing – the options being that of Government ownership or private participation in infrastructure. Government financing is preferable for infrastructure projects that are created with the aim of providing benefits to the society at large, whereas infrastructure projects that have a strong commercial component in the delivery of its services are more suitable for private sector participation. Private sector participation and Public-Private Partnerships (PPP) can occur through concessions (which include leases, affermages, build-operate-transfer contracts (BOTs) and divestitures with revocable licenses), green field projects and also through management and lease contract routes.
6.93 In general, gover nment financing is advocated for the provision of those services which have a public good nature and those which are non-excludable in their provision. In infrastructure projects developed by private sector participation, the modes of financing available are either equity or debt and the optimum of each is obtained, in theory, when the capital structure of the investment project is able to balance the risk of bankruptcy with the tax savings possible under debt (Table 6.19). In practice, the
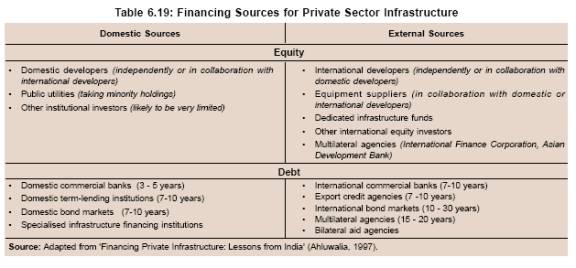
mode of financing of infrastructure projects would be dependent, among others, on the access to financial markets and the stage of development of the infrastructure project (Gawlick, 2007). Traditionally, the role of banks in infrastructure financing was predominantly through debt finance.
6.94 Debt financing of infrastructure projects are carried out primarily by means of commercial loans and bonds. Commercial loans are funds lent by commercial banks and other financial institutions and these funds are usually securitised by the project’s underlying asset. Provision of such funds usually depend upon the financial strength of the borrower, but of late, the expected cash flow from the infrastructure project is also given greater consideration for the provision of commercial loans. For funding large infrastructure projects, commercial banks may also syndicate loans - in which a large loan is shared among different banks. Syndicated lending enables the banks to diversify their portfolio as well as aid the banks to comply with the capital adequacy requirements. Investment in bonds, which are long-term interest bearing debt instruments, are done by banks, pension funds, insurance companies and fund managers through public or private placements. The credit quality of the bonds would be indicated by the credit ratings for the project given by independent credit rating agencies (Gawlick, 2007).
6.95 Lending by banks to infrastructure projects exposes them to several risks. However, at the same time, it provides them good business opportunities (Box VI.12).
Box VI.12
Bank Lending to Infrastructure: Risks and Opportunities
Commercial banks, by the very nature in which they conduct their business - where they primarily deal with short term borrowings (liabilities) and long term investments (assets) - face serious term mismatch in financing infrastructure projects, which involves funding of 10-12 years and at times over 15 years. Hence, credit by commercial banks to infrastructure projects, on the scale required, could be subject to limitations, including the banks’ reluctance to lend on account of adverse macroeconomic scenario or due to high opportunity costs of bank deposits. Banks, on their part, may prefer bond financing of infrastructure projects as it would lead to a better perception of credit risk on account of external ratings of the bonds. Furthermore, the ability to trade bonds in debt market would also give them an exit option. In this context, with the recent emergence of project finance and project bonds, banks have an option to enter into financing of high risk, capital intensive, long duration infrastructure projects with a transparent cash flow. Moreover, in case of loans disbursed by bank to infrastructure, it need not retain the loans as an asset in its balance sheet for extended period of time as it can resort to securitisation of advances extended to the infrastructure projects. Another way by which the banks have been increasing their exposure to infrastructure sector has been through the establishment of infrastructure funds.
More importantly, the role of banks in private infrastructure financing includes project evaluation and design, arrangement and placement of funds and loan finance, the application of banks’ specialist skills to facilitate development of new projects by making more funds available and in improving efficiency by bringing out organisational innovation (Lynch, 1996). Hence, successful infrastructure financing or project financing by banks involves not only the provision of credit, but more importantly, also their role as advisors to project finance as they possess legal, accounting, tax and banking skills.
Banks play a vital role in infrastructure financing through originating, underwriting and distributing risk. Infrastructure projects usually turn to banks for financing their construction activities and on completion of the project, for their permanent long-term financing. Construction finance requirements would be for a period of 2 to 3 years, for which banks could charge interest at a floating rate. The permanent finance requirements would be for a period of 10 to 15 years which could be at a fixed rate of interest.
While financing the construction stage, banks are exposed to construction risk, especially in projects related to power and roads. Construction risk here refers to the time and cost overruns that can occur due to unexpected developments during the construction stage. Another risk that the banks have to examine at the time of construction stage, due to interest rates being charged at floating rates, would be interest rate risks. Interest rate risks are particularly associated with infrastructure projects having high capital intensity and long payback period. In such a scenario, interest costs constitute a substantial share of total costs for a long duration and large variations in interest rates can result in significant cost overruns over the expected levels.
At the operational stage, permanent bank lending to infrastructure projects has to take into account a number of risks. The risks at this stage would primarily take the form of market risk, operating risk and foreign exchange risk, among others. Market risks in infrastructure projects arise when the market conditions assumed in determining the viability of the project are not realised. In cases, where the private infrastructure provider deals directly with the users, market risk is borne by the investor/bank. Operating risks in infrastructure projects refer to risks of the project delivering performance levels which was lower than what was expected from the previous feasibility studies. Such risks are more concentrated in telecommunications, where technology is changing rapidly. Finally, in the case of banks lending to infrastructure projects abroad, there exist foreign exchange risks which can occur on account of various reasons. In the event of a depreciation of the currency of the country in which the infrastructure project is financed and in which currency the project revenues are denominated, unless substantial increase in project’s cash flow are realised, it could lead to substantial increase in domestic currency cost of payments for the project to international lenders.
In spite of these risks, infrastructure would emerge as one of the largest source of demand for finance, specifically long-term finance, in the coming years, in both developed as well as emerging markets. If carried out correctly, infrastructure financing especially by means of participation in project finance represents tremendous opportunity for banks to increase their sphere of operations. Banks’ involvement in infrastructure financing is aided by the fact that they are better placed than most other market participants in assessing complex project financing transactions and in identifying various risks in different stages of the infrastructure project.
First and foremost, given the necessity for increased finance in infrastructure, a point for consideration is the manner in which banks should participate in infrastructure financing without compromising on the efficiency of the banking sector in general, considering the long term duration and high risks involved in infrastructure finance. Often banks involvement in infrastructure finance has been without due considerations to the various kinds of risks involved in infrastructure finance. Hence, in addition to credit risk there also is the necessity for the commercial banks to be aware of the market risks involved in financing of the infrastructure projects. It would entail in having a clear understanding of and appropriate design of the revenue generating mechanism, dispute settlement mechanisms and support mechanism in the event of revenue shortfall. Secondly, taking into consideration the social benefit derived from many infrastructure projects and their public good nature, it would also bring forth the fact that private sector participation and especially financing of infrastructure by scheduled commercial banks might be viable only in those scenarios where a sustained, transparent cash flow can be guaranteed. In the absence of guaranteed cash flows, government intervention in terms of targeted subsidies or supplementary revenue mechanisms need to be realised to make private participation viable in this sector.
References:
Ahluwalia, M.S. 1997. “Financing Private Infrastructure: Lessons from India.” in Choices for Efficient Private Provision of Infrastructure in East Asia, (eds.) Harinder Kohli, Ashoka Mody, and Michael Walton, World Bank.
Gawlick, Sonia. 2007. “Public-Private Partnerships: A Financier’s Perspective.” United Nations Economic and Social Commission for Asia and the Pacific (UNESCAP), UNO.
Lynch, David. 1996. “Financing Infrastructure Projects-Australian Investment Banks’ Experience”. Paper prepared for the APEC Financiers Meeting, Tokyo, Japan, February 1996.
Box VI.13
Financing of Infrastructure by Banks: Cross-Country Experiences
Private sector participation in infrastructure financing in Australia encompass almost the entire range of infrastructure projects which include social infrastructure - hospitals, prisons and commercial ventures in transport, power and communication. Australia has emerged as the pioneer in designing successful concession based infrastructure financing models. Banks in Australia played a twin role in ensuring greater private sector involvement in infrastructure projects, first by acting as a source of finance for the infrastructure projects and second, by way of providing project assessment. Financing of infrastructure by banks in Australia takes the form of underwriting of equity, where the Australian banks are the world’s first in successful underwriting and placement of equity for a road project and in raising debt through the bond market (Lynch, 1996).
One of the spectacular success stories in infrastructure development in recent times is that of China. In China, the various sources of infrastructure finance are provincial and local governments, state development banks, Chinese international corporations, and multilateral agencies. It is primarily the domestic loans and self generated funds that contribute to the bulk of infrastructure financing. A major role in infrastructure financing is carried out by the China Development Bank, one of the three development banks established in 1994 for the purpose of lending to key infrastructure projects envisaged by the State. The major sources of financing for China Development Bank are first of all budgetary appropriations received from the Ministry of Finance for carrying out specific infrastructure projects. The second source of finance is the bonds, which are placed with specialised and provincial commercial banks based on their excess reserves thus enabling the development bank to utilise the deposits of commercial banks for infrastructure finance. It also raises funds in the international market by means of bonds as well as syndicated loans (Spear, Andrea et al., 1997). During the period from 1994 to the end of 2005, 88.9 per cent of the lending by China Development Bank was directed towards eight key industry sectors, i.e., power, road construction, railway, petro-chemical, coal mining, telecommunications, public facilities and agriculture and related industries.
References:
Lynch, David. 1996. “Financing Infrastructure Projects-Australian Investment Banks’ Experience”, Paper prepared for the APEC Financiers Meeting, Tokyo, Japan, February 1996.
Spear, Andrea et al.,1997. “China Infrastructure: Sectoral Plans, Reforms and Financing”, East Asia Analytical Unit, Department of Foreign Affairs and Trade, Commonwealth of Australia.
6.96 Since financing by banks to infrastructure projects poses some serious risks, banks have devised appropriate mechanisms to finance infrastructure projects without exposing themselves much to the risks involved. Cross-countr y experiences of Australia and China shows that banks use bonds to raise long-term funds for on-lending to infrastructure projects (Box VI.13).
Financing of the Infrastructure Sector by Banks in India
6.97 The infrastructure sector was thrown open to private sector in the early 1990s. Banks, therefore, were allowed to provide, in addition to working capital requirements, term loans and guarantees for infrastructure projects. In order to facilitate financing of infrastructure projects, banks were allowed to exceed exposure norms by 10 per cent (Box VI.14). In the absence of a well-developed private corporate debt market, banks have emerged as a major source of funds for infrastructure projects.
6.98 The outstanding gross credit by SCBs for infrastructure projects grew sharply from Rs.3,163 crore at end-March 1998 to Rs.11,349 crore by end-March 2001 and further to Rs.1,42,975 crore at end-March 2007, i.e., at a compound annual growth rate of 52.7 per cent during 1998-2007. The share of infrastructure financing in total bank credit increased from 1.0 per cent at end-March 1998 to 7.4 per cent at end-March 2007 (Table 6.20).
6.99 In 1998 and 1999, the telecommunication sector constituted the largest share of bank finance. However, at end-March 2000, the power sector constituted the largest share, the position which continued in the subsequent years. In fact, from 2002 onwards the power sector accounted for around 50 per cent share in bank credit to infrastructure projects (Table 6.21).
Box VI.14
RBI Guidelines on Financing of Infrastructure by Banks: Salient Features
In terms of the guidelines issued by the Reserve Bank in February 2003, Banks/FIs were given the freedom to finance technically feasible, financially viable and bankable projects undertaken by both public sector and private sector undertakings subject to the following conditions: i) The amount sanctioned should be within the overall ceiling of the prudential exposure norms prescribed by the Reserve Bank for infrastructure financing. ii) Banks/FIs should have the requisite expertise for appraising technical feasibility, financial viability and bankability of projects, with particular reference to the risk and sensitivity analysis. iii) In respect of projects undertaken by public sector units, term loans may be sanctioned only for corporate entities (i.e., public sector under takings registered under Companies Act or a corporation established under the relevant statute). Further, such term loans should not be in lieu of or to substitute budgetary resources envisaged for the project. iv) Banks may also lend to special purpose vehicles (SPVs) in the private sector, registered under Companies Act for directly undertaking infrastructure projects, which are financially viable and not for acting as mere financial intermediaries. Banks are required to ensure that the bankruptcy or financial difficulties of the parent / sponsor should not affect the financial health of the SPV.
In order to meet financial requirements of infrastructure projects, banks may extend credit facility by way of working capital finance, term loan, project loan, subscription to bonds and debentures/preference shares/equity shares acquired as a part of the project finance package which is treated as ‘deemed advance’ and any other form of funded or non-funded facility.
Banks may enter into take-out financing arrangement with IDFC / other financial institutions or avail of liquidity support from IDFC / other FIs.
Banks are permitted to issue guarantees favouring other lending institutions in respect of infrastructure projects, provided the bank issuing the guarantee takes a funded share in the project at least to the extent of 5 per cent of the project cost and undertakes normal credit appraisal, monitoring and follow up of the project.
In terms of guidelines issued by the Reserve Bank, banks were advised that the promoter’s contribution towards the equity capital of a company should come from their own resources and the bank should not normally grant advances to take up shares of other companies. In view of the importance attached to infrastructure sector under certain circumstances, an exception may be made to this policy for financing the acquisition of promoter’s shares in an existing company which is engaged in implementing or operating an infrastructure project in India.
Credit exposure to borrowers belonging to a group is allowed to exceed the exposure norm of 40 per cent of the bank’s capital funds by an additional 10 per cent (i.e. up to 50 per cent), provided the additional credit exposure is on account of extension of credit to infrastructure projects. Credit exposure to single borrower is allowed to exceed the exposure norm of 15 per cent of the bank’s capital funds by an additional 5 per cent (i.e. up to 20 per cent) provided the additional credit exposure is on account of infrastructure.
Banks are allowed to assign a concessional risk weight of 50 per cent for capital adequacy purposes, on investment in securitised paper pertaining to an infrastructure facility, subject to compliance with the other criterion. The infrastructure facility should be generating income/cash flows which would ensure servicing/repayment of the securitised paper.
The long-term financing of infrastructure projects may lead to asset-liability mismatches, particularly when such financing is not in conformity with the maturity profile of a bank’s liabilities. Banks, therefore, are required to exercise due vigil on their asset-liability position to ensure that they do not run into liquidity mismatches on account of lending to such projects.
6.100 Net credit (net of repayments) by banks to infrastructure, which increased sharply in 2002-03 (due mainly to reverse merger of ICICI with ICICI Bank) and again in 2004-05 (due mainly to conversion of IDBI into a bank), registered negative growth in 2005-06, mainly due to high base. However,
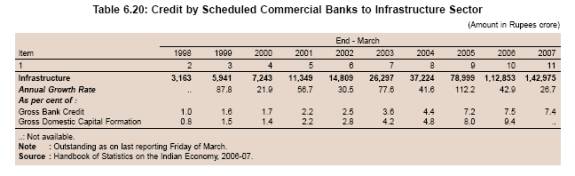
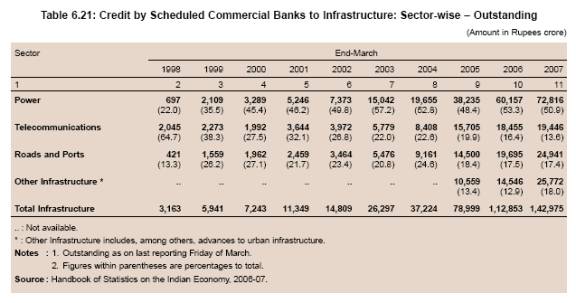
during 2006-07 also, net credit growth, to infrastructure sector was negative (Table 6.22).
6.101 Development finance institutions have historically played an important role in financing the medium and long-term projects. After the
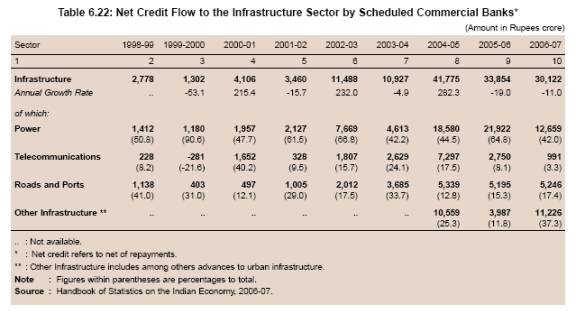
infrastructure sector was thrown open to the private sector, DFIs by virtue of their project finance skills, were expected to play an important role in financing infrastructure projects. The setting up of IDFC in 1997 was further expected to provide an impetus to financing of infrastructure projects. However, the
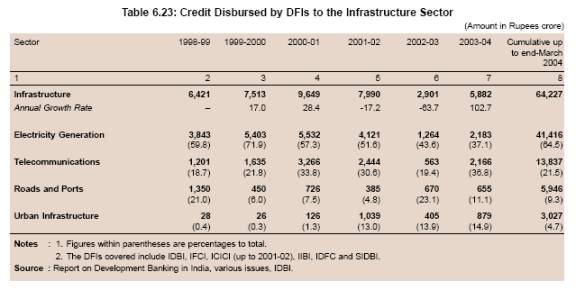
conversion of two major DFIs into banks and the sharp decline in the role of IFCI and IIBI because of their fragile health significantly reduced the role of financial institutions in financing the infrastructure projects. The total credit disbursements of DFIs amounted to Rs.5,882 crore during 2003-04. In the case of DFIs also, the power sector constituted the largest share (Table 6.23).
6.102 A comparison of funding of infrastructure projects by scheduled commercial banks and DFIs in terms of their advances to infrastructure credit reveals that till 2001-02, DFIs were the main source of funds for infrastructure projects. However, from 2002-03 onwards, banks emerged as a major source of funds for infrastructure projects. It was partly on account of the conversion of two major DFIs (ICICI Ltd. and IDBI) into banks.
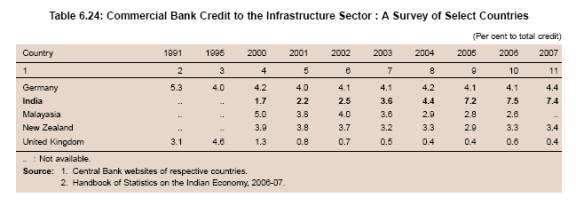
6.103 A cross country survey of bank credit to infrastructure in select countries shows that the role of commercial banks in infrastructure financing has declined significantly in recent years. However, commercial banks’ credit to infrastructure projects in India increased in recent years (Table 6.24).
6.104 To sum up, with the increased private participation in infrastructure, the role of banks in financing infrastructure projects has increased significantly. Although banks have been financing all types of infrastructure projects, the power and telecommunication sectors have received the largest share of banks’ funding.
VII. RETAIL CREDIT
6.105 Retail or household credit comprising mainly housing loans, advances to individuals against fixed deposits, credit card, educational loans and loans for purchase of consumer durables has become an important component of banks’ loan portfolio in several countries. In India, until the initiation of financial sector reforms, there were too many restrictions on retail credit in the form of limits on total amount of housing loan, loans to individuals, rate of interest, margin requirement and prescription of maximum repayment period, among others. However, banks were granted the freedom in the 1990s to decide the quantum, rate of interest, margin requirement, repayment period and other related conditions of retail loans. These relaxations had a positive impact on the growth of personal loans beginning in the second half of the 1990s.
6.106 Personal loans registered an average annual growth of 28.1 per cent during the period from 1992-93 to 2006-07 as compared with 25.2 per cent in the 1990s; overall bank credit during this period increased at an average annual growth rate of 19.5 per cent. Growth of personal loans has always remained higher than the overall credit growth since 1992-93, barring 1998-99 and 2006-07. Consequently, the share of personal loans in total bank credit increased steadily from 8.3 per cent at end-March 1993 to 22.3 per cent at end-March 2007(Chart VI.24).
6.107 The share of housing loans in total bank credit picked up sharply from 3.2 per cent in 1998-99 to 11.8 per cent in 2006-07(Chart VI.25). Within personal loans, the share of housing loans declined from 37.3 per cent at end-March 1993 to 27.7 per cent by end-March 1998, but rose sharply thereafter to 52.8 per cent at end-March 2007 (Table 6.25).
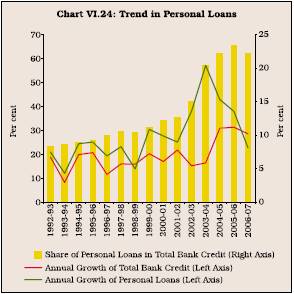
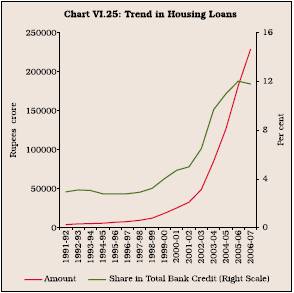
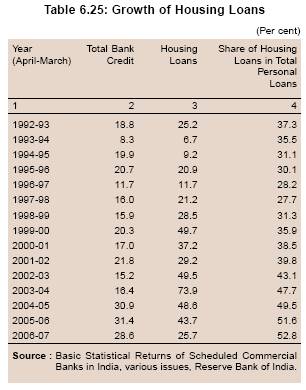
6.108 The sharp increase in bank credit to the household sector was contributed by several factors. With high economic growth in recent years, job opportunities in urban areas expanded and income levels rose sharply. Rising income levels, especially at younger age, enhanced the affordability. This coupled with real estate boom offered opportunities for the customers to own a house by availing of the housing loans. The rapid growth in the housing market was actively supported, inter alia, by the emergence of a number of second tier cities as upcoming business centres. With inflation and inflationary expectations well-anchored, the inflation risk premium fell resulting in a decline in both nominal and real interest rates. The increase in IT and IT-related activities had a positive impact on demand for housing. Further, tax incentives offered to salary earners made housing loans more attractive by bringing down the effective rate of interest. All these factors contributed to the increased demand for housing loans. The sharp rise in retail bank credit was also facilitated by the changing consumer demographics which indicates a vast potential for growth in consumption both qualitatively and quantitatively. India is one of the countries having highest proportion (70 per cent) of the young population (below 35 years of age). Convenience banking in the form of credit/debit cards, internet and phone-banking, anywhere and anytime banking attracted many new customers into the banking fold. Technological innovations such as, ATMs also contributed to the growth of retail banking in India.
6.109 Credit cards have witnessed large-scale acceptance as a medium of transaction usage through points of sale (PoS) across different merchant establishments. It has found greater acceptance in terms of usage in major cities of the country, particularly in four metropolitan cities which account for bulk of the transactions. The share of credit card receivables in total loans and advances and total retail credit increased from 0.7 per cent and 3.3 per cent, respectively, at end-March 2004 to 1.0 per cent and 3.8 per cent, respectively, at end-March 2007. Growth in the credit card transactions is attributable to the rapid advances in information technology, the evolving macroeconomic environment and several micro-level demand and supply-side factors. Technology has enabled a significant reduction in the cost of external finance for borrowers, while banks have benefitted from product innovations, and lower transaction cost associated with collection, processing and use of information. Technology has offered banks better techniques for risk management and product pricing.
6.110 On the supply side, the demand for credit by the industrial sector slowed down, especially between 1996-97 and 2001-02, as a result of which banks started looking for alternative avenues of lending. Banks also looked at retail loans from the point of view of diversification of their loan portfolio, especially because banks’ balance sheets were seriously impaired on account of lending to the corporate sector before the reform process began. Furthermore,treasury income of the banks, which helped in strengthening their profitability between 2002-03 and 2004-05, declined in recent years. In the case of retail and personal loans, the average size is very small and loans are widely distributed over a large number of borrowers. Accordingly, the average risk associated with retail loans is also much lower. In the case of mortgage loans, there is adequate collateral structure, particularly for housing and auto loans. It is also easier to determine the realistic sale value of housing loans than of inventory and plant and equipments. Besides, risk adjusted return on retail loans is normally significantly higher than the corporate loans. Banks, therefore, expanded their retail loan portfolio in a big way. Besides the above, comfortable liquidity position with banks, which created easy credit conditions, encouraged them to look to new clients.
6.111 The phenomenon of high growth in retail credit was observed across all bank groups. However, as foreign banks have limited bank branches and are located mostly in urban and metropolitan cities, they were more aggressive in promoting the personal loans, especially among the urban salaried class borrowers. Accordingly, the share of personal loans in total credit at end-March 2000 was the highest in the case of foreign banks. In recent years, however, Indian private sector banks also became more aggressive in promoting the retail loan segment. As a result, by end-March 2007, the share of personal loans in total credit extended by private banks was highest among all bank groups (Chart VI.26).
6.112 Countries such as Central Europe, Russia, South Africa and Saudi Arabia have also witnessed sharp increase in retail credit in recent years. Significantly, similar rising trend was observed in other Asian countries such as Korea, Malaysia, China and Indonesia also. The cross country experiences revealed that the sharp pick up in household credit was on account of both demand and supply side factors. Besides, the shift in the consumption pattern in most of these countries and the relaxation in the regulatory measures restricting bank lending to the
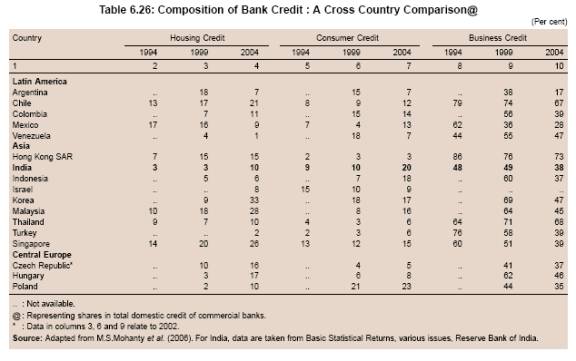
housing and consumer sectors also contributed favourably towards this trend. With these developments, latent demand materialised (Bacchetta and Gerlach, 1997). In many countries, the authorities themselves took several proactive measures to
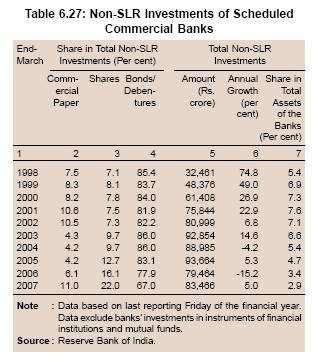
encourage residential investment which attracted borrowing-led household consumption as part of the strategy to revive domestic demand. As regards the supply side factors, several innovative products/ measures and instruments were introduced by the banking sector which suited most to the consumers with adequate flexibility and convenience to the households which attracted increased bank credit flows. For instance, variable rate mortgages and credit card with flexible payment options, among others, indeed helped promote consumer or retail credit boom in most of the countries, including India. The general decline in interest rates coupled with lower and stable inflation also increased the purchasing power among the EMEs. Owing to the above factors, there was an unusual strong demand for credit growth in the household sectors in many countries (Mohanty et al., 2006) (Table 6.26).
6.113 Retail credit became a key area of strategic emphasis in the U.S. banking industry also. A study in the US at the bank level pointed out that the principal attraction of retail banking was the belief that its revenues were stable and, thus, could offset volatility in the non-retail businesses. Some banking industry analysts argued that retail banking offered high returns along with low risk. The literature suggests that both risk and return decline as banks become more focused on retail banking activities, which is consistent with traditional finance theory, which highlights the importance of taking a longer run perspective when considering how risk and return are affected by broad shifts in business strategy (Clark et al., 2007). Retail banking accounts for as much as 50 to 75 per cent of revenues in many large bank holding companies in the US. What is even more intriguing is that organisationally, many large banking companies in the US have exclusive retail banking units, with their own management and financial reporting structure.
6.114 In the US, retail banking is a significant source of revenue and profit for many large banking organisations. Data from a sample of large banks’ annual reports and public financial statements suggest that between 50 and 75 per cent of net operating revenue (net interest income plus non-interest income) is derived from retail banking activities at most of these institutions. Banking industr y analysts and the banks themselves consistently point to the stability of revenue and profit as the most important feature of retail banking and a key motivation for the recent interest. The retail lending portfolio which contains a large number of small, more often collateralised loans means that the lending income may be less volatile over time because of diversification across customers. Clark et al., 2007 observed that ‘…among industry observers, there seems to be a consensus, suppor ted by the academic evidence, that retail activities tend to be more stable than other banking activities…’ However, there has been a contrarian view as well. Hirtle and Stiroh (2007) observed that while retail banking might be a relatively stable activity, it was also a relatively low-return one. Retail loans also expose the banking system to certain risks (Box VI.15).
6.115 To sum up, one of the significant and discernible changes in the pattern of bank credit was the sharp increase in the share of retail or household credit comprising mainly housing loans, advances to individuals against fixed deposits, credit card, educational loans, loans for purchase of consumer durables and related items. In India, consequent to initiation of financial sector reforms, banks were granted the freedom to decide the quantum, rate of interest, margin requirement, repayment period and other related conditions of retail loans. These relaxations were a driving force behind the growth of overall retail credit. Both demand and supply side factors contributed to the sharp spurt in credit to housing which has become the mainstay of retail bank credit. On the demand side, both macro and micro level factors, especially the robust growth in GDP, contributed to the increased demand for credit. With the increased size of middle-class population, the demand for consumer durables also increased, creating new demand for bank financing. On the supply side, the perceived higher returns, low and diversified risk (due to small size of transactions) and most often collateralised lending, were some of the key factors that led to a surge in credit to the household sector across the banking spectrum. In the Indian context, retail lending has emerged as a key profit driver for banks in recent years. Retail loans have also benefitted from the entry of new private sector banks which have concentrated more on retail lending in their portfolios. Incidentally, the banks’ loan portfolio in several other countries, especially EMEs also grew rapidly.
Box VI.15 Risks of Retail Lending
A consumer sector shock could hurt the retail franchise on both the asset and liability sides. The banking system itself may, thus, be more exposed to a macroeconomic downturn in the consumer sector, and perhaps will have economy wide implications. For instance, Bernanke (1983) cautions that banks play a special role in the economy, given their ability to provide credit to informationally opaque small businesses which included the retail banking. However, this sector is most affected in the case of a downturn in the consumer sector, which, in turn, could impact the extent of a monetary policy response.
One of the most important aspects as far as the consumer sector is concerned is that the sector itself is vulnerable to many macroeconomic factors, such as oil prices hike, real estate prices hike, fall in employment leading to reduction in consumer sector’s power to spend, general increase in inflation and so on. It is this sector which gets affected more than any other in the economy. Therefore large scale exposure to this sector has systemic implications.
An overheated property market could be another source of risk. For instance, both demand and supply of housing loans may be sustained by over-optimistic expectations and property prices, liberal valuation of housing collateral and high loan-to-value ratios, exposing households and banks to a downturn in property prices.
Yet another potential vulnerability could stem from possible under-assessment of risks by banks while lending to households. Excess liquidity, competition in retail loan markets and the strong income growth seen recently in many countries could lead to procyclical lending behavior, whereby banks ease lending standards by either charging excessively low interest rates or reducing collateral requirements to attract customers (Mohanty et al., 2006). Such low rates may not accurately compensate for all possible risks.
In some countries, systemically very large banks are engaged in retail banking on a large scale. It is possible that in the event of a down turn, this may ultimately affect the system as a whole, lending the system vulnerable to such downturns.
References:
Mohanty, M. S., Gert Schnabel and Pablo Garcia-Luna. 2006. “Banks and Aggregate Credit: What is New?” BIS Papers No. 28
VIII. INVESTMENT OPERATIONS OF BANKS
6.116 Commercial banks’ investments are of three types, viz., Government securities, other approved securities, and non-approved securities. These three are broadly categorised as SLR investments (Government and other approved securities) and non-SLR investments (comprising commercial papers, shares, bonds and debentures issued by the corporate sector). Banks are required to invest a prescribed minimum of their net demand and time liabilities in Government and other approved securities under the BR Act, 1949.
6.117 One of the major elements constricting the operational flexibility of banks and depressing banks’ income earnings capacity prior to financial sector reforms was the system of directed investment in the form of minimum statutory liquidity ratio which was raised to as high as 38.5 per cent by September 22, 1990. However, the SLR was gradually reduced to the then statutory minimum level of 25 per cent by October 25, 1997. This provided the banks with greater flexibility to choose their investment portfolio.
6.118 For a long time, commercial banks in India were discouraged from undertaking investments in shares and debentures of joint stock companies. However, the policy in this regard was liberalised from 1985. The ambit of eligible investments was enlarged to cover commercial paper (CP), units of mutual funds, shares and debentures of PSUs, which are all known as non-SLR investments. Similarly, the limit on investments in the capital market has been revised from time to time. Aggregate exposure (both fund and non-fund based) of banks to the capital market in all forms under direct and indirect exposures was stipulated at 40 per cent of net worth in terms of the guidelines issued on December 15, 2006, which came into effect from April 1, 2007.
Trends in Investment Operations of Banks
6.119 Investments by SCBs grew at an average annual rate of 22.3 per cent during the 1970s, 19.9 per cent during the 1980s and 17.0 per cent during the 1990s. However, investments slowed down to 14.8 per cent during the period 2000-07 (Chart VI.27).
6.120 The statutory liquidity ratio was brought down in phases from 38.5 per cent in February 1992 to 25 per cent by October 1997. However, banks continued to invest in Government securities because of their risk averse behaviour and slowdown of the industrial sector (Chart VI.28).
6.121 Incidentally, the period of low demand for credit coincided with the period when banks were making efforts to raise their capital levels and reduce the levels of NPAs. The application of capital adequacy norms, which required banks to maintain 8 per cent of their risk-weighted assets as capital from March 31, 1996, and the pressure to bring down their NPA levels made banks somewhat risk averse. That was also the time when certain segments of industries like basic metals and alloy industries, chemicals, cement, iron and steel, and textiles faced failures leading to large scale NPAs. As such, investments in Government and other approved securities, which attracted zero-risk weights, became
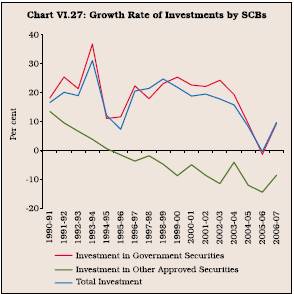
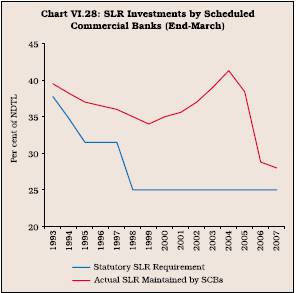
the preferred form of investments by banks. It is also possible that, in a declining interest rate scenario in the presence of a developing debt market, this was a rational profit maximising strategy (Mohan, 2004). This development was in accordance with the intuitive argument that the increase in a risk-based capital requirement can cause a bank to shift from loans to investment in securities. Similar bank behaviour was observed in other countries as well whenever there was a change in regulatory reserve requirement. Empirical research by Thakor (1996) and Passmore and Sharpe (1994) pertaining to bank behaviour also came up with similar findings.
6.122 Growth of aggregate deposits slowed down to 15.4 per cent in 2004-05 from 16.4 per cent in 2003-04 as banks faced increased competition from other saving instruments. However, credit demand increased sharply, first from the household sector and then from the other sectors. The combination of these factors led to a significant adjustment in the investment portfolio of banks. Banks endeavoured to meet the increased credit demand by restricting fresh investments in Government securities in 2004-05 and then liquidating Government securities in 2005-06. The banks’ investment in government securities picked up again in the year 2006-07 (Chart VI.29 and Chart VI.30).
6.123 Growth in investments by scheduled commercial banks in non-SLR securities declined shar ply between 1997-98 and 2001-02, but witnessed an erratic pattern thereafter mainly because of adjustment in response to banks’ main por tfolio of loans and advances and SLR investments. During 2006-07, banks’ investments in non-SLR securities (i.e., bonds/debentures/shares and commercial papers) issued by the corporate sector increased by 5.0 per cent as compared with a decline of 15.2 per cent in the previous year, reflecting the robust growth of deposits and slowdown in credit. While investments in bonds/ debentures declined sharply, those in shares and commercial paper increased.
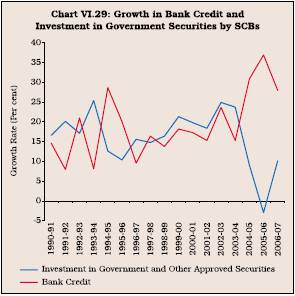
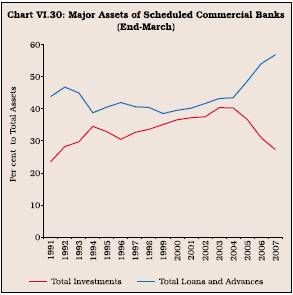
6.124 The share of non-SLR investments in total assets of banks increased steadily from 5.4 per cent in 1998 to 7.6 per cent in 2001, but declined thereafter to 2.9 per cent by end-March 2007 (Table 6.27).
6.125 In terms of instruments, bonds/debentures constituted the largest component of non-SLR investments, though their share in total non-SLR investments declined to 67 per cent at end-March 2007 vis-à-vis 85.4 per cent in 1998. On the other hand, the share of equities rose steadily, particularly from 2004-05. The share of CPs in total non-SLR investments fluctuated over the years.
6.126 An analysis of the bank-group wise investment-deposit ratio throws up some interesting features. The investment to deposits (ID) ratio of foreign banks was the highest among all bank groups in most of the years from 1992 to 2007 (Chart VI. 31).
6.127 The return on advances measured in terms of interest earned on advances traditionally was higher than return on investments. However, the divergence between the two started narrowing down in the early 1990s, when interest rates on Government securities were freed. The rate of return on investments has now converged with that of advances (Chart VI. 32).
6.128 Banks in India have historically maintained a significant share of investments because of
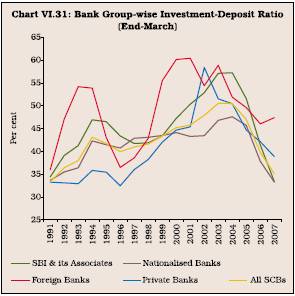
prescription of SLR. Their non-SLR investments constituted a small percentage (2.9 per cent at end-March 2007) of their total assets. However, it is observed that in other countries also, banks maintain quite a sizeable portion of their assets in the form of investments. India had relatively higher proportion of investments in comparison with Italy, Mexico, Chile, South Korea, Indonesia, Thailand, Malaysia and Russian Federation, but lower than several other countries (Table 6.28).
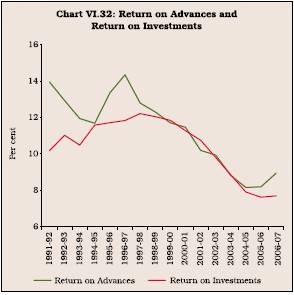
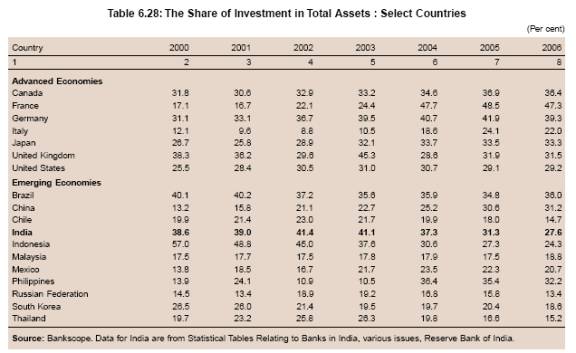
6.129 To sum up, banks have been provided with greater flexibility in their investment portfolio since the mid-1990s. Banks used this flexibility to maximise returns. Banks continued to remain invested in Government securities even when the SLR was brought down significantly in the mid-1990s. This was mainly because credit demand had slowed down and also because banks found risk-adjusted return on Government securities more attractive. However, banks offloaded the excess stock of Government securities when interest rates softened (and made large trading profits in the process) and credit demand picked up. Non-SLR investments by banks were adjusted rapidly in response to their requirement of SLR por tfolio and credit demand. Returns on investments held by banks have now converged with those on their loans and advances.
6.130 The overall analysis of lending and investment operations of SCBs reveals that credit by SCBs from the early 1990s witnessed three distinct phases. In the first phase (from 1990-91 to 1995-96), bank credit growth showed erratic behaviour. In the second phase (from 1996-97 to 2001-02), bank credit growth decelerated sharply and remained range-bound. In the third phase (from 2002-03 to 2006-07), credit growth has been high. Banks’ loan portfolio responded mainly to the developments in the real economy and their own health. Bank credit growth decelerated from 1996-97 to 2001-02 when the industrial sector slowed down and banks’ health was impaired. However, credit growth accelerated from 2002-03 onwards when credit demand picked up and banks’ health improved. The credit to GDP ratio of banks in India also increased significantly in the current decade. However, the credit to GDP ratio in India was significantly lower than that in advanced economies and several other emerging market economies, as might be expected, given India’s lower per capita income.
6.131 Bank credit underwent a major compositional shift from 2002 onwards. Credit growth to agriculture, accelerated significantly from 2003-04 onwards. Although the share of agriculture credit in total bank credit declined over the years, it needs to be seen in the context of decline in the share of agriculture in GDP. Credit intensity (agriculture credit as percentage of sectoral GDP) increased significantly. In fact, credit intensity of agriculture in 2006-07 was at an all-time high level. A cross country comparison suggests that the share of bank credit to the agriculture sector in total bank credit in the case of banks in India was on the higher side as compared with that in other countries. Commercial bank credit intensity of the agriculture sector in India, in recent years, was also higher than some countries such as Germany, Thailand and Indonesia but lower than the UK, Australia and the US.
6.132 Bank credit to industry accelerated between 2000-01 and 2005-06. The financing pattern of Indian corporates also suggested a sharp increase in the share of bank borrowings in total sources of funds of the corporates. As a result, credit intensity of industry increased significantly after 2001-02. However, a part of the increase was on account of sharp increase in exposures of banks to the infrastructure sector and project loans to the corporates as reflected in the increase in the share of medium and long-term loans in total credit. Although the share of bank credit to industry in total credit declined over the years, still the dependence of industry on the banking sector in India was significantly higher than that in many other countries such as Australia, Brazil, the UK, New Zealand, South Korea and the US. Credit intensity of the industrial sector in India was also far higher than that in several other countries. This, however, cannot be attributed entirely to the increased exposure to the infrastructure sector. This is because although the share of credit to the infrastructure sector in total bank credit in India was higher than that in other countries, the difference was not large enough so as to explain the higher share of industry in total bank credit. The high credit intensity of industry was somewhat surprising, given that the share of the SSI sector in total credit to industry declined consistently over the years. This clearly suggests that in India, large corporates have increased their reliance on the banking sector and this was in contrast to the trend in many other countries. A survey of select countries on the financing pattern of SSIs also revealed that the dependence of the SSI sector on the banking sector in India was far lower than that in many other countries such as Argentina, Brazil, Chile, Colombia, Indonesia, Pakistan, the Philippines, and the US. The dependence of the SSI sector on the banking sector only in China, France and United Kingdom was lower than that in India.
6.133 A significant feature of bank credit in recent years was the sharp increase in credit in personal loans, which accounted for almost one-fourth of the total bank credit at end-March 2007. Most of the increase emanated from the increase in the share of housing loans. A cross country evidence suggested that the share of housing credit in total bank credit in the case of India was higher than that in Argentina, Indonesia, Israel, Mexico, and Turkey but lower than that in Chile, Columbia, Czech Republic, Hungary, Korea, Malaysia and Singapore.
6.134 Thus, agriculture, infrastructure, large corporates and households benefited from the sharp increase in bank credit in recent years. The SME sector received less than due attention from the banking sector. Banks adjusted their investments in SLR (other than the minimum statutory requirement) and non-SLR securities to suit the requirements of their credit portfolio.
IX. THE WAY FORWARD
6.135 Given that credit plays an important role in promoting the growth of the economy, the Reserve Bank has always endeavoured to ensure that adequate credit is available to all the productive sectors of the economy. Demand for bank credit is likely to remain strong in view of large funding required by the infrastructure sector, the growing size of the services sector, increased funding by the SMEs and rural enterprises, increasing household incomes and greater monetisation of the economy. The emphasis on financial inclusion will also lead to increased demand for credit. The banking system has to respond adequately to these new opportunities. Innovative channels for credit delivery for serving these new rural credit needs, encompassing full supply chain financing, covering storage, warehousing, processing, and transportation from farm to market will have to be found. The incipient investment boom in infrastructure, industry and services will yield best results only if enormous resource flows are successfully intermediated at a low cost. This will depend on the ability of the financial sector to process information properly and in an efficient manner.
6.136 While various measures from time to time have had favourable impact, there is a need to ensure that credit flows smoothly to all sectors, especially agriculture and SMEs. This is necessary to sustain the overall growth of the economy.
6.137 Banks, of late, are moving towards the use of more sophisticated risk management techniques. At present, banks, by and large, depend more on the traditional mode of hedging the credit risks by resorting to restricting fresh exposures, outright sale of an existing fund based exposure, obtaining credit guarantee cover, and more recently securitisation. In future, some more products such as credit derivatives may emerge in India. The Reserve Bank of India had issued the modified draft guidelines for introduction of credit derivatives in India on May 16, 2007. However, in view of certain adverse developments witnessed in different international financial markets, particularly the credit markets, it has been decided to keep in abeyance the issuance of the final guidelines on introduction of credit derivatives in India.
Agricultural Finance
6.138 The major challenges faced in agricultural credit involves not only ensuring flow of credit to the small and marginal farmers but also designing policies and credit delivery systems that are relevant to the present scenario in terms of production and demand for agricultural products. Any policy on the future direction of agricultual credit in the country needs to take into account the need for crop diversification in the rural areas (Mohan, 2006). The current ‘multi-agency’ approach is proving to be inadequate to tackle the pressing need for finance of agricultural extension services. In order to fund the development of a wide range of allied activities, the issue is how to channel the resources of commercial banks, especially public sector banks (PSBs) in a sustainable and viable fashion.
6.139 A review of the performance of agricultural credit in India reveals that though the overall flow of institutional credit increased over the years, still substantial gaps persist in rural financial markets. These gaps relate to scarce provision of formal agricultural credit to small farmers and perhaps the inadequate medium and long-term lending. Furthermore, the extant legal framework and some issues relating to tenancy laws have also hampered the flow of credit and the development of strong and efficient agricultural credit institutions. The specific needs of the agricultural sector for financial services demand a broader systemic approach. There is need to understand the extent of availability and distribution of productive resources, along with their distribution, legal and social structures governing their use, cropping patterns, current and emerging technologies and dynamics of rural markets, among others, to gauge the credit requirements. This would improve the flow of credit to agriculture, especially small farmers. However, it also needs to be noted that it is difficult to estimate the true needs for agricultural credit, though studies generally tend to show a strong correlation between rural financial market development and high agricultural growth. A critical determinant for agricultural credit is the commercialisation of subsistence farmers. Development of efficient marketing system, among others, would result in the commercialisation of subsistence farmers by providing outlets and incentives for increased production (Mohan, 2006). Hence, agricultural credit can act as a facilitator but, by itself, cannot make a significant impact on agricultural growth unless critical issues related to rural agricultural infrastructure and institutions are addressed.
To Improve the Sustainability of Credit to Agriculture by Creating Enabling Conditions
6.140 Credit is an important input in agriculture activity. However, it will not serve the purpose unless agriculture is made viable. This requires irrigation facilities, rural roads and other infrastructure. A major issue in this context is also the inefficiency in resource use on account of mispricing of inputs such as power, water and credit. There is also a need for a greater market orientation of the sector. Farmers need to be incentivised to adopt market based solutions for input procurement and marketing of output through autonomous co-operatives and other forms of organisations. Further, credit absorption could be considerably enhanced if investment and production credit are integrated and scales of finance used at the district level are reviewed and readjusted in line with the requirements of modern, market-oriented capital intensive agriculture using newer technologies and superior inputs. The need, thus, is to create a favourable environment in which agriculture is sustained as a business and both public and private institutions participate willingly in the provision of financial services to agriculture on a sustainable basis.
Banks Need to Play an Active Role
6.141 Term loans to agriculture in total agricultural credit has registered a significant decline since the early 1990s. This is a matter of concern as this occurred when the share of agriculture credit in total credit also declined (until last few years). The decline is all the more disturbing because the share of overall medium and long-term loans in the portfolio of banks increased sharply in recent years. The deceleration in the growth of long-term loans impairs agricultural borrowers’ credit absorption capacity, which would eventually affect the growth of crop loans as well. The flow of investment credit to agriculture is constrained by high transaction costs, structural deficiencies in the rural credit delivery system, issues relating to credit worthiness, lack of collaterals in view of low asset base of farmers, low volume of loans with associated higher risks and high manpower requirements, among others. Banks might also be more interested in extending short-term credit as it bears low credit risk, entails lower supervision and monitoring costs, and facilitates asset liability management. As the decline in the share of long-term credit to agriculture could have serious implications for investment in agriculture, it is necessary that banks gradually increase the share of medium and long-term funding to agriculture. Significantly, term loans to agriculture increased sharply in 2007 and the need is to sustain this increase.
Need for Increased Support to Small and Marginal Farmers
6.142 Small and marginal farmers constitute the largest segment of farming community. They have no protection against natural calamities and are easily vulnerable. However, the share of small and marginal farmers in total agricultural credit has declined, albeit marginally. One categor y of agricultural loans of considerable bearing to small and marginal farmers is small loans (loans with a credit limit size of up to 2 lakh). On account of the limited ability of small borrowers to manage interest rate risk and for ensuring availability of credit at reasonable rates to small borrowers, interest rate ceiling on small loans up to Rs.2 lakh is linked to BPLR. Banks, in general, have been lending at sub-BPLR rates with the share of sub-BPLR lending around four fifths of total lending at end-March 2007 (RBI, 2007b). While such lending is confined to large creditworthy corporates, the agriculture sector in general is charged BPLR or in some cases higher rates (RBI, 2007a). The decline in the share of small loans in total loans to agriculture in a scenario, where lending of banks is increasingly at sub-BPLR rates, is a cause of concern.
Comprehensive Public Policy on Risk Management in Agriculture
6.143 The Union Finance Minister in the Budget for 2008-09 announced the waiver of direct agriculture loans disbursed by scheduled commercial banks, regional rural banks, co-operative credit institutions and local area banks up to March 31, 2007 and overdue as on December 31, 2007. Under this scheme, for marginal farmers (i.e., holding up to 1 hectare) or small farmers (1-2 hectares), a complete waiver was announced of all eligible loan amounts that were overdue on December 31, 2007 and which remained unpaid until February 29, 2008. In respect of other farmers (more than 2 hectares), a one time settlement (OTS) scheme for all loans that were overdue on December 31, 2007 and which remained unpaid until February 29, 2008 was also announced. Since loans to farmers would be written-off, banks would be required to extend further credit to agriculture to meet the priority sector lending target. The banks would also not be affected as the Government would provide them with compensation. However, for the current debt waiver scheme to lead to a genuine revitalisation of institutional credit, it should be followed up with adequate monitoring, establishment of proper management information systems and well designed products so that banks adequately disburse credit to the agrarian sector in a viable manner. In the long run, it may perhaps be desirable to put in place a comprehensive public policy on risk management in agriculture. Such a policy, among others, could include the following three elements. First, establishing a well articulated, objective and independent assessment of impact of adverse monsoon conditions and appropriate relief to farmers on an assured basis. Second, establishing and implementing liability of suppliers for any shortfall in quality or assured supply in vital inputs such as seeds, pesticides, power and water. Third, gradually eliminating and replacing price-subsidies with outlays on risk mitigation for farmers in the broadest sense.
Ensuring Viability of Agricultural and Rural Institutions through Demand Driven Credit
6.144 The experience of the success of state-owned banks in some other countries such as BRI-UD (Indonesia) in providing rural credit in general and BAAC (Thailand) in providing agricultural credit shows that though the design specifics of agricultural institutions may vary, a combination of decentralised decision-making, efficiency in operations, stress on low cost operations and strong institutional support can result in commercially viable operations, while at the same time be successful in targeting the small and marginal farmers. In both the cases, the emphasis was on a demand-led rather than a supply-led approach. In demand-centric model, the direction of policies would be directed at creating attractive financial products and at the same time encouraging experimentation and adoption of new financial technologies, especially in maintaining cost-effective accurate management information systems. Supply driven credit in India has been less effective in reaching the needy in the agriculture and rural sectors. Therefore, the demand driven focus could be explored in the agricultural sector in India. Under a demand centric approach for credit, deposits and other financial products, the primary focus would be on creating an enabling financial environment in rural areas primarily by a combination of favourable macroeconomic, agriculture and credit sector policies coupled with strong institutional design for their implementation. In order to have an effective coverage of the small and marginal farmers under such an approach, there should exist a decentralised network of branches that work as profit centres. Devising products to suit the specific needs of the farmers, especially on the loan repayment front, is critical. For farmers, timeliness and assured availability of credit is more critical than interest subsidy. In fact, the experiences of a number of microcredit systems have been more or less on this line of thinking.
Financing with Innovative Instruments
6.145 Adoption of innovative financial technologies may lead to improved credit access for farmers. Financial technologies, other than traditional loan finance, that can help in financing agricultural activities include leasing of farm machinery and equipment. The principle of separating the ownership rights from the user rights of an asset has two main potential advantages. First, it substitutes for additional collateral and, second, it may provide tax benefits. Further, inter-linking credit disbursement in cash or kind with output marketing can also be attempted. This would reduce the need for conventional loan collateral and reduce transaction costs related to loan collection, especially in scarcely populated areas. It has been widely used by non-financial institutions like traders, marketing boards, co-operatives and contract farming schemes for providing seasonal inputs on credit to be recovered through deductions from the produce.
Use of Score Carding for Credit Evaluation
6.146 Banks and other rural financial institutions could consider score-carding using limited information obtained from loan application forms. Through it, the financial institution could try to estimate the determinants of successful performance/repayment on agricultural loans from the previous experience; and to use those determinants (in a mechanistic, simple-to-use scoring procedure) to classify the loan applications into three categories: (1) accept, (2) reject, and (3) needs further analysis from a loan officer. This process could be used both to improve the speed and reduce the cost of credit decisions, and to direct loan officer’s time and energy to those credits that need more analysis.
Computerised Land Records
6.147 One of the major constraints in increasing the credit flow to agriculture is the lack of suitable collateral. Most often land is the only asset available with the farmers. However, weak land titling and lack of proper land records prove to be a major impediment in using land as collateral. Availability of computerised land records can go a long way in smoothening the flow of credit to agriculture.
Coordination between Formal and Non-Formal Finance to Agriculture
6.148 There is need for the convergence of both informal and formal institutional arrangements. The challenge is to coordinate a variety of existing viable financial institutions that are client oriented, that mobilise deposits efficiently and provide access to loans to a broad spectrum of farmers, agri-business entrepreneurs and other rural clients due to specific nature of agricultural credit demand. Agricultural lending has a particular term-structure (seasonal and long-term). Accordingly, coordinating the credit flow from both informal and formal credit sectors would promote the agriculture growth.
SME Finance
6.149 SMEs constitute an important segment of the industrial and services sectors in India in view of their significant contribution to employment generation and exports. With the emergence of new activities in the rural segment such as agri-clinics, contract farming and rural housing with forward and backward linkages to SMEs, lending to SMEs is a viable revenue proposition for banks. For this potential to be realised, however, there is a need to increase credit availability to this sector at a reasonable cost. However, as underlined in the previous section, SMEs are not receiving adequate credit from the institutional setup. This needs to change. The following specific suggestions could go a long way in improving the flow of credit to the SME sector.
Growth Clusters
6.150 The use of cluster approach for lending to SMEs has been found to be useful in many countries and even in India as revealed by a number of empirical studies. This method seems to be worth emulating in a bigger way in India. A number of existing SME clusters such as Khadi and Village Industries Commission (KVIC), Ludhiana and Tirupur have enjoyed a measure of success. Lending to recognised SME clusters based on trade record, competitiveness or growth prospects can be encouraged. Encouraging such consolidation and delivering credit through this structure can enhance the bargaining power of SMEs, as well as help lenders reduce transaction costs to access information for better risk assessment and to put monitoring systems in place. Institutions such as CRISIL and IBA could develop a rating mechanism for industrial clusters, which could galvanise SMEs into adopting more efficient business practices and superior quality control and also enable lenders to penetrate the market more effectively.
Role of Credit Information Bureau
6.151 Empirical evidence shows that wider availability of credit histories greatly expands the flow of credit as potential borrowers are no longer tied to their local lenders (Mohan, 2005). Mutual transparency between lenders and borrowers, and between investors and issuers is a key requirement for the actual risk assessment of the borrower. Indeed, transparency is achieved mainly through financial and accounting disclosure. The quality of information emanating from SMEs must be improved and its presentation further harmonised. The maintenance of information and transparency becomes absolutely essential in the context of Basel II norms. Recent initiatives of the Government and the Reserve Bank such as the new legislation aimed at developing credit information bureaus should help in reducing information and transaction costs that should then lead to lower cost of credit to the SME sector. The legislation has already been put in place. The need is to encourage the formation of information bureaus/companies.
Small Business Credit Scoring (SBCS)
6.152 Credit scores have been widely used for many years in consumer credit markets (for instance mortgages, credit cards, and automobile credits) abroad, resulting in low cost, commoditised credits that are often sold into secondary markets, yielding significant growth in consumer credit availability. Banks in developed countries like the US are increasingly using the small business credit scoring (SBCS) technique to evaluate the credit worthiness of SMEs. SBCS used by many financial institutions to evaluate applicants for “micro credits” in developed countries could be tried in India too. Credit information companies/bureaus could also be expected to play a useful role by developing the credit scoring system.
Asset Based Lending
6.153 Providing asset based loans to SMEs are common among commercial banks in the US. The assets include commercial account receivables, inventory, business equipment and machinery, recurring revenue contracts, and commercial real estate. In asset based lending, banks provide SMEs a revolving line of credit based on a percentage of each of the qualifying asset classes. Growing small businesses, medium businesses and large companies can tap their assets for working capital to support growth and help fund through seasonal and cyclical periods or turnaround situations. Funds from asset based finance are used by SMEs for day-to-day operations, or as capital for restructuring/ turnarounds. Asset based loans are generally cost effective and competitive relative to other financial options. SMEs can draw from the ‘line of credit’, whenever needed and pay back to increase availability for future use. Since interest is charged only on the funds drawn, overall it is less expensive than a term loan. SMEs can borrow against their receivables and inventory, and retain control and ownership of their assets along with all credit and collection procedures.
Centralised Information on SMEs
6.154 Risk assessment is essential, and requires the co-operation of the company in order to ensure an appropriate positioning of the exposure on the bank’s risk scale. To overcome the problem of informational opacity which is a major constraint in SMEs access to bank finance, the Banque de France places a set of on-line information services for the use of the banking profession. These “company credit ratings” are assessments of the capacity of companies to meet their financial obligations at a three-year horizon. Companies are rated on the basis of complete accounting documentation. Bank Negara Malaysia has launched an exclusive website for dissemination of information about various policies and awareness about SMEs. It may not be possible for the Reserve Bank to do this job in India, given the number of SMEs in India. However, it is expected that CIBIL or credit information companies which may be set up in future would make such an assessment of the borrowers and provide the information to banks.
Access to Capital Markets through Establishment of SME Stock Exchange
6.155 To facilitate the access to capital markets by the SMEs, in France, the actual listing structure of the equity market was overhauled considerably with the creation of a segment tailored to SMEs. In order to enhance the visibility and attractiveness of mid cap companies among individual and institutional investors, a new range of specific indices were created, and the special status of “small and mid cap expert” was established. In order to provide solutions that best fit the needs of mid cap companies, Euronext1 overhauled the listing structures on all of its markets. In India also, recently initiatives have been undertaken on the lines of European model of alternative stock exchange for SMEs. The Securities and Exchange Board of India (SEBI) has already approved an exchange to enable SMEs to raise capital from the equity market. The SEBI is in the process of putting in place enabling provisions that would facilitate an exchange for the SMEs in the calendar year 2008. A large number of regional stock exchanges also appeared to have expressed interest in such an endeavour. The need, therefore, is to expedite the setting up of an SME exchange. It is reported that the market regulator is likely to initially allow one SME exchange to operate. The global trend is to have a number of exchanges to create competition. Therefore, after gaining some experience, the possibility of creating more SME exchanges could be explored.
Venture Capital Financing
6.156 Venture capital has also a role to play in financing of SMEs (Mohan, 2008). Venture capital financing has played a great role in Silicon Valley in the US, and Canada, particularly financing of high technology sectors, viz., software and communication firms. Consumer retail, bio-medical, semi-conductor, business services are other beneficiary areas of the venture capital funds. Though cost of venture capital financing is comparatively high, it can provide vital capital to innovative high technology based firms.
Infrastructure Financing
Need to Guard Against Asset Liability Mismatch
6.157 The share of medium to long-term loans in total credit of banks has increased sharply in recent years. Data on maturity profile of deposits as mentioned in Chapter IV also suggests that maturity profile of term deposits has changed significantly in favour of short-term deposits, especially up to one year. A part of long-term assets by banks has been funded by infrastructure bonds. Still, however, the changing profile of loans and deposits has serious implications for asset-liability management and banks need to guard against any asset-liability mismatch. One option is to transfer the risk from the balance sheet of the banks to other players in the financial system. With securitisation of loans to the infrastructure sector, whereby the loans are converted into tradable debt securities, banks can effectively deal with the concerns relating to exposure norms and in spreading out of risks associated with financing to infrastructure. Although securitisation in India is allowed, it has not become popular. Efforts, therefore, need to be made to popularise such products. However, in view of the collapse of the mortgage backed securities (MBS) market in United States and its impact on the health of the financial system in particular and the growing realisation that risks were often passed on to those who were least able to understand them, there is a need to take enough precautions to ensure such problems do not arise in India.
Need to Reduce the Dependence of Industry on the Banking Sector
6.158 The industrial sector continues to depend heavily on the banking sector. Although the share of industry in total bank credit has declined, credit intensity of industry has increased. The evidence also suggests that the industrial sector in India is much more dependent on the banking sector in comparison with other countries. Industry, therefore, needs to gradually reduce its dependence on the banking sector so that the requirements of agriculture and SME sector which are unable to tap funds from other sources, could be met by the banking sector.
X. SUMMING UP
6.159 Bank finance continues to be the predominant source of credit for all the major sectors of the economy. The role of the banking sector in providing credit in India has increased due to conversion of two DFIs into banks. The demand for bank credit has also increased on account of sustained high rates of growth of certain sectors of the economy and the emergence of new sources of demand. The pattern of lending and investment operations of banks has evolved in response to changing structure of the economy.
6.160 The behaviour of bank credit since the early 1990s could be broadly categorised into three phases. In the first phase (from 1990-91 to 1995-96), bank credit growth showed an erratic behaviour. In the second phase (from 1996-97 to 2001-02), bank credit declined sharply and remained range bound between 10 to 18 per cent. In this phase, banks increased their investment in Government securities, even as such requirements were brought down gradually. This pattern reflected mainly the risk aversion by the banks due to application of prudential norms and slowdown of the industrial sector. In the third phase (2002-03 to 2006-07), credit growth remained generally robust. The demand for credit in the early part of this phase, which emanated mainly in the form of retail loans, soon turned broad-based, encompassing agriculture, industr y and infrastructure sector. This was partly on account of robust growth of the economy and partly on account of the efforts made by the Reserve Bank to increase the formal credit to agriculture and the SME sector. There are several distinguishing features of this phase. One, household sector emerged as the significant component of bank credit. Two, the share of medium and long-term credit in total credit increased sharply mainly on account of infrastructure projects and credit for housing projects. Three, the credit-GDP ratio increased significantly.
6.161 The share of borrowing by cultivator households from institutional sources in total borrowings declined between 1991 and 2002. However, this was possibly due to increased borrowings for non-productive expenditure. The borrowings by cultivator households from institutional sources during the same period grew at a higher rate between 1991 and 2002. Credit to agriculture by SCBs which had decelerated in the 1990s, showed a significant growth from 2003-04 onwards. The share of credit to agriculture in total bank credit also increased sharply. There was also an increase in priority sector advances to agriculture as percentage of non-food bank credit. As a result, credit intensity of the agricultural sector improved significantly. However, several disconcerting features were also noted. One, the share of long-term loans in total credit to agriculture declined almost consistently between 1991 and 2006; the share in 2006 was less than half of the share in 1991. Outstanding term loans to agriculture, however, showed a significant improvement in 2007. Two, the share of small and marginal farmers in direct finance to farmers, in terms of both number of accounts and loans disbursed to agriculture, showed little perceptible improvement.
6.162 Bank credit to SMEs in India, which decelerated during the period 1994-95 to 2002-03, picked up thereafter. However, despite various policy initiatives, bank credit to SMEs has not been in consonance with the significance and needs of this sector. Bank credit has been the most important source of finance for SMEs the world over. SMEs are informationally opaque, the factor which has constrained their smooth access to bank credit. In order to sustain credit growth in the economy, it is necessary that various constraints on the flow of credit to agriculture and SMEs are removed.
6.163 In order to increase the credit flow to agriculture, it is necessary that enabling conditions are created so that agriculture becomes a sustainable business and public and private institutions willingly par ticipate in lending to agriculture. There is also a need for a comprehensive public policy on risk management in agriculture. Supply driven credit, which is being followed at present in India and several other countries, has not been so effective. Therefore, some countries have focused on demand-centric approach. Under this model, the focus is on creating innovative financial products to suit the requirements of borrowers. The demand centric approach could also be explored in the agricultural sector in India. Since land is the only asset available with farmers, it is necessary to computerise the land records to facilitate the use of land as collateral. For the SME sector, there is a need to encourage clusters, which can enhance the bargaining power of SMEs as well as help lenders to reduce the transaction costs to access information. There is also a need to explore asset based financing for the SME sector in India. It is a more cost effective financing option than term loans.
6.164 In India, the industry continues to rely heavily on the banking sector. The industry needs to gradually reduce its dependence on the banking sector so that banks could meet the growing requirements of agriculture and SMEs, which cannot fund their requirements from other sources.
6.165 It is evident that banks in India have played a crucial role in the development process of the country. However, some gaps still remain which need to be filled for the growth process to be more sustainable and equitable. For the banking system to nurture innovation and growth, its risk assessment practices need to improve while transaction costs need to be reduced. Greater availability of credit histories and credit information should help in this regard. All these will lead to better capacity in the financial system to take informed credit decisions. The issue is basically one of informed r isk management in terms of segregating more risky from less risky credits and finding appropriate ways of financing them (Mohan, 2008).
1 An empirical exercise on the relationship between non-food credit (NFC) and level of deposits, specifically time deposits (TD), interest rates, as captured by the commercial paper rate (CP), output gap (OG), non-performing assets of banks (NPAs) and asset prices as captured by the BSE Sensex (BSE) was attempted for the period between April 1996 to March 2006 based on monthly data. The output gap was computed using HP-filter and the equation was estimated in the first difference form.
| DNFC = 20922.50 + 0.71DTD - 891.11CP + 0.18OG - 0.20GNPA + 2.00DBSE |
(9.6)* |
(-3.5)* |
(3.4)* |
(-2.2)* |
(1.1) |
Adjusted R Square =0.49 D.W.=2.12
Figures in brackets are t-values and *denotes significance at 5 per cent level.
The results indicate that time deposits, lending interest rate and non-performing assets were the significant factors determining the credit of scheduled commercial banks. Non-food credit offtake was seen to be pro-cyclical in nature, as credit advances were positively related to the output gap.
2 The repo rate was further increased by 150 basis points in various stages to 9.00 per cent by July 2008 from 7.50 per cent in March 2007. The CRR was raised by 275 basis points in various stages from 6.00 per cent in March 2007 to 8.75 per cent in July 2008. The CRR is to be increased further by 25 basis points to 9.00 per cent from August 30, 2008.
3 Based on data provided in the Handbook of Statistics on the Indian Economy, 2006-07.
4 Agricultural credit advanced directly to the beneficiary/borrower by institutions such as co-operatives, scheduled commercial banks (including regional rural banks) and State Governments.
5 Indirect finance for agriculture by SCBs comprises loans advanced for storage and market yards and for setting up of other agricultural allied activities. Unlike in the case of direct finance, which is issued directly to the borrower, in case of indirect finance, it is normally routed through some other agency/conduit/ tier.
6 Term loans in Basic Statistical Returns of Scheduled Commercial Banks in India are divided into medium and long-term loans. While medium-term loans represent loans granted for a period above 1 year and up to 3 years, long-term loans represent loans granted for above 3 years.
7 Short-term credit includes cash credit, overdraft, demand loans, packing credit, export trade bills purchased and discounted, export trade bills advanced against, advances against export cash incentives and duty drawback claims, inland bills purchased and discounted (trade and others), advances against import bills and foreign currency cheques/TCs/DDs/TTs/MTs purchased.
8 Report of the Expert Group on Agricultural Indebtedness, 2007.
9 1. The small loan credit limit size classes were inflated using GDP deflator with 1999-2000 as the base year. For example, in the case of the Rs.25,000 credit limit size class, the revised figures were Rs.25,880 for 2001, Rs.28,780 for 2004 and Rs.31,374 for 2006.
2. In order to obtain the number of loan accounts and amount outstanding corresponding to the inflation adjusted small loan credit limit size classes, linear interpolation was applied on the available data. |
 IST,
IST,


