RbiSearchHeader

Press escape key to go back

Past Searches

Theme
Theme
Text Size
Text Size
S2

RbiAnnouncementWeb

RBI Announcements
RBI Announcements

Asset Publisher

83681064

Results of the Survey of Professional Forecasters on Macroeconomic Indicators - 32nd Round

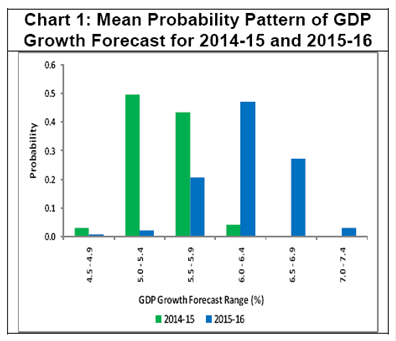
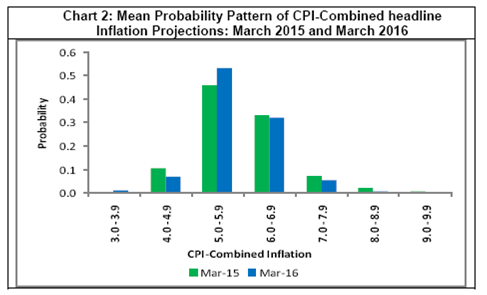
The Reserve Bank has been conducting the Survey of Professional Forecasters since September 2007. The results of the survey represent views of the respondent forecasters and in no way reflect the views or forecasts of the Reserve Bank of India.

Twenty Seven professional forecasters participated in the latest survey round conducted in January 2015. The results of the survey in tabular form are presented in the Annex.

Highlights:

1. Annual Forecasts^:

  • Forecasters expect real GDP (at factor cost) to increase by 5.4 per cent in 2014-15. Growth forecast in ‘Agriculture & Allied Activities’ and ‘Services’ is seen to improve further to 2.1 per cent and 7.0 per cent, respectively, from the previous round. However, ‘Industry’ growth forecast is revised downward by 30 basis points (bps) to 3.1 per cent from 3.4 per cent in the previous round (Table 1).

  • In 2015-16, GDP is expected to grow by 6.4 per cent as per the forecasters’ latest assessment. ‘Services’ is expected to grow by 7.5 per cent.

  • In terms of subjective probabilities assigned to growth forecasts, forecasters ascribed maximum 50 per cent probability that GDP growth in 2014-15 will be in the range of 5.0-5.4 per cent, and another 43 per cent probability that it will be in the range of 5.5-5.9 per cent (Chart 1). For the year 2015-16, GDP growth in 6.0-6.4 per cent range is the most probable outcome.

Table 1: Median Forecast of Real GDP (Growth Rate) for 2014-15 and 2015-16
  2014-15 2015-16
Real GDP 5.4
(-0.1)
6.4
(-0.1)
Agriculture and Allied Activities 2.1
(+0.3)
3.0
(-0.5)
Industry 3.1
(-0.3)
5.0
(-0.3)
Services 7.0
(+0.1)
7.5
(0.0)
Note: 1. Growth rates are in per cent.
2. Figures in parentheses are change in forecasts from the previous survey round.
3. These footnotes are valid for all tables.

  • Private final consumption expenditure (PFCE) at current prices is expected to grow by 12.0 per cent in 2014-15 and further by 12.9 per cent in 2015-16 (Table 2).

  • Forecasters’ expect Gross Fixed Capital Formation rate at 28.7 per cent of GDP in 2014-15, and at 29.7 per cent of GDP in 2015-16 (Table 2).

  • Gross Domestic Saving rate is projected at 30.7 per cent of GDP in 2014-15 and is expected to improve to 31.3 per cent of GDP in 2015-16 (Table 2).

Table 2: Median Forecast of PFCE and Capital Formation
  2014-15 2015-16
Private final consumption expenditure 12.0
(-0.2)
12.9
(-0.1)
Gross Domestic Saving Rate (per cent of GDP) 30.7
(0.0)
31.3
(-0.7)
Gross Fixed Capital Formation Rate (per cent of GDP) 28.7
(-1.1)
29.7
(-1.0)
  • Both money supply and bank credit growth expectations witnessed marginal moderation in this round. While money supply (M3) is expected to grow by 13.2 per cent in 2014-15 and further by 14.0 per cent in 2015-16, bank credit is expected to grow by 13.9 per cent in 2014-15 and further by 15.0 per cent in 2015-16 (Table 3).

  • Yield of 91-Days Treasury Bills is expected to be at 8.0 per cent and 7.3 per cent at end March 2015 and March 2016, respectively (Table 3).
Table 3: Median Forecasts for Select Monetary, Banking and Financial Market Variables
  2014-15 2015-16
Money Supply (M3) 13.2
(-0.3)
14.0
(-0.5)
Bank Credit 13.9
(-0.1)
15.0
(0.0)
Yield of 91-Days Treasury Bills (per cent) 8.0
(-0.2)
7.3
(-0.5)
  • Central Government’s gross fiscal deficit (GFD) is projected at 4.1 per cent of GDP in 2014-15 and is expected to moderate further to 3.8 per cent of GDP in 2015-16. The combined GFD of Central and State Governments is expected to be at 6.6 per cent of GDP in 2014-15 and is expected to improve to 6.0 per cent of GDP in 2015-16 (Table 4).
Table 4: Median Forecast of Fiscal Deficit
  2014-15 2015-16
Central Government Gross Fiscal Deficit (per cent of GDP) 4.1
(0.0)
3.8
(0.0)
Combined Gross Fiscal Deficit  (per cent of GDP) 6.6
(0.0)
6.0
(-0.3)
  • Merchandise Exports growth is likely to be 4.5 per cent in 2014-15, a 140 bps downward revision from 5.9 per cent in the previous round. Growth of merchandise exports is expected to improve to 7.2 per cent in 2015-16 (Table 5).

  • Current Account Deficit is projected at 1.6 per cent and 1.8 per cent (of GDP) in 2014-15 and 2015-16, respectively. Capital Account Balance is expected at 3.4 per cent of GDP for 2014-15 (Table 5).

Table 5: Median Forecasts for Select External Sector Variables
  2014-15 2015-16
Merchandise Exports (growth rate in per cent) 4.5
(-1.4)
7.2
(-2.2)
Merchandise Imports (growth rate in per cent) 3.4
(-1.0)
6.4
(-3.2)
Current Account Balance (per cent of GDP) -1.6
(+0.1)
-1.8
(+0.1)
Capital Account Balance (per cent of GDP) 3.4
(0.0)
3.1
(-0.2)

2. Quarterly Forecasts:

  • Forecasts of GDP growth in coming quarters witnessed downward revision between 20 bps to 30 bps from the previous round. Real GDP growth is expected to improve gradually from Q3: 2014-15 to Q3:2015-16 and is likely to grow by over 6.0 per cent from Q1:2015-16. Services sector is expected to grow by over 7.0 per cent from Q4: 2014-15 (Table 6).
Table 6: Median Forecast of Real GDP growth from Q3:2014-15 to Q3:2015-16
  Q3:14-15 Q4:14-15 Q1:15-16 Q2:15-16 Q3:15-16
Real GDP 5.2
(-0.2)
5.6
(-0.2)
6.0
(-0.2)
6.2
(-0.3)
6.5
Agriculture and Allied Activities 1.0
(0.0)
1.5
(-0.2)
3.0
(-0.5)
3.0
(-0.7)
3.6
Industry 2.5
(-1.3)
3.8
(-0.1)
4.0
(-0.2)
4.5
(0.0)
5.1
Services 6.9
(-0.1)
7.0
(-0.2)
7.3
(-0.2)
7.4
(-0.1)
7.6
  • For inflation, forecast path in the current round is significantly lower than the previous round for both CPI and WPI.

  • For Q4:2014-15, forecast of headline CPI (Combined) inflation is revised downward by 100 bps to 5.9 per cent from 6.9 per cent in the previous round. CPI inflation is expected to increase to 6.0 per cent in Q3:2015-16 (Table 7).

  • In line with the headline inflation, the forecasters also revised downward the forecast of core CPI (defined as excluding food and fuel) from the previous round. However, it is expected to increase gradually from 5.1 per cent in Q4:2014-15 to 5.3 per cent in Q3:2015-16 (Table 7).

  • Revision in WPI headline inflation forecast in this round is much sharper to the tune of 250 bps to 270 bps from the previous round. WPI inflation is expected at 1.3 per cent in Q4:2014-15, which is likely to increase to 3.6 per cent in Q3:2015-16 (Table 7).
Table 7: Median Forecast of Inflation from Q4:2014-15 to Q3:2015-16
  Q4:14-15 Q1:15-16 Q2:15-16 Q3:15-16
CPI (Combined) headline 5.9
(-1.0)
5.7
(-0.9)
5.3
(-0.8)
6.0
Core CPI (Combined) (excluding food & fuel) 5.1
(-0.5)
5.1
(-0.5)
5.2
(-0.1)
5.3
WPI headline 1.3
(-2.7)
1.6
(-2.6)
1.5
(-2.5)
3.6
  • Forecasters assigned maximum probability of 0.46 that CPI headline inflation will be in the range 5.0-5.9 per cent in March 2015 (Chart 2). For March 2016 also, the forecasters assigned maximum probability of 0.53 that CPI inflation will be in the range of 5.0-5.9 per cent.
  • The Indian Rupee is expected to remain stable against the US Dollar within the range of ` 62.50/$ to ` 63.85/$ till end Q3:2015-16 (Annex Table A.3).

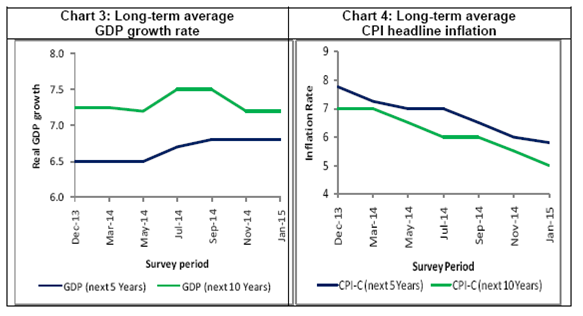
3. Long Term Forecasts:

  • Average real GDP growth for the next five years and the next ten years remained unchanged at 6.8 per cent and 7.2 per cent, respectively, from the previous round (Chart 3).

  • The average CPI inflation forecast for the next five years and ten years has been cut by 20 bps and 50 bps to 5.8 per cent and 5.0 per cent, respectively (Chart 4). Over the next five and ten years, WPI headline inflation is expected at 4.0 per cent.


Annex

Table A.1: Annual Forecasts for 2014-15
  Key Macroeconomic Indicators Annual Forecasts for 2014-15
Mean Median Max Min
1 Real GDP at factor cost (growth rate in per cent) 5.4 5.4 5.7 5.0
a Agriculture & Allied Activities (growth rate in per cent) 2.1 2.1 3.6 0.5
b Industry (growth rate in per cent) 3.0 3.1 3.9 1.9
c Services (growth rate in per cent) 7.1 7.0 8.0 6.6
2 Private Final Consumption Expenditure at current market price (growth rate in per cent) 12.0 12.0 14.0 10.6
3 Gross Domestic Saving (per cent of GDP) 30.4 30.7 31.1 29.0
4 Gross Fixed Capital Formation (per cent of GDP) 29.1 28.7 32.4 27.2
5 Money Supply (M3) (growth rate in per cent) 13.2 13.2 16.0 11.4
6 Bank Credit of Scheduled Commercial banks (growth rate in per cent) 13.4 13.9 16.0 11.4
7 Combined Gross Fiscal Deficit (per cent of GDP) 6.4 6.6 6.8 6.1
8 Central Government Gross Fiscal Deficit (per cent of GDP) 4.2 4.1 4.4 4.1
9 Repo Rate(end period) 7.74 7.75 8.00 7.50
10 CRR (end period) 4.00 4.00 4.00 4.00
11 Yield of 91-Days Treasury Bills (end period) 7.9 8.0 8.6 7.3
12 YTM of Central Govt. Securities with term to maturity of 10-years (end period) 7.9 7.9 8.5 7.4
13 Overall Balance of Payments (in US $ bn.) 35.9 36.4 58.5 4.5
14 Merchandise Exports (in US $ bn.) 334.2 333.0 360.0 322.0
15 Merchandise Exports (growth rate in per cent) 5.0 4.5 12.9 1.0
16 Merchandise Imports (in US $ bn.) 484.0 479.6 548.0 462.0
17 Merchandise Imports (growth rate in percent) 3.7 3.4 12.6 -1.0
18 Merchandise Trade Balance (per cent of GDP) -7.3 -7.3 -6.5 -8.8
19 Net Invisible Balance (in US $ bn.) 119.1 114.3 212.0 110.0
20 Current Account Balance (in US $ bn.) -34.0 -34.0 -23.0 -50.6
21 Current Account Balance (per cent of GDP) -1.6 -1.6 -0.9 -2.6
22 Capital Account Balance (in US $ bn.) 71.0 70.4 92.5 55.0
23 Capital Account Balance (per cent of GDP) 3.3 3.4 4.4 2.0

Table A.2: Annual Forecasts for 2015-16
  Key Macroeconomic Indicators Annual Forecasts for 2015-16
Mean Median Max Min
1 Real GDP at factor cost (growth rate in per cent) 6.4 6.4 6.8 5.9
a Agriculture & Allied Activities (growth rate in per cent) 3.3 3.0 4.6 1.4
b Industry (growth rate in per cent) 4.9 5.0 6.6 3.1
c  Services (growth rate in per cent) 7.5 7.5 8.2 6.9
2 Private Final Consumption Expenditure at current market price (growth rate in per cent) 12.9 12.9 15.0 10.9
3 Gross Domestic Saving (per cent of GDP) 31.3 31.3 32.5 29.5
4 Gross Fixed Capital Formation (per cent of GDP) 29.8 29.7 32.0 27.0
5 Money Supply (M3) (growth rate in per  cent) 14.4 14.0 17.0 11.0
6 Bank Credit of Scheduled Commercial banks (growth rate in per cent) 15.2 15.0 19.4 13.0
7 Combined Gross Fiscal Deficit (per cent of GDP) 6.1 6.0 6.8 5.7
8 Central Government Gross Fiscal Deficit (per cent of GDP) 3.8 3.8 4.0 3.5
9 Repo Rate(end period) 7.15 7.25 7.50 6.50
10 CRR (end period) 4.00 4.00 4.00 4.00
11 Yield of 91-Days Treasury Bills (end period) 7.4 7.3 8.1 7.0
12 YTM of Central Govt. Securities with term to maturity of 10-years (end period) 7.4 7.5 8.0 6.7
13 Overall Balance of Payments (in US $ bn.) 36.3 33.7 68.8 5.0
14 Merchandise Exports (in US $ bn.) 355.7 353.0 414.0 317.0
15 Merchandise Exports (growth rate in per cent) 7.1 7.2 15.0 -1.0
16 Merchandise Imports (in US $ bn.) 512.2 506.9 615.0 453.0
17 Merchandise Imports (growth rate in per cent) 6.1 6.4 12.0 -2.0
18 Merchandise Trade Balance (per cent of GDP) -7.0 -7.0 -5.1 -8.4
19 Net Invisible Balance (in US $ bn.) 125.8 119.7 218.0 111.5
20 Current Account Balance (in US $ bn.) -36.6 -38.6 -5.7 -54.2
21 Current Account Balance (per cent of GDP) -1.7 -1.8 -0.2 -2.6
22 Capital Account Balance (in US $ bn.) 72.6 72.8 93.0 58.7
23 Capital Account Balance (per cent of GDP) 3.2 3.1 4.2 2.6

Table A.3: Quarterly Forecasts from Q3:2014-15 to Q3:2015-16
   Key Macroeconomic Indicators Quarterly Forecasts
Q3: 2014-15 Q4: 2014-15
Mean Median Max Min Mean Median Max Min
1 Real GDP at factor cost (growth rate in per cent) 5.1 5.2 5.8 4.3 5.6 5.6 6.4 5.2
a Agriculture & Allied Activities (growth rate in per cent) 1.3 1.0 3.5 -2.0 1.6 1.5 3.6 -0.9
b Industry (growth rate in per cent) 2.6 2.5 4.3 0.6 3.7 3.8 5.4 1.7
c Services (growth rate in per cent) 7.0 6.9 7.8 6.5 7.1 7.0 7.9 6.5
2 Index of Industrial Production (growth rate in per cent) 1.7 1.0 4.7 0.0 3.4 3.3 5.6 1.5
3 Private Final Consumption Expenditure (growth rate in per cent) 10.8 10.7 12.4 9.3 11.7 11.3 13.1 10.9
4 Gross Fixed Capital Formation (per cent of GDP) 29.0 28.7 31.3 27.0 29.8 29.7 31.8 28.5
5 ` per US Dollar (RBI reference rate-end period) - - - - 62.48 62.50 64.56 60.00
6 Repo Rate (end period) - - - - 7.68 7.75 7.75 7.50
7 CRR (end period) - - - - 4.00 4.00 4.00 4.00
8 Merchandise Export (in US$ bn.) 80.6 80.0 87.2 77.5 83.7 85.2 89.1 77.3
9 Merchandise Import (in US$ bn.) 120.2 120.0 127.4 114.0 116.1 116.9 125.5 104.0
10 Indian Crude Oil basket Price (in US$ per barrel) - - - - 47.4 48.0 55.0 40.0

  Key Macroeconomic Indicators Quarterly Forecasts
Q1: 2015-16 Q2: 2015-16 Q3: 2015-16
Mean Median Max Min Mean Median Max Min Mean Median Max Min
1 Real GDP at factor cost (growth rate in per cent) 5.9 6.0 6.8 5.3 6.2 6.2 6.7 5.5 6.5 6.5 7.2 5.8
a Agriculture & Allied Activities (growth rate in per cent) 2.8 3.0 4.6 0.6 2.9 3.0 5.0 0.6 3.8 3.6 6.0 1.7
b Industry (growth rate in per cent) 4.0 4.0 6.1 2.1 4.6 4.5 7.0 3.2 5.0 5.1 6.9 3.6
c Services (growth rate in per cent) 7.3 7.3 7.8 6.7 7.2 7.4 7.9 6.3 7.6 7.6 8.9 7.0
2 Index of Industrial Production (growth rate in per cent) 3.8 3.8 6.5 1.8 4.1 4.2 6.3 2.0 5.0 4.7 6.1 4.3
3 Private Final Consumption Expenditure (growth rate in per cent) 12.3 12.3 13.1 11.5 12.1 11.8 15.0 10.1 13.0 13.1 15.5 10.2
4 Gross Fixed Capital Formation (per cent of GDP) 30.4 30.0 32.4 28.6 30.5 30.5 32.2 28.7 30.3 30.5 31.5 28.7
5 ` per US Dollar (RBI reference rate-end period) 63.09 63.05 65.35 59.50 63.19 63.00 65.65 60.00 63.92 63.85 67.00 60.00
6 Repo Rate (end period) 7.49 7.50 7.75 7.25 7.41 7.50 7.50 7.25 7.32 7.25 7.50 7.00
7 CRR (end period) 4.00 4.00 4.00 4.00 4.00 4.00 4.00 4.00 4.00 4.00 4.00 4.00
8 Merchandise Export (in US$ bn.) 81.9 80.5 90.9 76.6 84.6 83.8 91.1 81.5 86.0 84.2 95.2 80.5
9 Merchandise Import (in US$ bn.) 116.8 119.3 122.1 107.8 123.0 123.8 128.3 117.5 127.6 125.6 137.7 123.3
10 Indian Crude Oil basket Price (in US$ per barrel) 53.1 51.3 60.0 50.0 59.3 60.0 65.0 50.0 63.6 63.5 70.0 58.0

Table A.4: Forecasts of CPI-Combined Inflation
  CPI Combined Headline Core CPI Combined
(excluding food & fuel)
Mean Median Max Min Mean Median Max Min
Q4:2014-15 5.9 5.9 6.9 4.0 5.2 5.1 6.0 4.5
Q1:2015-16 5.7 5.7 6.5 4.9 5.1 5.1 5.9 4.6
Q2:2015-16 5.4 5.3 6.3 3.7 5.0 5.2 6.0 4.2
Q3:2015-16 5.9 6.0 7.4 4.6 5.3 5.3 6.1 4.5

Table A.5: Forecasts of WPI Inflation
  WPI Headline WPI-Manufactured Products
Mean Median Max Min Mean Median Max Min
Q4:2014-15 1.4 1.3 3.0 0.3 1.8 2.0 2.3 0.5
Q1:2015-16 1.3 1.6 2.1 0.0 2.0 2.1 3.0 0.2
Q2:2015-16 1.4 1.5 2.9 -0.3 2.4 2.3 3.9 0.3
Q3:2015-16 3.3 3.6 4.9 1.3 3.2 3.1 4.7 0.9

Table A.6: Mean probabilities attached to possible outcomes of real GDP growth
Growth Range Forecasts for 2014-15 Forecasts for 2015-16
Below 2.0 per cent 0 0
2.0 to 2.4 per cent 0 0
2.5 to 2.9 per cent 0 0
3.0 to 3.4 per cent 0 0
3.5 to 3.9 per cent 0 0
4.0 to 4.4 per cent 0 0
4.5 to 4.9 per cent 0.03 0.01
5.0 to 5.4 per cent 0.50 0.02
5.5 to 5.9 per cent 0.43 0.21
6.0 to 6.4 per cent 0.04 0.47
6.5 to 6.9 per cent 0 0.27
7.0 to 7.4 per cent 0 0.03
7.5 to 7.9 per cent 0 0
8.0 to 8.4 per cent 0 0
8.5 to 8.9 per cent 0 0
9.0 to 9.4 per cent 0 0
9.5 to 9.9 per cent 0 0
10.0 per cent or more 0 0

Table A.7: Mean probabilities attached to possible outcomes of CPI-Combined inflation
Inflation Range Forecasts for March 2015 Forecasts for March 2016
Below 0 per cent 0 0
0 to 0.9 per cent 0 0
1.0 to 1.9 per cent 0 0
2.0 to 2.9 per cent 0 0
3.0 to 3.9 per cent 0 0.01
4.0 to 4.9 per cent 0.11 0.07
5.0 to 5.9 per cent 0.46 0.53
6.0 to 6.9 per cent 0.33 0.32
7.0 to 7.9 per cent 0.07 0.06
8.0 to 8.9 per cent 0.02 0.01
9.0 to 9.9 per cent 0.01 0
10.0 to 10.9 per cent 0 0
11.0 to 11.9 per cent 0 0
12.0 to 12.9 per cent 0 0
13.0 to 13.9 per cent 0 0
14.0 per cent or above 0 0

Table A.8: Mean probabilities attached to possible outcomes of WPI inflation
Inflation Range Forecasts for March 2015 Forecasts for March 2016
Below 0 per cent 0.02 0
0 to 0.9 per cent 0.24 0.01
1.0 to 1.9 per cent 0.29 0.16
2.0 to 2.9 per cent 0.26 0.21
3.0 to 3.9 per cent 0.12 0.34
4.0 to 4.9 per cent 0.05 0.17
5.0 to 5.9 per cent 0.01 0.06
6.0 to 6.9 per cent 0 0.03
7.0 to 7.9 per cent 0 0.01
8.0 to 8.9 per cent 0 0
9.0 to 9.9 per cent 0 0
10.0 to 10.9 per cent 0 0
11.0 to 11.9 per cent 0 0
12.0 to 12.9 per cent 0 0
13.0 to 13.9 per cent 0 0
14.0 per cent or above 0 0

Table A.9: Annual Average Percentage Change
  Annual average percentage change over the next five years Annual average percentage change over the next ten years
Mean Median Max Min Mean Median Max Min
Real GDP 6.8 6.8 7.3 6.0 7.2 7.2 8.0 6.5
CPI 5.7 5.8 7.2 5.0 5.3 5.0 7.0 4.0
WPI 4.1 4.0 5.7 2.8 4.1 4.0 5.4 2.9

1 Data for the previous survey round were released on December 2, 2014 on the RBI website.

^ Median of forecasts of the respondents.

RbiTtsCommonUtility

प्ले हो रहा है
వినండి

Related Assets

RBI-Install-RBI-Content-Global

RbiSocialMediaUtility

భారతీయ రిజర్వ్ బ్యాంక్ మొబైల్ అప్లికేషన్‌ను ఇన్‌స్టాల్ చేయండి మరియు తాజా వార్తలకు త్వరిత యాక్సెస్ పొందండి!

Scan Your QR code to Install our app

RbiWasItHelpfulUtility

ఈ పేజీ ఉపయోగకరంగా ఉందా?