RbiSearchHeader

Press escape key to go back

Past Searches

Theme
Theme
Text Size
Text Size
S2

RbiAnnouncementWeb

RBI Announcements
RBI Announcements

Asset Publisher

110355807

Households’ Inflation Expectations Survey

Today, the Reserve Bank released the results of July 2024 round of its bi-monthly inflation expectations survey of households (IESH)1 2. The survey was conducted during July 2-11, 2024 in 19 major cities, with responses from 6,091 urban households. Female respondents accounted for 51.9 per cent of this sample.

Highlights:

  1. Households’ median perception of current inflation rose by 20 basis points (bps) to 8.2 per cent in the latest survey round; their inflation expectations for the three months and one year ahead periods also increased by 20 bps each [Charts 1a and 1b; Table 3].

  2. A larger share of households expects higher general prices and inflation as compared to the May 2024 survey round [Tables 1(a) and 1(b)].

  3. Marginally higher price and inflationary pressures were reported across major product groups [Tables 1(a) and 1(b)].

  4. For one year ahead period, inflation expectations were closely aligned to food prices, housing and cost of services [Table 4].

Chart 1a and 1b

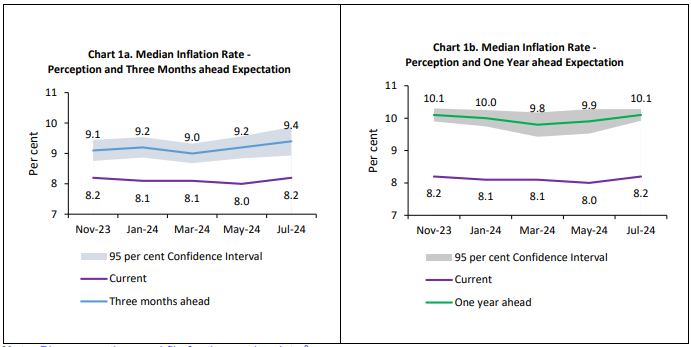
Note: Please see the excel file for time series data.3

Table 1(a): Product-wise Expectations of Prices for Three Months ahead
(Percentage of Respondents)
Survey period ended Jul-23 Jan-24 Mar-24 May-24 Jul-24
General Estimate SE Estimate SE Estimate SE Estimate SE Estimate SE
Prices will increase 80.8 0.86 78.2 0.84 76.5 0.85 80.6 0.81 82.3 0.77
Price increase more than current rate 55.3 1.20 54.4 1.09 53.1 1.08 59.1 1.13 60.5 1.13
Price increase similar to current rate 21.8 0.93 19.5 0.80 18.2 0.79 17.5 0.83 17.3 0.86
Price increase less than current rate 3.6 0.39 4.2 0.43 5.2 0.44 4.0 0.43 4.5 0.48
No changes in prices 16.1 0.79 18.3 0.79 19.6 0.80 16.6 0.77 14.6 0.71
Decline in prices 3.1 0.41 3.6 0.37 3.9 0.38 2.8 0.32 3.1 0.37
Food Product                    
Prices will increase 84.0 0.77 80.2 0.77 76.7 0.81 81.8 0.74 84.2 0.70
Price increase more than current rate 63.5 1.04 59.3 1.00 54.4 1.00 61.0 1.07 62.1 1.03
Price increase similar to current rate 15.5 0.72 15.6 0.72 15.7 0.69 15.3 0.74 16.0 0.75
Price increase less than current rate 5.0 0.44 5.4 0.45 6.6 0.50 5.5 0.46 6.1 0.52
No changes in prices 9.0 0.60 12.3 0.65 15.1 0.68 12.1 0.64 10.2 0.57
Decline in prices 7.0 0.54 7.5 0.51 8.2 0.54 6.1 0.46 5.6 0.47
Non- Food Product                    
Prices will increase 75.5 0.92 74.0 0.85 71.5 0.87 75.0 0.85 77.0 0.81
Price increase more than current rate 52.2 1.16 52.3 1.03 48.9 1.01 53.7 1.11 54.5 1.10
Price increase similar to current rate 18.4 0.80 16.4 0.71 16.2 0.71 15.6 0.72 16.2 0.79
Price increase less than current rate 4.9 0.43 5.2 0.45 6.4 0.48 5.7 0.50 6.2 0.52
No changes in prices 18.3 0.80 18.6 0.76 20.9 0.80 19.3 0.78 17.6 0.74
Decline in prices 6.2 0.54 7.4 0.52 7.7 0.51 5.7 0.43 5.4 0.48
Household Durables                    
Prices will increase 65.8 0.97 65.5 0.93 64.7 0.92 68.2 0.94 68.2 0.97
Price increase more than current rate 45.3 1.12 46.3 1.04 43.8 1.01 48.3 1.10 49.6 1.09
Price increase similar to current rate 15.8 0.75 14.5 0.65 15.5 0.70 15.2 0.74 13.9 0.73
Price increase less than current rate 4.6 0.41 4.7 0.42 5.4 0.44 4.7 0.44 4.7 0.44
No changes in prices 25.0 0.88 25.2 0.85 26.1 0.85 23.4 0.86 23.4 0.88
Decline in prices 9.2 0.60 9.4 0.57 9.2 0.57 8.5 0.53 8.4 0.58
Cost of Housing                    
Prices will increase 76.8 0.94 78.4 0.83 76.9 0.83 80.4 0.81 78.6 0.84
Price increase more than current rate 56.0 1.14 58.2 1.05 55.8 1.07 59.3 1.06 59.6 1.07
Price increase similar to current rate 17.0 0.75 16.1 0.72 16.4 0.74 16.7 0.77 14.8 0.78
Price increase less than current rate 3.7 0.35 4.0 0.41 4.7 0.40 4.3 0.44 4.1 0.45
No changes in prices 20.2 0.88 18.1 0.79 19.6 0.78 16.7 0.77 18.2 0.78
Decline in prices 3.0 0.37 3.6 0.34 3.5 0.36 3.0 0.34 3.2 0.37
Cost of Services                    
Prices will increase 67.7 0.97 65.0 0.93 65.0 0.97 68.6 0.98 71.0 0.95
Price increase more than current rate 47.3 1.13 46.1 1.02 45.5 1.09 49.2 1.12 52.7 1.12
Price increase similar to current rate 15.9 0.72 15.0 0.69 14.4 0.70 14.4 0.68 13.6 0.70
Price increase less than current rate 4.5 0.40 3.8 0.37 5.2 0.45 5.0 0.46 4.6 0.46
No changes in prices 28.2 0.90 30.5 0.91 30.1 0.92 27.3 0.94 25.3 0.90
Decline in prices 4.1 0.43 4.5 0.41 4.8 0.43 4.1 0.39 3.7 0.38
Note:
1. The table provides estimates and standard errors (SE) for qualitative responses.
2. Constituent items may not add up to the corresponding total, due to rounding off.
 
Table 1(b): Product-wise Expectations of Prices for One Year ahead
(Percentage of Respondents)
Survey period ended Jul-23 Jan-24 Mar-24 May-24 Jul-24
General Estimate SE Estimate SE Estimate SE Estimate SE Estimate SE
Prices will increase 88.6 0.68 88.7 0.63 87.4 0.67 89.1 0.64 90.6 0.60
Price increase more than current rate 65.0 1.07 66.3 1.06 64.7 1.08 67.9 1.14 68.6 1.12
Price increase similar to current rate 20.5 0.86 19.1 0.83 18.5 0.83 17.8 0.90 18.3 0.86
Price increase less than current rate 3.1 0.33 3.3 0.36 4.2 0.41 3.5 0.41 3.7 0.43
No changes in prices 8.6 0.57 8.2 0.55 9.7 0.59 7.9 0.56 6.6 0.50
Decline in prices 2.8 0.35 3.0 0.36 2.9 0.35 3.0 0.34 2.9 0.35
Food Product                    
Prices will increase 84.7 0.75 86.4 0.68 84.5 0.73 86.0 0.68 87.1 0.65
Price increase more than current rate 60.6 1.11 63.6 1.03 59.5 1.10 62.8 1.10 63.5 1.09
Price increase similar to current rate 20.1 0.85 18.2 0.77 19.8 0.80 18.3 0.86 19.0 0.84
Price increase less than current rate 4.0 0.38 4.7 0.43 5.2 0.45 4.9 0.49 4.6 0.48
No changes in prices 9.3 0.59 8.7 0.53 10.1 0.61 9.3 0.58 7.9 0.52
Decline in prices 6.0 0.48 4.9 0.43 5.4 0.44 4.7 0.39 5.0 0.43
Non- Food Product                    
Prices will increase 81.6 0.85 82.0 0.80 81.1 0.76 82.1 0.79 82.9 0.77
Price increase more than current rate 57.1 1.16 59.1 1.11 56.3 1.09 59.8 1.13 61.2 1.12
Price increase similar to current rate 20.6 0.83 18.6 0.79 19.5 0.82 17.3 0.80 16.9 0.80
Price increase less than current rate 3.9 0.38 4.4 0.41 5.3 0.47 5.1 0.47 4.8 0.46
No changes in prices 13.5 0.72 13.1 0.66 14.1 0.69 12.9 0.68 12.4 0.64
Decline in prices 4.8 0.48 4.8 0.45 4.8 0.44 5.0 0.44 4.7 0.44
Household Durables                    
Prices will increase 75.8 0.88 74.8 0.84 74.5 0.83 76.8 0.83 77.4 0.83
Price increase more than current rate 53.2 1.10 54.0 1.06 52.3 1.06 56.0 1.12 56.6 1.12
Price increase similar to current rate 18.4 0.80 16.7 0.69 17.3 0.76 16.4 0.79 16.1 0.76
Price increase less than current rate 4.2 0.38 4.1 0.41 5.0 0.45 4.4 0.44 4.8 0.49
No changes in prices 17.7 0.76 18.3 0.75 18.1 0.76 16.6 0.72 16.3 0.73
Decline in prices 6.5 0.48 6.9 0.49 7.4 0.51 6.6 0.47 6.3 0.48
Cost of Housing                    
Prices will increase 86.8 0.69 88.0 0.65 87.2 0.66 89.2 0.64 88.2 0.66
Price increase more than current rate 64.6 1.05 67.7 0.96 65.6 1.01 68.7 1.02 66.6 1.05
Price increase similar to current rate 18.5 0.79 16.7 0.74 17.2 0.74 16.3 0.75 17.7 0.80
Price increase less than current rate 3.8 0.37 3.6 0.40 4.4 0.39 4.2 0.45 3.9 0.43
No changes in prices 10.4 0.60 9.1 0.55 9.5 0.57 8.4 0.57 8.6 0.55
Decline in prices 2.7 0.34 2.9 0.34 3.3 0.36 2.4 0.31 3.2 0.36
Cost of Services                    
Prices will increase 80.9 0.80 79.5 0.78 80.1 0.78 82.1 0.77 83.4 0.76
Price increase more than current rate 57.3 1.12 58.8 1.03 56.3 1.08 58.9 1.13 61.6 1.17
Price increase similar to current rate 19.6 0.83 16.6 0.72 18.9 0.78 18.6 0.83 17.4 0.82
Price increase less than current rate 4.0 0.39 4.1 0.40 4.9 0.45 4.6 0.44 4.4 0.45
No changes in prices 15.5 0.72 17.0 0.72 16.0 0.71 14.7 0.71 13.2 0.67
Decline in prices 3.5 0.37 3.5 0.37 3.9 0.38 3.2 0.34 3.4 0.39
Note:
1. The table provides estimates and standard errors (SE) for qualitative responses.
2. Constituent items may not add up to the corresponding total, due to rounding off.
 
Table 2: Inflation Expectations of Various Groups: Jul-24
  Current Perception Three Months ahead Expectation One Year ahead Expectation
Mean Median Mean Median Mean Median
Estimate SE Estimate SE Estimate SE Estimate SE Estimate SE Estimate SE
Overall 8.9 0.09 8.2 0.12 9.8 0.10 9.4 0.24 9.8 0.11 10.1 0.09
Gender-wise                        
Male 9.1 0.13 8.5 0.18 10.0 0.13 9.7 0.33 10.0 0.15 10.2 0.14
Female 8.8 0.12 8.2 0.17 9.8 0.13 9.4 0.30 9.8 0.16 10.1 0.12
Category-wise                        
Financial Sector Employees 9.5 0.53 8.5 0.82 10.4 0.57 9.9 0.73 10.6 0.64 10.5 0.57
Other Employees 8.9 0.19 8.1 0.25 9.8 0.20 9.4 0.40 9.7 0.23 10.0 0.26
Self Employed 9.2 0.19 8.8 0.33 10.2 0.20 10.1 0.25 10.3 0.23 10.5 0.15
Homemaker 8.9 0.15 8.2 0.20 9.9 0.16 9.5 0.35 9.9 0.19 10.2 0.13
Retired Persons 9.9 0.36 9.1 0.68 10.8 0.33 10.4 0.35 10.6 0.42 10.6 0.78
Daily Workers 9.1 0.24 8.9 0.52 10.0 0.27 9.7 0.45 9.6 0.32 9.8 0.46
Other category 8.0 0.20 6.9 0.22 8.9 0.23 8.0 0.24 9.0 0.27 8.5 0.32
Age Group-wise                        
Up to 25 years 7.9 0.16 7.2 0.19 9.0 0.17 8.4 0.19 9.2 0.20 9.2 0.32
25 to 30 years 8.6 0.19 7.9 0.21 9.6 0.20 9.0 0.36 9.7 0.23 9.9 0.28
30 to 35 years 8.9 0.19 8.4 0.24 10.0 0.21 9.7 0.33 10.1 0.24 10.2 0.19
35 to 40 years 8.9 0.19 8.2 0.28 9.7 0.20 9.1 0.38 9.6 0.24 9.8 0.40
40 to 45 years 9.0 0.21 8.8 0.48 10.0 0.24 10.0 0.34 9.9 0.29 10.3 0.23
45 to 50 years 9.3 0.23 8.8 0.34 10.2 0.25 10.1 0.26 10.0 0.29 10.3 0.18
50 to 55 years 9.3 0.27 9.0 0.64 10.3 0.28 10.1 0.38 9.9 0.34 10.4 0.25
55 to 60 years 9.8 0.34 9.6 0.54 10.6 0.34 10.4 0.26 10.4 0.41 10.6 0.31
60 years and above 9.6 0.27 9.3 0.63 10.6 0.28 10.2 0.30 10.3 0.34 10.4 0.27
City-wise                        
Ahmedabad 7.5 0.31 6.7 0.36 8.5 0.37 7.6 0.32 8.3 0.47 8.1 0.54
Bengaluru 7.2 0.19 6.0 0.20 8.8 0.21 7.9 0.26 9.3 0.25 8.9 0.50
Bhopal 9.0 0.43 8.6 1.09 9.8 0.47 9.6 0.82 8.9 0.54 9.0 0.86
Bhubaneswar 9.2 0.71 8.6 1.53 10.7 0.91 10.5 1.70 10.3 1.02 11.0 1.85
Chennai 9.3 0.37 9.8 0.44 10.3 0.50 10.8 0.66 10.9 0.61 12.0 0.99
Delhi 9.2 0.22 8.6 0.40 10.0 0.24 9.8 0.52 10.0 0.28 10.0 0.42
Guwahati 9.3 0.55 10.0 0.77 9.7 0.65 10.0 0.68 9.8 0.60 10.1 0.84
Hyderabad 7.8 0.28 6.9 0.31 8.8 0.31 8.0 0.29 9.0 0.34 9.1 0.43
Jaipur 7.4 0.47 7.2 0.57 8.2 0.52 7.6 0.69 7.9 0.68 7.7 0.85
Jammu 11.1 0.85 10.1 1.12 9.2 0.82 9.0 1.17 9.4 0.58 9.6 0.88
Kolkata 10.8 0.38 10.4 0.22 11.7 0.37 11.6 0.82 11.5 0.38 12.0 1.04
Lucknow 9.2 0.47 8.3 0.83 9.9 0.47 9.3 0.73 9.7 0.47 9.4 0.71
Mumbai 9.5 0.23 8.6 0.22 10.4 0.21 10.1 0.22 10.0 0.28 10.5 0.16
Nagpur 8.5 0.43 8.0 0.56 9.9 0.51 9.5 0.54 9.8 0.75 10.3 0.52
Patna 7.8 0.52 7.5 0.71 8.6 0.74 8.4 0.74 8.2 0.80 8.4 0.98
Thiruvananthapuram 7.4 0.52 6.9 0.94 8.4 0.65 7.3 1.08 10.3 0.52 10.1 0.64
Chandigarh 10.9 0.60 9.7 0.53 11.7 0.59 10.8 0.85 11.4 0.76 11.0 0.87
Ranchi 8.9 0.38 8.4 0.36 9.3 0.45 8.9 0.52 9.1 0.74 9.4 0.84
Raipur 10.3 0.49 9.8 0.52 11.1 0.60 10.5 0.90 11.2 0.57 10.9 0.78
Note: The table provides estimates and standard errors (SE) for quantitative responses.
 
Table 3: Household Inflation Expectations – Current Perception, Three Months and One Year Ahead Expectations
  Current Perception Three Months ahead Expectation One Year ahead Expectation
Mean Median Mean Median Mean Median
Estimate SE Estimate SE Estimate SE Estimate SE Estimate SE Estimate SE
Jul-23 9.3 0.09 8.9 0.14 10.2 0.09 10.0 0.15 10.0 0.11 10.3 0.07
Jan-24 8.8 0.09 8.1 0.12 9.7 0.09 9.2 0.17 9.6 0.10 10.0 0.13
Mar-24 8.7 0.09 8.1 0.13 9.6 0.09 9.0 0.16 9.5 0.10 9.8 0.19
May-24 8.7 0.10 8.0 0.13 9.8 0.10 9.2 0.19 9.6 0.12 9.9 0.19
Jul-24 8.9 0.09 8.2 0.12 9.8 0.10 9.4 0.24 9.8 0.11 10.1 0.09
Note: The table provides estimates and standard errors (SE) for quantitative responses.
 
Table 4: Households Expecting General Price Movements in Coherence with Movements in Price Expectations of Various Product Groups: Three Months Ahead and One Year Ahead
(Percentage of Respondents)
Survey period ended Food Non-Food Households durables Housing Cost of services
Three Months Ahead
Jul-23 63.1 65.5 60.9 64.5 65.7
Jan-24 65.2 65.4 60.8 64.2 65.8
Mar-24 65.4 66.1 61.2 64.6 66.8
May-24 67.4 67.2 63.2 67.2 68.0
Jul-24 66.3 66.2 61.7 66.3 68.4
One Year Ahead
Jul-23 73.4 73.0 66.9 73.4 73.6
Jan-24 76.5 74.1 67.9 74.9 74.6
Mar-24 74.6 73.6 68.3 75.0 74.2
May-24 76.1 74.5 69.5 76.8 75.0
Jul-24 76.3 74.6 69.6 77.1 76.2
 
Table 5(a): Cross-tabulation of Number of Respondents by Current Inflation Perception and Three Months Ahead Inflation Expectations: Jul-24
Three Months Ahead Inflation Rate (per cent)
Current Inflation Rate (per cent)   <1 1-<2 2-<3 3-<4 4-<5 5-<6 6-<7 7-<8 8-<9 9-<10 10-<11 11-<12 12-<13 13-<14 14-<15 15-<16 >=16 No idea Total
<1 4 2 1 0 0 0 0 0 0 0 0 0 0 0 0 0 0 0 7
1-<2 2 25 17 7 1 1 0 0 0 0 0 0 0 0 0 0 0 0 53
2-<3 0 9 95 66 27 6 2 2 0 0 1 0 0 0 0 0 1 1 210
3-<4 0 2 13 90 62 62 14 2 0 1 1 0 0 0 0 0 0 0 247
4-<5 0 0 9 10 146 75 66 7 6 2 1 0 0 0 0 0 2 0 324
5-<6 0 2 12 33 40 442 194 161 80 13 87 2 1 0 0 3 2 0 1072
6-<7 0 0 1 3 6 12 189 145 82 23 18 1 2 0 0 0 0 0 482
7-<8 0 0 1 2 2 18 8 199 144 68 60 8 12 1 0 3 0 0 526
8-<9 0 0 1 1 1 10 12 7 199 85 144 24 19 4 0 5 1 0 513
9-<10 0 0 0 1 1 1 0 2 4 75 89 49 26 5 3 4 13 0 273
10-<11 0 0 4 4 3 22 6 10 16 7 411 55 206 64 15 238 85 1 1147
11-<12 0 0 0 0 0 0 0 0 0 1 0 16 14 40 3 1 2 0 77
12-<13 0 2 1 0 0 2 0 1 0 0 3 0 32 18 16 24 10 0 109
13-<14 0 0 0 0 0 0 0 0 1 0 1 0 0 6 38 7 1 0 54
14-<15 0 0 1 0 0 0 0 0 0 0 0 1 0 0 4 1 6 0 13
15-<16 0 0 0 0 0 1 0 1 0 1 4 1 3 2 2 61 125 0 201
>=16 0 1 7 1 2 14 0 2 1 0 22 0 0 1 0 29 703 0 783
Total 6 43 163 218 291 666 491 539 533 276 842 157 315 141 81 376 951 2 6091
 
Table 5(b): Cross-tabulation of Number of Respondents by Current Inflation Perception and One Year Ahead Inflation Expectations: Jul-24
One Year Ahead Inflation Rate (per cent)
Current Inflation Rate (per cent)   <1 1-<2 2-<3 3-<4 4-<5 5-<6 6-<7 7-<8 8-<9 9-<10 10-<11 11-<12 12-<13 13-<14 14-<15 15-<16 >=16 No idea Total
<1 3 2 1 1 0 0 0 0 0 0 0 0 0 0 0 0 0 0 7
1-<2 8 15 15 9 2 1 2 0 0 0 1 0 0 0 0 0 0 0 53
2-<3 30 1 44 54 50 17 5 3 0 0 3 0 0 0 0 0 3 0 210
3-<4 23 0 8 43 47 60 38 13 8 0 7 0 0 0 0 0 0 0 247
4-<5 46 0 3 6 62 59 73 25 33 6 9 0 1 0 0 0 1 0 324
5-<6 117 0 4 8 19 237 145 181 105 32 194 3 5 0 1 11 9 1 1072
6-<7 52 0 0 0 3 6 90 109 107 32 58 4 18 0 1 1 1 0 482
7-<8 53 1 0 1 1 4 4 87 108 72 130 20 26 1 6 9 3 0 526
8-<9 46 0 0 0 0 7 3 3 106 68 157 22 58 8 5 21 9 0 513
9-<10 10 0 0 1 0 0 0 3 3 47 67 43 43 22 8 11 15 0 273
10-<11 98 1 0 0 1 12 0 5 10 6 220 36 161 55 27 292 218 5 1147
11-<12 2 0 0 0 0 0 0 0 0 0 1 6 7 23 29 4 5 0 77
12-<13 4 0 0 0 0 0 0 0 1 0 1 0 20 10 23 31 19 0 109
13-<14 1 0 0 0 0 0 0 0 0 0 2 0 1 8 32 7 3 0 54
14-<15 2 0 0 0 0 0 1 0 0 1 0 0 0 0 1 0 8 0 13
15-<16 13 0 0 0 0 0 1 0 0 1 3 0 3 1 1 40 138 0 201
>=16 68 2 5 1 1 6 1 1 1 0 18 0 1 1 1 19 655 2 783
Total 576 22 80 124 186 409 363 430 482 265 871 134 344 129 135 446 1087 8 6091

1 The survey is conducted at bi-monthly intervals by the Reserve Bank; it provides directional information on near-term inflationary pressures as expected by respondents and may reflect their own consumption patterns. Hence, survey results reflect respondents’ views, which are not necessarily shared by the Reserve Bank.

2 All estimates of inflation expectations are given in terms of median, unless stated otherwise.

3 Results of the previous survey round were released on the Bank’s website on June 07, 2024. Unit-level data for previous rounds of the survey are available on the Bank’s ‘Database on Indian Economy’ (DBIE) portal (weblink: https://data.rbi.org.in) under the head ‘Unit-level Data’.

RbiTtsCommonUtility

PLAYING
LISTEN

Related Assets

RBI-Install-RBI-Content-Global

RbiSocialMediaUtility

بھارت موبائل ایپلی کیشن کے ریزرو بینک کو انسٹال کریں اور تازہ ترین خبروں تک فوری رسائی حاصل کریں!

Scan Your QR code to Install our app

RbiWasItHelpfulUtility

یہ صفحہ مددگار تھا؟