III: Own Sources of Revenue Generation in Municipal Corporations: Opportunities and Challenges - RBI - Reserve Bank of India
III: Own Sources of Revenue Generation in Municipal Corporations: Opportunities and Challenges
| Municipal corporations need to augment their own revenue sources for greater operational and financial flexibility. By optimising property and water taxes, increasing non-tax revenues, and adopting transparent governance practices, urban local bodies can improve their finances. Leveraging technologies such as Geographic Information System (GIS) mapping and digital payment systems can enhance property tax collections. Periodic revisions in water and drainage taxes, and fees and user charges, coupled with use of technology for plugging leakages, can also help improve their revenue collections. 1. Introduction III.1 India is urbanising rapidly, with over half the population expected to live in urban areas by 2050.1 Cities have a pivotal role in achieving Sustainable Development Goals (SDGs) and in combating climate change given the concentration of population, physical infrastructure intensity, and energy consumption in urban areas. The challenges posed by global warming, such as depleting water tables and rising temperatures, are becoming particularly acute for cities. The harmful impacts of climate change can be mitigated by switching over to sustainable policies such as enhanced investment in renewable energy, green building initiatives, waste management and energy efficient public transportation systems. III.2 Against this backdrop, augmenting ULBs’ own source revenues becomes crucial, enabling them to tailor fiscal policies and budgets to meet communities’ specific needs and preferences in a timely and effective manner. Transfers received from upper tiers of government often have attached conditionality on their usage.2 Moreover, over-reliance on the transfers can render local bodies vulnerable to sudden changes in government priorities, besides undermining accountability and fiscal discipline. Revenues from user fees for services like waste management, utilities, or recreational facilities can be reinvested to maintain and expand these services, thereby making the local governments more financially and operationally independent and responsive to the needs of the people. III.3 ULBs’ revenue sources are, however, not commensurate with their functional responsibilities. Limited autonomy to adjust tax rates and user charges, staff shortages and poor coverage lead to poor service delivery, lack of innovation in resource mobilisation, lower tax collection and low credibility (Jain et al., 2015; and Nallathiga, 2014). III.4 Against this backdrop, this chapter examines the generation of own-source revenues by municipal corporations (MCs). Section 2 outlines the key components of the MCs’ own-source revenues. Section 3 provides an overview of the recommendations made by various Central Finance Commissions for enhancing these revenue streams. Sections 4 and 5 delve into the primary sources of own-tax and own non-tax revenues, respectively. Finally, section 6 presents some concluding insights. 2. Types of Revenue Sources of ULBs III.5 The total resources of ULBs can be classified under four major categories:3
III.6 While the ratio of own source revenue to total revenue expenditure of MCs across India has improved, the median value remains less than 0.5, implying more than 50 per cent of the MCs cover less than half of their revenue expenses through their own source revenue (Chart III.1a). Own sources of revenue of MCs are inadequate to finance their revenue expenditures in most cases except in Andhra Pradesh, Telangana, and Goa. In others such as Jammu and Kashmir, Arunachal Pradesh, Uttarakhand, Bihar, Uttar Pradesh, Rajasthan, and Odisha, the revenue from own sources covers less than one-third of the total revenue expenditure, resulting in a structural imbalance in their finances (Chart III.1b). 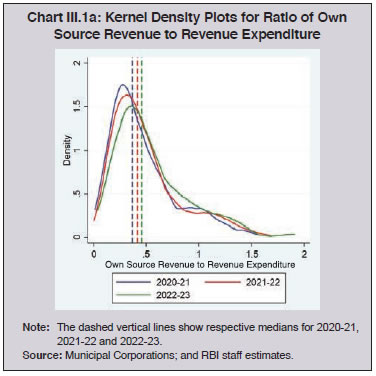
III.7 Own source revenues accounted for an average of 59 per cent of the revenue receipts for MCs during 2020-21 to 2022-23. Own revenues are dominated by tax revenues, with an average share of 47.1 per cent over this three-year period (Chart III.2). III.8 The primary tax revenue source for MCs is property tax, constituting an average of 59.1 per cent of tax revenue during 2020-21 to 2022-23. Other major tax revenues include water tax, sewerage tax, education tax, vehicle tax, and professional tax (Chart III.3). III.9 The growth in revenue earned through property taxes has not been commensurate with the rapid increase in property values in urban centres.4 The lack of a systematic process for listing vacant lands has also hindered comprehensive coverage of taxable properties. Vacant lands often remain untaxed, and the vacant land tax is levied only when owners submit building plans for approval (FC-XIV). Additionally, various taxes like octroi, which were previously under the jurisdiction of MCs, have been subsumed in the GST (Mishra et al., 2018). 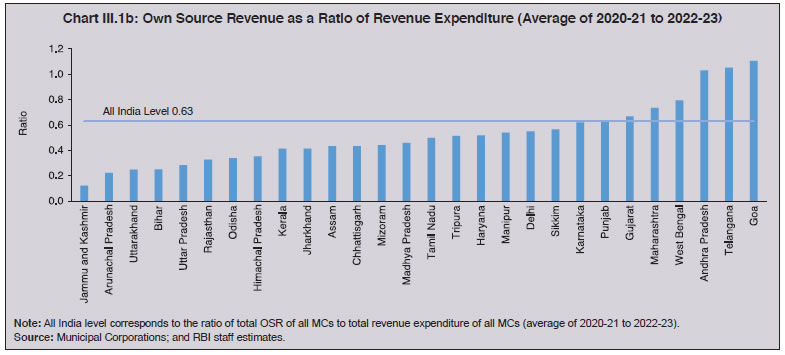
![Chart III.2: Composition of Revenue Receipts and OSR (Average of 2020-21 to 2022-23) [Per cent]](/documents/87730/28909807/03Own13112024_3.jpg)
III.10 The major non-tax revenue sources include user charges, trade licensing fees, layout/building approval fees, development charges, betterment charges, sale and hire charges, market fees, slaughterhouse fees, parking fees, birth and death registration fees. Fees and user charges represent a significant source of revenue for local governments, constituting an average of 35.2 per cent of the OSR in 2020-23. Financing local services with user charges or fees not only generates the necessary revenues to deliver these services, but also offers crucial insights into which services should be provided, the quantity and quality of the services, and the target recipients. This is in contrast with taxes, which are like unrequited transfers and have no direct correlation with the services received by the taxpayers (Bird et al., 2001). Reasonable user charges can enhance efficiency in resource use, equity, cost recovery, and help reduce environmental impacts. However, essential infrastructure services like water and power supply are often underpriced in India (Pratap et al., 2022). Hence, it is crucial and urgent to rationalise the service charges to at least recover the operation and maintenance costs from the beneficiaries (FC-XIV). 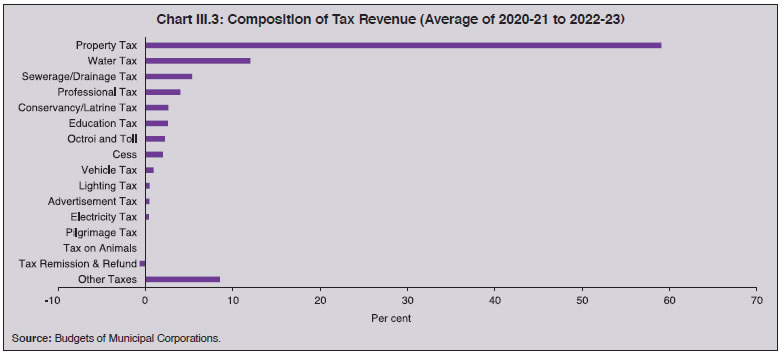
3. Enhancing Own Sources of Revenues III.11 To incentivise own resources, FC-XI and FC-XII assigned weights of 10 per cent and 20 per cent, respectively, to the revenue efforts made by the local bodies while recommending interstate distribution of local body grants. FC-XI also suggested that the rate structure of the user charges be reviewed regularly, with the local bodies having the autonomy to set their own rates. FC-XIII proposed that State governments may share a part of mining royalties with those local bodies from whose jurisdiction such revenues are derived. III.12 FC-XIV recommended performance grants for the local bodies, linked to the availability of audited accounts and an improvement in own revenues. It also suggested a variety of other reforms such as revisions in the property tax system with respect to the base and rates, sharing of land conversion charges with local bodies by State governments, and broadening the scope of entertainment tax5 to include newer forms of entertainment. No entity should be exempt from the tax and non-tax levies that are in the jurisdiction of local bodies. If an exemption is deemed necessary, the affected local bodies should receive compensation for the revenue loss. The Commission also noted the need to explore the municipal bonds market and recommended the setting up of an intermediary to help medium and small municipalities access these markets. III.13 FC-XV highlighted the need to revise the ceiling for professional tax on a priority basis. To augment property tax collections, the Commission recommended the notification of minimum floor rates of property taxes by the relevant State, followed by consistent improvement in the collection of property taxes in tandem with the growth rate of the State’s own gross state domestic product (GSDP) as the entry-level condition for receiving urban local body grants. III.14 Mission AMRUT (Atal Mission for Rejuvenation and Urban Transformation) outlined specific property tax reforms to be undertaken by the States.6 The revenue powers that have already been devolved to the local governments are not being fully utilised. Urgent reforms are needed across all the five stages of the revenue life cycle: enumeration; valuation; assessment or metering (in the case of user charges); billing and collection; and reporting. In this context, the proposal of the Union Budget 2024-25 for digitising the land records in urban areas using Geographic Information System (GIS) mapping can help in maintaining accurate and up-to-date records, thereby improving coverage and accuracy. Mobile applications and online platforms can also be leveraged for improving billing and collection efficiency (World Bank, 2024). States need to revise guidance values or circle rates to align them with prevailing market values.7 MCs’ staff needs to be equipped with skills and knowledge for handling new technologies and processes effectively.8 4.1 Property Tax III.15 The property taxation system in India is intricate, with significant variations in enumeration, valuation, assessment, and collection methodologies across States and cities. In India, there are three main methods for property tax calculation: 1) Capital Value System: Under this system, the tax is assessed as a percentage of the market value of the asset, which is primarily determined by its location, as established annually by the State government and notified. This valuation system is utilised by several MCs in Andhra Pradesh, Jharkhand, Karnataka, Maharashtra, and Telangana. 2) Unit Area Value System: This method calculates the tax based on the built-up area of the property and the price per unit. The price per unit incorporates the property’s expected returns based on usage, land value, and location. The final tax amount is determined by multiplying the per unit price and the total built-up area of the property. The MCs in Delhi, Bihar, Karnataka, Telangana, and West Bengal employ this valuation system. 3) Annual Rental Value System or Rateable Value System: Under this approach, tax is based on the property’s annual rental value, which is assessed by the local authority considering the property’s size, location, condition, and proximity to amenities and landmarks. This value may differ from the actual rent collected on the property, potentially leading to discrepancies. Some cities in Telangana and Tamil Nadu use this method for property tax computation. 4.1.1 Survey on Property Taxation in India III.16 In order to gain insights into the current state of play on property taxation in the country, a primary survey of MCs was conducted during June to August 2024.9 Based on responses from 53 MCs10 across 17 States, the key findings from the survey are set out below: Enumeration and Property Registers III.17 Around 96.2 per cent of the respondent MCs maintain property registers, with 74.5 per cent of them in digital form (Chart III.4). 25.5 per cent of the cities with property registers still rely on manual, paper-based systems for creation and maintenance of property registers. Manual records are often susceptible to errors, in terms of both coverage and accuracy. Additionally, reliance on manual processes may lead to greater discretion among functionaries. For cities with digital property records, 65.8 per cent of the corporations have created them through manual input of data with or without conducting field surveys. This can be prone to human errors, resulting in incomplete and inaccurate records. Only 34.2 per cent of the respondent MCs with digital registers utilise GIS technology. 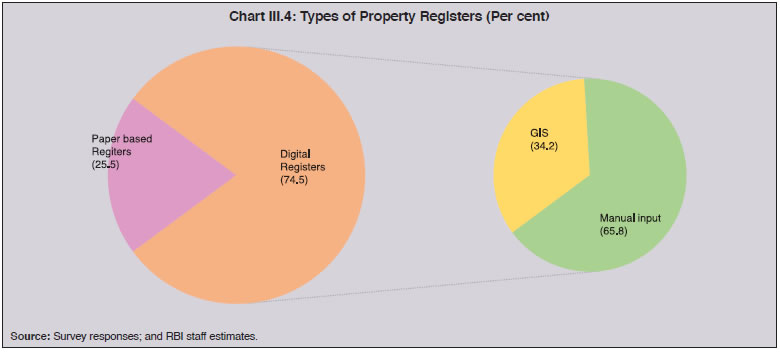
III.18 Overall 24.5 per cent of the respondent MCs have adopted GIS so far and the coverage of properties under GIS in these cities is around 90 per cent (Chart III.5). 62 per cent of the respondent MCs with GIS systems conduct regular field surveys to check the veracity of GIS maps. III.19 Regular updates of existing property records to capture information on new building construction or additions to existing buildings is important for ensuring a comprehensive tax base. Out of the cities maintaining property registers,11 90.2 per cent of them update their property registers on a regular basis, and 84.3 per cent have mechanisms for capturing new construction data. This information is usually collected by the MCs’ own staff, private agencies, or other government departments like town planning departments, development authorities, and valuation control board. For instance, out of the MCs that account for information on new constructions,12 44 per cent employ their own staff, 21 per cent rely on various government departments, while 35 per cent hire private agencies for this purpose. 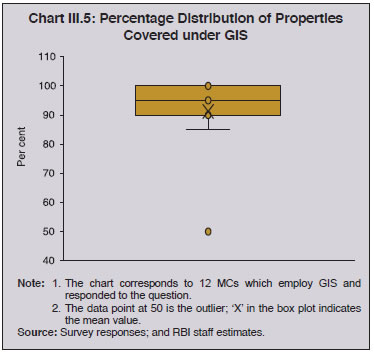
Valuation System Used for Property Tax Calculation III.20 The methods employed for property valuation for the purpose of tax assessment vary across States and cities due to differences in legislative frameworks and practical implementation. Apart from the Capital Value (CV), Unit Area Value (UAV), and Annual Rental Value (ARV) systems, some MCs utilise additional approaches such as the carpet area method, District Level Committee (DLC) rate system, and flat rate system for property valuation (Chart III.6). ARV is adopted by 45 per cent of the respondent corporations. However, this method lacks a clear linkage with underlying factors such as property condition, location, and size. Additionally, its effectiveness is constrained by the absence of a reliable database on market rental values. The UAV method, used by 21 per cent of the survey respondents, involves dividing the city into homogeneous blocks and assigning unit area values, based on various factors. However, these values may not always align directly with the guidance value, potentially leading to discretion in assessment by the property tax assessor. This highlights the need for a more objective valuation method.13 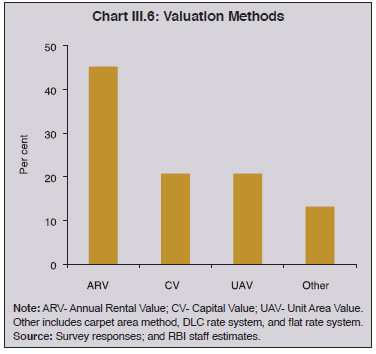
III.21 Given these limitations of the ARV and UAV methods, there seems to be preference for the CV method (Box III.1), which directly ties property tax assessments to the current guidance values published by the Stamp Duties and Registration Department. This ensures that the property tax remains buoyant [Second Administrative Reforms Commission (ARC), Sixth Report, 2007, GoI]. As per the survey, 21 per cent of the respondent corporations have adopted the CV system. However, updating guidance values at regular intervals is important to ensure a rise in tax corresponding with the market values of properties. As per the survey, 72.2 per cent of the corporations using guidance values to calculate land value update them regularly.
Assessment of Property Tax III.22 As per the survey, the system of physical assessment by revenue officials is still the most widely used method for property assessment, being employed by 55 per cent of the respondent cities15 (Chart III.7). This method frequently relies on the discretion of revenue officials. Staff shortages can result in incomplete and inaccurate records. 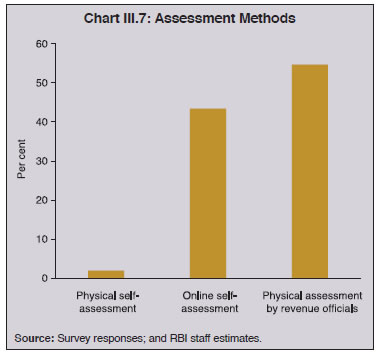
III.23 43 per cent of the respondent MCs have shifted to online self-assessment by property owners, which alleviates the burden on government resources and enhances transparency, but their scrutiny assumes importance. 96 per cent of the corporations with self-assessment systems undertake such scrutiny.16 Dispute Redressal Mechanisms III.24 Dispute resolution is dependent on the civil courts mechanism in 26 per cent of the respondent MCs and on assessment tribunals and property tax boards in 30 per cent of the MCs (Chart III.8). In 9 per cent of the respondent MCs, property tax related disputes are resolved through the municipal commissioner’s office. Other platforms for addressing property disputes include the revenue department, tax officials, appellate officer, objection officer, and citizen application. 37.7 per cent of the cities covered introduced a ‘one-time settlement’ scheme for timely settlement of property dues in the last 10 years, mostly in the form of exemption of interest on arrears. Resolution mechanisms relying on civil courts and tribunals can result in delayed decisions, lower tax base, and increased administrative burden, given their already high burden and other resource constraints.17 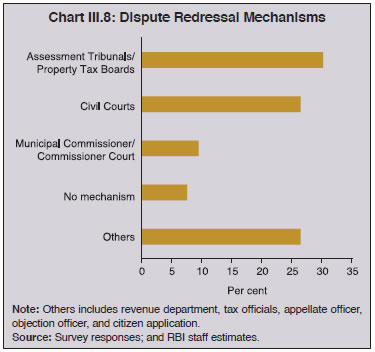
Property Tax Exemptions III.25 Property tax provisions in India generally provide several exemptions like for properties serving charitable purposes, public properties (such as playgrounds, parks, or monuments), or those used for education purposes (Chart III.9). Widespread exemptions diminish the tax base and shift a heavier burden onto non-exempt taxpayers. Blanket exemptions to properties may not be desirable due to the potential for commercial use. There are also cases of exempted institutions - for example, those related to education- also generating operating surplus from charges (Awasthi et al., 2021). The MCs can disclose revenue lost due to exemptions in their budgets for transparency and a holistic assessment. 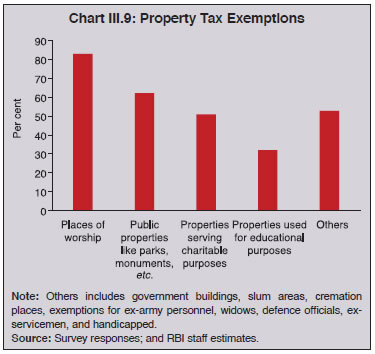
Billing and Collection Mechanisms III.26 32.1 per cent of the respondent MCs still rely on paper-based billing mechanisms with door-to-door distribution of the bills (Chart III.10a). Staff shortages can lead to incomplete billing and revenue losses. The majority of the respondent MCs (52.8 per cent) have moved to digital billing systems where bills are generated and distributed electronically to property owners with periodic reminders through SMS; however, 13.2 per cent of the respondent MCs have retained the paper-based billing system along with the digital billing system. On the collection side, digital modes of payment dominate, with a share of 67.9 per cent in the sample (Chart III.10b). Manual door-to-door collections exist in 15.1 per cent of the sample. Further, 13.2 per cent of the cities provide multiple payment options. III.27 In 67.9 per cent of the respondent corporations, there exist systems for generating management information system (MIS) reports. These reports offer timely and relevant information for decision-making and performance management. Most of the cities utilise these reports for periodically reviewing the performance of tax officials and collection agencies, publishing of demand and collection data, especially defaulters’ data in public domain, facilitating property tax recovery and managing digital payments. 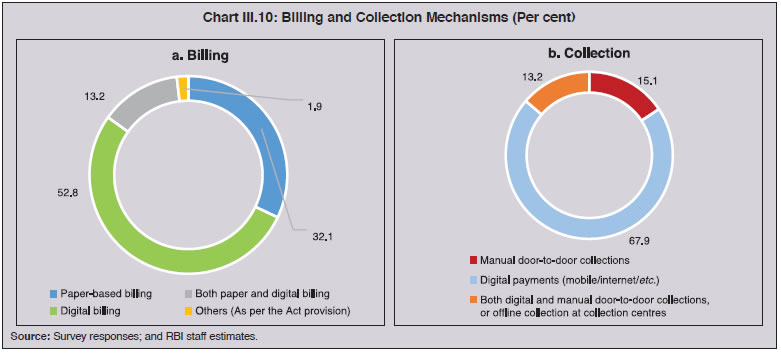
Property Tax Reforms in Recent Years III.28 The respondent corporations reported wide ranging property tax reforms in the last 5 years. For instance, Giridih, Chas and Hazaribagh MCs (Jharkhand) and Kurnool (Andhra Pradesh) shifted from the ARV method to the CV method of valuation. GIS-based enumerations are slowly being adopted by MCs like Nagpur, Greater Hyderabad, Jhansi and Meerut through GIS surveys and integration with property registration departments. Jamnagar and Raipur have introduced QR code-based payment methods, while Dewas and Bharatpur have launched e-portals to facilitate digital payment of taxes. Gandhinagar MC organised a campaign to encourage online payments. Most of the cities surveyed focused on improving tax recovery from defaulters by serving them notices, organising recovery camps and setting up recovery teams. Coverage of Properties III.29 More than 90 per cent of the respondent MCs cover residential and commercial properties under the tax net. 60.4 per cent levy tax on industrial properties and 56.6 per cent of the MCs tax other properties like vacant land and mixed properties (Chart III.11). 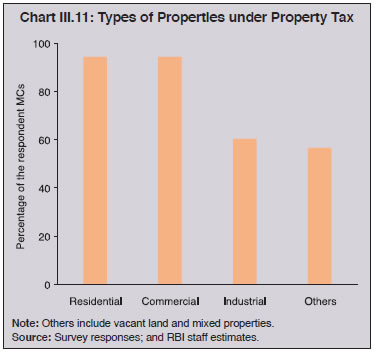
III.30 The coverage ratio (number of properties paying property tax/ estimated number of properties in the jurisdiction) hovers between 40-80 per cent for most of the respondent corporations (Chart III.12a). However, a number of the cities (almost 17 per cent) still have coverage ratios of less than 20 per cent. Only 9.4 per cent of the respondent MCs have coverage ratios exceeding 80 per cent (Chart III.12b). III.31 Technological advancements such as digital integrated billing, online payment facilities, and self-assessment systems can yield improvements in revenues. GIS-based digital property records can help enhance coverage, although smaller cities may not have the financial capacity to undertake a GIS mapping exercise even once. Transitioning to the Capital Value method for property valuation, coupled with provisions for regularly updating guidance values, can enhance tax buoyancy. Integrating MIS reports into decision-making processes can significantly enhance coverage and tax collection efficiency. 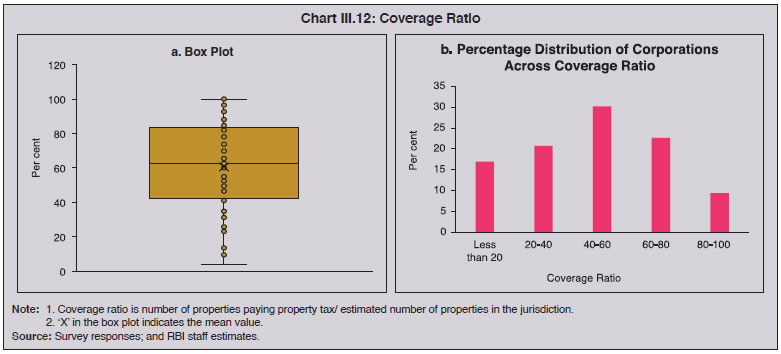
4.2 Water and Drainage Tax III.32 Water and drainage taxes, the other important constituents of the own tax revenue of the MCs, are collected to fund the operation, maintenance, and expansion of essential services for urban areas like water supply and drainage infrastructure. These services are crucial for ensuring public health, environmental sustainability, and overall quality of life in rapidly growing urban centres. The share of water tax and drainage/sewerage tax in the own source revenue ranges from 0.01 per cent to 15.7 per cent across the States (Table III.2). In many municipalities, these taxes are either too low to cover the total cost of service delivery or need to be regularly updated to reflect inflation and rising operational costs. Consequently, municipal bodies often struggle to generate enough revenue to maintain and expand water and drainage infrastructure, leading to frequent service disruptions and poor coverage, especially in rapidly growing urban areas (Ahluwalia et al., 2019). 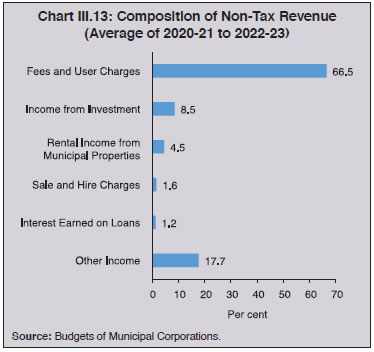
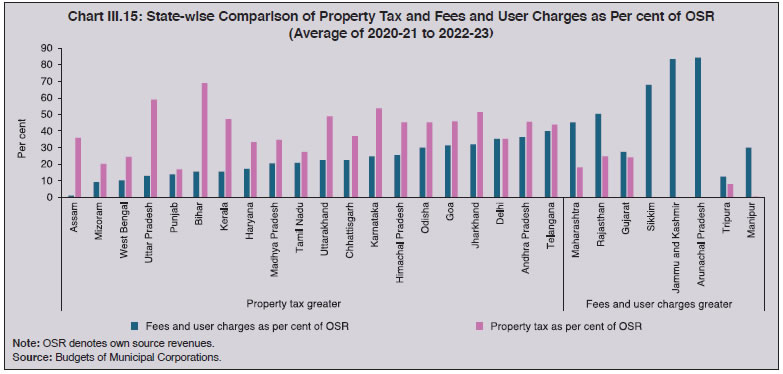
III.33 Non-tax sources are particularly important in the context of constraints on tax revenues. MCs in India earn 66.5 per cent of non-tax revenue from fees and user charges (Chart III.13). However, non-tax revenues are subdued due to inadequate pricing, inefficient collection mechanisms, and a lack of comprehensive strategies for revenue enhancement (Ahluwalia et al., 2019). 5.1 Fees and User Charges III.34 The revenue generated from fees and user charges is 35.2 per cent of total own revenues for all the MCs and the ratio varies from 0.9 per cent to 84.5 per cent across States (Chart III.14). III.35 Fees and user charges represent important sources of revenue for all MCs, particularly in Maharashtra, Rajasthan, Gujarat, and Tripura, where their share in own-source revenue outweighs that of property taxes (Chart III.15). This can be attributed to various factors, including a high degree of urbanisation, tourist destinations and the subsequent expansion in supplies of essential municipal services such as water supply, waste management and transportation. 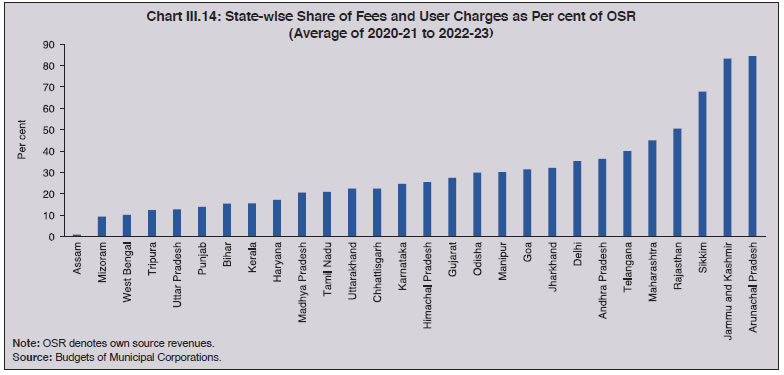
III.36 Own sources of revenues afford municipalities increased financial autonomy, stability, and enhanced capacity to strategise and execute urban development initiatives more efficiently and effectively. To bolster their own-source revenue, MCs can strengthen mechanisms to collect property and water and drainage/sewerage taxes. Consecutive property reassessments, effective enforcement, and efficient administrative systems can unlock substantial untapped potential in property taxes. III.37 As regards non-tax revenues, MCs can significantly enhance them by applying appropriate and adequate fees and user charges for essential services such as water supply, sanitation, and waste management while also ensuring seamless availability of high-quality public services. These measures, combined with more transparent and accountable governance practices, can contribute to bolstering the financial health of MCs, setting off a virtuous cycle of better services for the public, stronger revenues and a continuous upgradation of the urban infrastructure. 1 World Urbanisation Prospects: The 2018 Revision, United Nations, 2018. 2 For instance, 60 per cent of the 15th Finance Commission (FC-XV) grants for cities with less than a million population while two-thirds of the grants for cities with million-plus population, were tied exclusively for water and sanitation related areas. Similarly, 14th Finance Commission specified 20 per cent of the recommended grants for the municipalities to be performance grants linked to providing audited accounts and improvement in own revenues. 3 1st State Finance Commission Report, Tamil Nadu (1997-2002). 4 15th Finance Commission Report, 2021-26. 5 Entertainment tax got subsumed under GST in 2017, except when it is levied by the local bodies. 6 AMRUT 2.0 launched in 2021 aims to develop water secure cities and outlines mandatory reforms in property taxes to enhance financial health of ULBs. These reforms focus on notifying property tax calculations based on guidance value/ circle rate along with provision for periodic increase, and improvement in coverage and collection efficiency. The States are required to implement these reforms in the first two years from the launch of Mission to be eligible for Central assistance from the third year onwards. 7 Government of India. (2020). A Toolkit for Property Tax Reform. Ministry of Housing and Urban Affairs. 8 Awasthi, R., Nagarajan, M., & Deininger, K. W. (2021). Property Taxation in India: Issues Impacting Revenue Performance and Suggestions for Reform. Land Use Policy, 110, 104539. 9 The survey form was sent to 190 municipal corporations, out of which 53 MCs responded. 10 These 53 MCs had a share of 25 per cent in total property tax collections of all the MCs included in this Report. 11 Based on responses from 51 municipal corporations. 12 Based on responses from 43 municipal corporations. 13 Government of India. (2020). A Toolkit for Property Tax Reform. Ministry of Housing and Urban Affairs. 14 ARV, CV and UAV systems take values 0, 1 and 2, respectively. 15 Assessment refers to evaluating the value of a specific property while valuation defines the rules and formulae for assigning values to all the properties within the city; assessment applies the valuation rules to individual properties. 16 Based on responses from 24 municipal corporations 17 Government of India. (2020). A Toolkit for Property Tax Reform. Ministry of Housing and Urban Affairs. |


