 IST,
IST,


OBICUS Survey on the Manufacturing sector - Q2:2017-18
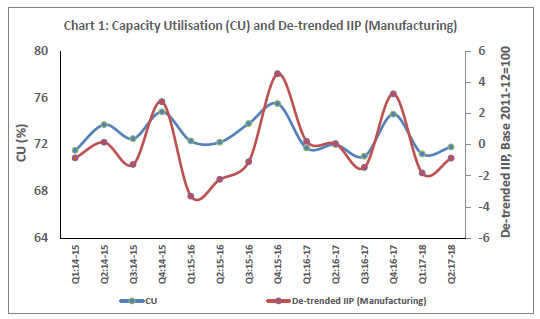
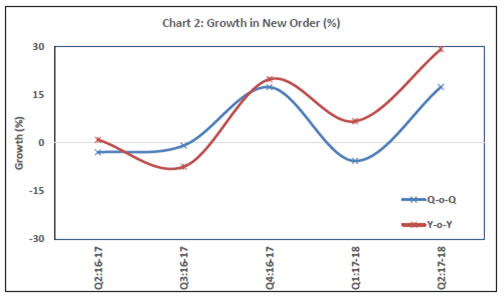
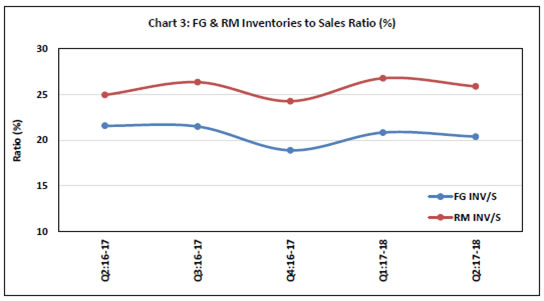
Today, the Reserve Bank released results of the 39th round of the Order Books, Inventories and Capacity Utilisation Survey (OBICUS) for the quarter July-September 2017 covering 756 manufacturing companies. The survey provides a snapshot of demand conditions in the Indian manufacturing sector1. Highlights: 1) Capacity Utilisation (CU): At the aggregate level, CU recorded a slight uptick and stood at 71.8 per cent in Q2:2017-18, co-moving with the de-trended index of industrial production2 (IIP) for the manufacturing sector (Chart 1). However, seasonally adjusted CU declined marginally. 2) Order Books: New orders received by the companies in Q2:2017-18 recorded a substantial growth over their levels in the previous quarter and also a year ago (Chart 2). 3) Finished Goods Inventory (FGI) to Sales Ratio: Drawdown of the FGI led to marginal decline in FGI to sales ratio in Q2:2017-18 and it was also lower than its level a year ago (Chart 3). 4) Raw Material Inventory (RMI) to Sales Ratio: Similarly, destocking of the RMI resulted in lower RMI to sales ratio in Q2:2017-18 sequentially. ANNEX 1: Data Tables
1 The survey responses are voluntary and difference in sample composition may affect the results to some extent. The 38th round of the OBICUS covering 805 manufacturing companies with reference period as April-June 2017 was released on the RBI website on October 04, 2017. 2 IIP is calculated on a fixed base (currently 2011-12=100) whereas the denominator (viz. installed capacity) in CU is updated every quarter. For comparison, the trend component of IIP is removed. | |||||||||||||||||||||||||||||||||||||||||||||||||||||||||||||||||||||||||||||||||||||||||||||||||||||||||||||||||||||||||||||||||||||||||||||||||||||||||||||||||||||||||||||||||||||||||||||||||||||||||||||||||

এই পৃষ্ঠাটো শ্বেয়াৰ কৰক:


ভাৰতীয় ৰিজাৰ্ভ বেংক মোবাইল এপ্পলিকেষ্যন ইনষ্টল কৰক আৰু নৱীনতম বাতৰিৰ প্ৰৱেশাধিকাৰ পাওক!
আমাৰ এপটো ইনষ্টল কৰিবলৈ QR ক’ড স্কেন কৰক


পৃষ্ঠাটো শেহতীয়া আপডেট কৰা তাৰিখ:


