
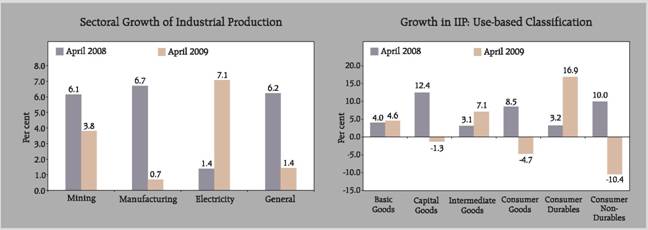
29. Group-wise index numbers of industrial production - RBI - Reserve Bank of India


29. Group-wise index numbers of industrial production
(Base: 1993-94=100) |
|||||||
Sr. No. |
Industry |
Weight |
Annual |
Monthly |
|||
2006-07 |
2007-08 |
2008-09 P |
April |
||||
2008 |
2009 P |
||||||
1 |
2 |
3 |
4 |
5 |
6 |
7 |
8 |
|
General Index |
100.00 |
247.1 |
268.0 |
274.9 |
266.3 |
270.1 |
I. |
Sectoral Classification |
|
|
|
|
|
|
1 |
Mining and Quarrying |
10.47 |
163.2 |
171.6 |
176.0 |
171.1 |
177.6 |
2 |
Manufacturing |
79.36 |
263.5 |
287.2 |
294.5 |
285.0 |
287.0 |
3 |
Electricity |
10.17 |
204.7 |
217.7 |
223.7 |
218.2 |
233.6 |
II. |
Use-Based Classification |
|
|
|
|
|
|
1 |
Basic Goods |
35.57 |
209.3 |
223.9 |
229.7 |
221.3 |
231.4 |
2 |
Capital Goods |
9.26 |
314.2 |
370.8 |
396.9 |
313.0 |
309.0 |
3 |
Intermediate Goods |
26.51 |
242.4 |
264.1 |
258.2 |
256.9 |
275.2 |
4 |
Consumer Goods |
28.66 |
276.8 |
293.6 |
306.7 |
315.6 |
300.8 |
4(a) |
Consumer Durables |
5.36 |
382.0 |
378.0 |
394.8 |
352.9 |
412.5 |
4(b) |
Consumer Non-Durables |
23.30 |
252.6 |
274.2 |
286.4 |
307.0 |
275.1 |
Source : Central Statistical Organisation, Government of India. |
|||||||
 |

Share this page:


Install the RBI mobile application and get quick access to the latest news!


