 IST,
IST,


Assessing Inflation Expectations Adjusting for Households’ Biases
by Silu Muduli^, G V Nadhanael^, and Post-COVID, supply shock-induced spike in inflation in India has spawned renewed research interest in assessing the extent to which inflation expectations are anchored to the inflation target, given its importance to securing price stability in the medium-run. This article constructs a bias-adjusted household inflation expectations series to show that such a measure contains useful forward-looking information for predicting headline inflation. It also presents an inflation expectation anchoring (IEA) index to highlight the significance of the flexible inflation targeting (FIT) framework to firmer anchoring of expectations and the role of repeated supply shocks in posing the risk of de-anchoring expectations. Introduction inflation expectations broadly indicate what different economic agents – consumers, businesses, and investors – assess today about inflation in the future. Since the actual evolution of the inflation trajectory in a country can be conditioned by inflation expectations, central banks assign focused attention to anchor inflation expectations. When inflation expectations are anchored, short-term supply disruptions or supply shocks would not alter expectations about inflation in the medium-run, despite inflation rising/declining in the short-term, thereby minimising the risk of a wage-price spiral. Past conduct of monetary policy, in terms of delivering price stability in the medium- run, no matter the nature and size of shocks to inflation has an important bearing on the degree to which a central bank could anchor inflation expectations. In a flexible inflation targeting (FIT) framework, due to the primacy assigned to price stability in the monetary policy mandate, with an explicit inflation target as the nominal anchor, and clear accountability norms for monetary policy actions and transparency about the policy-making processes, the scope for anchoring inflation expectations is higher (Bernanke, 2007; Ha et al., 2019). If inflation expectations are anchored, then monetary policy “…can respond more aggressively to recessionary demand shocks and less aggressively to inflationary supply shocks, leading to better dual mandate outcomes” (Bernanke, 2022). As expectations are so critical to the price stability mandate, central banks can enhance the effectiveness of monetary policy by “working to shape those expectations” (Bernanke, 2013). Since expectations are unobservable, they are generally approximated through targeted surveys of households, firms and professional forecasters, besides estimating them from financial market variables such as inflation-indexed bonds, inflation swaps and inflation options. Subjective survey-based inflation expectations of households and firms help in understanding the wage-price setting behaviour, and hence in forecasting inflation, which serves as the intermediate target of monetary policy under FIT. Full information rational expectations (FIRE) models that often underpin simple models to explain inflation dynamics in a country tend to assume that all agents possess similar information, process information efficiently and therefore have identical expectations. The median/mean of survey data is commonly used as a proxy of the representative agent in the economy. In real life, however, understanding biases in subjective expectations and disagreements among agents, and the factors driving them, can help in enhancing the utility of inflation expectations data to inflation and monetary policy analysis. Survey data adjusted for households’ biases may completely alter one’s assessment of the degree of effectiveness of monetary policy in anchoring inflation expectations. Individual household perception about current/recent inflation may differ from the official release of headline CPI inflation (widely reported in the press), because the household may not know about the true inflation number, or even when the true information is known, the perception may be influenced by his/her own consumption basket and experience. When inflation perception itself differs from the official inflation number, that would imply that the full information representative agent assumption may no more be relevant for any meaningful policy analysis. inflation perceptions often may exhibit a stronger association with inflation expectations, relative to headline inflation. Moreover, inflation expectations of heterogenous agents may be influenced by several socio-economic factors – income levels, age, gender, purchasing attitudes, and personal optimism/pessimism about future employment and income outlook. More frequently purchased items tend to have a higher influence on both inflation perceptions and inflation expectations (Ehrmann et al., 2017). The order of disagreement among economic agents on expected inflation and its dispersion could depend on the level of actual inflation, its volatility and relative price variability (Mankiw et al., 2003) and the credibility of the central bank (Ballantyne et al., 2016). While lower order of disagreement would imply better anchoring of expectations, more dispersed expectations would mean large forecast errors for many economic agents, which in turn could increase the cost of inflation uncertainty for them. Since early 2020, successive and overwhelming supply-side shocks – disruptions in supply chains after the pandemic and large food and fuel price pressures after the war in Europe – and the resultant surge in global inflation have reignited the debate on the role of monetary policy in taming supply-shock induced inflation, as there is considerable cynicism about the impact of front-loaded monetary policy actions in anchoring inflation expectations, or avoiding the risk of de-anchoring of long-term inflation expectations if high inflation persists for an extended period. In this context, it has become necessary even in India to revisit and reassess the inflation expectations channel, notwithstanding the challenge that survey-based household inflation expectations are known to be biased and tend to differ from headline inflationpersistently1 (Singh et al., 2022). The utility of the median household inflation expectations numbers to forecasting headline inflation in India is found to be limited (Pattanaik et al., 2020). The use of several trimming methods to reduce bias in quantitative measures of household inflation expectations does not eliminate the problem completely (Das et al., 2019). When raw expectations data are transformed to satisfy conditions of rationality, they seem to provide better forward-looking information (Shaw, 2019). In view of these identified issues in the literature for India about untreated raw household inflation expectations data, this article focuses on quantifying the biases in expectations. By constructing an inflation expectations anchoring index, we also examine how the degree of anchoring of inflation expectations in India evolved over time, especially during the FIT period relative to the pre FIT period. Set against this context, Section II quantifies the extent of bias in household inflation expectations data and identifies the major sources of bias. It also examines major drivers of disagreement in inflation perceptions/expectations, namely differences in consumption baskets as derived from alternative data sources [such as consumer pyramid data published by the Centre for Monitoring Indian Economy (CMIE)], profession-wise differential sensitivity of expectations to food and fuel inflation, and also the role of income levels (in deciles), age and geographical location of households in driving heterogeneity in the formation of expectations. Section III generates a new bias-adjusted household inflation expectations series by accounting for the possible sources of bias and compares it with trends in actual inflation. Section IV compares the forecasting performance of the bias-adjusted inflation expectations series with that of the unadjusted series. For assessing the changing degree of anchoring of inflation expectations in India over time, Section V attempts to construct an inflation anchoring index taking into account three factors – sensitivity of inflation expectations to inflation shocks, dispersion in inflation expectations, and deviation of inflation expectations from the inflation target. Section VI provides concluding remarks. II. Bias in Household inflation Expectations II.1 Measuring Bias in inflation Expectations Bias in inflation expectations, being a potential source of noise, can reduce the utility of inflation expectations data (collected by devoting considerable time and resources) to policymaking. Often, there is a lack of clarity on what exactly is the bias in inflation expectations. Therefore, we start with a formal definition of inflation expectations bias. The inflationexpectations bias, Bht, at time t for horizon h is defined as the difference between inflation expectations for time t + h taken at time t and the realised inflation at time t + h. That is:  In the case of India, we consider one-year ahead inflation expectations, and therefore we take h = 1 year ahead. The next challenge is to empirically estimate bias using Equation (1). If we regress inflation expectations for the current period as recorded a period ago on the current realised inflation, we could generate a broad estimate of bias. This could be written as:  Here, the hypothesis of interest is whether β = 1. If β = 1, we have α = B1t. This method, however, provides a single estimate of the bias, which is an average approximation for the period under consideration. II.2 Bias in inflation Expectations of Households in India Given the need for assessing the evolution of bias over time, we consider bias as defined in Equation (1) and use data from the inflation Expectations Survey of Households (IESH) for constructing a time seriesof biases2. Estimated biases in inflation expectations from different measures are presented in Chart 1. A summary of descriptive statistics relating to biases in inflation expectations is reported in Table 1. We see that the extent of bias in inflation expectations is large, and the average size of bias goes up with the time horizon of inflation expectations increasing. One-year ahead expectations have the highest average biases and are the most volatile, indicating that the agents are more uncertain about future inflation as the time horizon expands. We also find that the estimated biases across forecast horizons are stationary, but there has been the presence of a positive bias over time which is consistent and systematic. 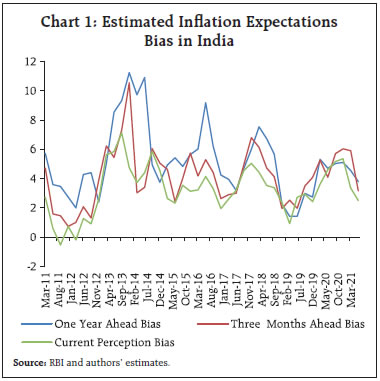 II.3 Sources of inflation Expectations Bias Recognising that the extent of bias in the inflation expectations of households may be large, the next question we address is what could be the possible sources of this bias. To derive an inflation expectations series that is free of biases, understanding these sources is critical. Bias in inflation expectations can arise on account of several reasons. Since inflation expectations are formed based on the information set available with the economic agents, the forecast errors could reflect the delay in obtaining full information by the agents. If these errors have any systematic pattern, it would reflect as bias over time. This could be either on account of the cost of acquiring full information - making the information flow sticky, or on account of noisy information available with the agents – posing the challenge of deciphering true signals from the information. inflation expectations bias could also be a result of the differences in the consumption baskets across households. As prices of some items change disproportionately to the overall inflation on account of supply shocks, individuals with a larger share of consumption of those items may perceive inflation differently and accordingly change their expectations. Using the CMIE data on consumption expenditure from the Consumer Pyramids Household Survey (CPHS) database, we present the share of food and fuel within their consumption basket for different types of workers in Table 2. We can see that the shares vary significantly across occupation categories. The overall picture is that food and fuel still account for a significant share of consumption across occupation categories. While the share of food is relatively lower for workers in the formal sector, the share of petrol and diesel is higher for them. So, differences in consumption baskets of households can be a major source of bias in expectations. Since the official CPI weights are based on the Household Consumption Expenditure Survey (CES) of 2011-12 conducted by the National Sample Survey Office (NSSO) while agents’ inflation expectations are based on their most recent consumption basket composition, one may question the rationale behind the direct comparison of inflation expectations with actual inflation for any meaningful analysis. To examine this, we compare the share of food and fuel in CPHS with CPI weights based on the CES of 2011-12 (Table 3). It is seen that in CPHS, the share of food in total consumption even in 2022 remains almost equal to the official CPI weight for food that was set in 2011-12. It needs to be noted that there are methodological differences between the way consumption expenditures are recorded in CPI and CPHS. For example, CPHS includes expenditure towards equated monthly instalments (EMIs) on loans, whereas CPI does not. This should have ideally pulled down the share of food in CPHS. Also, it has been argued that CPHS sample selection is more skewed towards urban areas and more affluenthouseholds.3 Even if those arguments hold true, they should have ideally reduced the share of food. As per CPHS data, strikingly, the share of food has remained close to the weight in the CPI basket over time (Chart 2). During the COVID lockdown period, the share of food increased, when the opportunity to spend on non-food items got severely curtailed. The salience of price changes could be another source of bias as more frequent price changes of select items, which the households purchase more frequently, can influence their expectations. inflation expectations are also likely to be more biased in the wake of higher inflation uncertainty. Those who are more uncertain about inflation tend to predict higher inflation. Also, if agents are rational, it is expected that they use full information in formulating their expectations and therefore underlying macroeconomic conditions could influence the bias in expectations. Ehrmann et al. (2017) showed that when respondents are pessimistic about the current employment situation, bias tends to be higher. Capistrán and Timmermann (2009) argued that agents tend to add a systematic upward bias to their inflation expectations to avoid the possibility of underprediction which entails a larger cost.  III. Adjusting for inflation Expectations Bias III.1 Theoretical and Empirical Insights Given that bias in inflation expectations is not uncommon, for deriving meaningful information from the trends in inflation expectations, one would need to adjust the data for biases, an issue which has received considerable attention in the literature. Adjustment of biases has been carried out based on forecast values, past errors, and macroeconomic indicators (Mankiw et al., 2003). Adjustment based on forecast values usually takes the form of estimating bias as a function of current inflation expectations. Adjustment to past errors in inflation expectations bias is usually done by regressing bias on change in inflation expectations implying that agents dynamically adjust for past errors, which might give rise to an accumulated bias component if they do not have perfect foresight. Bias could also result from fluctuations in macroeconomic variables such as unemployment rate, economic growth or interest rate, which could influence inflation expectations by altering their sentiments. It is found that agents usually tend to overstate their expectations during periods of economic pessimism. Standard model specifications to study biases are often modified and extended in the literature, allowing the incorporation of new possibilities. Capistrán and Timmermann (2009) adjusted the bias by considering the volatility of inflation as higher inflation uncertainty could induce higher inflation expectations. Ballantyne et al. (2016) added deviation of inflation from the target as an additional variable. Galvis Ciro and Zapata (2019) added an index of central bank credibility and the extent of complexity in central bank communication by using the Flesch index (a readability scale to measure the ease of reading a text). Studies that use micro-level data further refine the adjustment factor for bias at the individual level by incorporating consumer-level attributes, and controlling for the responses of individuals who show inconsistent behaviour (Ehrmann et al., 2017). Studies have also incorporated variables like inflation news intensity and state of business cycles for adjustment of biases. III.2 Adjustment of inflation Expectations Bias for India In this section, we address the issue of how to explicitly adjust for the inflation expectations bias (IEB) in IESH measures of inflation expectations. For our analysis, we restrict our domain to only median of one year ahead inflation expectations. Generally, for advanced economies, the IEB is estimated for 5 or 10 years ahead of inflation expectations whereas the maximum time frame from IESH that we have for India is one year. Following the literature, we identify a set of variables as determinants of IEB. First, we include the level of inflation as a determinant, as a higher realised inflation brings with it greater uncertainty about future inflation. Second, we include relative price volatility - a measure of the dispersion of inflation across items in the consumption basket. Therelative price volatility at time t (RPVt) for N product groups in the CPI basket is defined as: 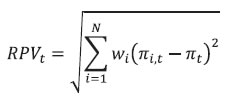 where, wi, πi,t, πt represent the weight of the ith group, inflation of the ith group at time t, and overall inflation at time t, respectively. The RPVt could also proxy inflation that is driven by supply shocks, as variability in inflation across product groups goes up during periods of supply disruptions (Ball and Mankiw, 1995). Here, we use the all-India CPI-subgroup level data which comprises 23 categories. This measure captures the extent to which realised inflation diverges across different groups based on their consumption shares, which could be a source of inflation expectation bias. We also include a measure of disagreement proxied by dispersion in inflation expectations within the survey which captures the heterogeneity in perception across age profiles, occupations, and cities. While these individual attributes can be a source of disagreement among respondents, they could be a possible source of aggregate IEB. For each of the characteristics, we define disagreement as the standard deviation of inflation expectations within that group. For example, the standard deviation of inflation expectations across age groups is the disagreement across age cohorts. In order to account for the impact of macroeconomic conditions on IEB, we use real GDP growth as the proxy for agents’ perceptions of current economic conditions. This could help in controlling for the counter-cyclical nature of IEB as during higher GDP growth with lower unemployment households are optimistic about the future and vice versa and these sentiments may induce IEB. Table 4 presents our key results. As expected, the estimated bias series has a strong autoregressive component, indicating its persistence. The realised inflation positively influences the bias and the estimated impact is significant across all specifications. As inflation variability increases across product groups, bias tends to be higher indicating that during periods of supply shocks inflation expectation bias is higher. It was also found that disagreement in inflation expectations by respondents within the survey also positively influences IEB. The coefficient of the real GDP growth variable turns out to be negative and significant once we include the RPVt and inflation expectations disagreements in our specification, which indicates that agents’ bias in inflation expectations falls when they perceive better economic prospects. Having established empirically the influence of these determinants on IEB, we now use the estimates to adjust inflation expectations data and derive a bias-adjusted inflation expectations series. We generate the bias-adjusted inflation expectations by adjusting for the predicted bias based on the fourth specification in Table 3. We see that once we adjust for biases, the inflation expectations series closely tracks the actual CPI inflation series, both in magnitude and direction (Chart 3). Only for a brief period from mid-2014 to early 2015, the bias-adjusted inflation expectations series deviated noticeably from the actual CPI inflationseries.4 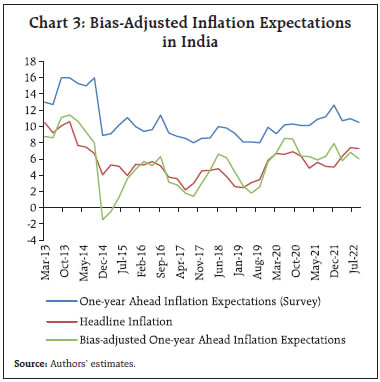 IV. Bias-adjusted inflation expectations as a lead indicator of inflation The utility of a bias-adjusted inflation expectations series could be assessed by examining its inflation forecasting performance relative to the unadjusted series. Applying a simple approach, we checked the Root Mean Squared Error (RMSE) and Mean Absolute Percentage Error (MAPE) of forecasts generated by using three different measures of inflationexpectations (Table 5).5 Our results show that there is a significant improvement in forecast performance once we adjust for bias in inflation expectations. Also, a model-based adjustment of bias yields better forecast performance than a simple bias adjustment process that involves subtracting the average bias from the inflation expectations series. We also see that both the RMSE and MAPE came down in the period when India formally adopted the FIT framework. V. Measurement of Anchoring of inflation Expectations The next important issue that we deal with is whether inflation expectations are anchored or not in India. For this purpose, we construct an inflation expectations anchoring index (IEA index) based on unadjusted household inflation expectations, as the challenge for anchoring inflation expectations relates to inflation expectations as revealed by households. The methodology for the construction of the IEA index broadly follows the approach by Bems et al.(2021) and Choi et al. (2022)6. For the construction of the index, we consider three dimensions that capture the contextual properties of inflation expectations anchoring: (1) sensitivity; (2) consistency; and (3) stability. Sensitivity: Sensitivity refers to how inflation expectations react to the currently available information. If the sensitivity is lower, then inflation expectations are well-anchored, and vice-versa (Bernanke, 2007). To estimate the sensitivity, we use the specification of Choi et al. (2022):  Then we estimate the first dimension (d1) by using the functional form: 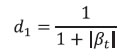 When βt = 0 d1 goes to 1, and when βt, → ∞ it goesto 0. Thus, higher the value of d1, higher is the degree of anchoring. Consistency: The second dimension (d2) refers to the consistency of inflation expectations with the central bank’s inflation target (Bems et al., 2021). d2 is given by:  If inflation expectations of agents are aligned to the inflation target (4 per cent for India), i.e., if the extent of deviation of expectations from the target is lower, higher is the consistency. Stability: Both d1 and d2 are based on the average measure of inflation expectations from the survey data. But these dimensions do not capture the distributional aspects of the responses. If there is greater disagreement among the respondents, a third dimension (d3) approximated through the standard deviation of inflation expectations reported by respondents in the survey could be useful. The third dimension is given by:  The lower the standard deviation, the higher the degree of anchoring and vice-versa. The composite IEA index is constructed by taking the simple arithmetic average of the above three dimensions.  The IEA takes a value between 0 and 1 at different points in time, where 0 refers to completely unanchored expectations and 1 refers to completely anchored inflation expectations. 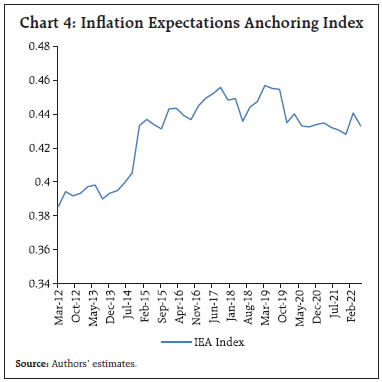 Our results show that the performance on anchoring inflation expectations improved during the FIT period before the pandemic struck (as reflected in the higher value of the index), and the improvement was primarily driven by consistency, signifying greater credibility around the inflation target (Chart 4). Post-COVID, however, the moderation in the index is largely on account of repeated supply shocks that led to realised inflation overshooting the target as well as greater disagreement in inflation expectations, which impacted both consistency and stability factors driving the IEA index. This article finds that household inflation expectations in India suffer from significant biases. There are multiple sources of such biases ranging from the overwhelming influence of own consumption basket in forming expectations, given limited/no knowledge about the true measure of inflation in the economy to individual assessment of the outlook for one’s income and employment and ability to sustain consumption and savings, which could be influenced by the level of inflation, state of economic growth, interest rates, and supply shocks facing the economy. When the household inflation expectations data series is adjusted for estimated biases, such a series exhibits better alignment with headline CPI inflation, with higher predictive power for forecasting headline inflation. The inflation expectation anchoring index shows that anchoring has improved since the adoption of the flexible inflation targeting (FIT) framework, but post-COVID, successive supply shocks that caused realised inflation to overshoot the target have increased the risk of de-anchoring expectations. References Ball, L., and Mankiw, N. G. (1995). Relative-price changes as aggregate supply shocks. The Quarterly Journal of Economics, 110(1), 161–193. Ballantyne, A., Gillitzer, C., Jacobs, D., and Rankin, E. (2016). Disagreement about inflation expectations. RBA Research. Bems, R., Caselli, F., Grigoli, F., and Gruss, B. (2021). Expectations’ anchoring and inflation persistence. Journal of International Economics, 132, 103516. Bernanke, B. (2007). inflation expectations and inflation forecasting. Retrieved from https://www.federalreserve.gov/newsevents/speech/bernanke20070710a.htm Bernanke, B. (2013, November). Communication and Monetary Policy. Retrieved from https://www.federalreserve.gov/newsevents/speech/bernanke20131119a.htm Bernanke, B. (2022, May). inflation Expectations and Monetary Policy. Retrieved from https://www.nber.org/lecture/keynote-address-ben-bernanke-inflation-expectations-and-monetary-policy Capistrán, C., and Timmermann, A. (2009). Disagreement and biases in inflation expectations. Journal of Money, Credit and Banking, 41(2–3), 365–396. Choi, S., Furceri, D., Loungani, P., and Shim, M. (2022). inflation anchoring and growth: The role of credit constraints. Journal of Economic Dynamics and Control, 134, 104279. Das, A., Lahiri, K., and Zhao, Y. (2019). inflation expectations in India: Learning from household tendency surveys. International Journal of Forecasting, 35(3), 980–993. Ehrmann, M., Pfajfar, D., and Santoro, E. (2017). Consumers’ Attitudes and Their inflation Expectations. International Journal of Central Banking, 13(1), 225–259. Galvis Ciro, J. C., and Anzoátegui Zapata, J. C. (2019). Disagreement in inflation expectations: empirical evidence for Colombia. Applied Economics, 51(40), 4411–4424. Goyal, A., Pandey, R., and Sane, R. (2021). Consumption baskets of Indian households: Comparing estimates from the CPI, CES and CPHS. NIPFP Working Paper Series No. 343. Ha, J., Kose, M. A., and Ohnsorge, F. (2019). inflation in Emerging and Developing Economies: Evolution, Drivers, and Policies. World Bank Publications. Mankiw, N. G., Reis, R., and Wolfers, J. (2003). Disagreement about inflation expectations. NBER Macroeconomics Annual, 18, 209–248. Patnaik, I., Shah, A., and Veronese, G. (2011). How should inflation be measured in India? Economic and Political Weekly, 46(16), 55–64. Pattanaik, S., Muduli, S., and Ray, S. (2020). inflation expectations of households: do they influence wage-price dynamics in India? Macroeconomics and Finance in Emerging Market Economies. https://doi.org/10.1080/17520843.2020.1720264 Shaw, P. (2019). Using rational expectations to predict inflation. RBI Occasional Papers, 40, 85–104. Singh, D. P., Mishra, A., and Shaw, P. (2022). Taking Cognisance of Households’ inflation Expectations in India. Reserve Bank of India Working Paper Series 2/2022. ^ The authors are from the Department of Economic and Policy Research (DEPR), Reserve Bank of India. They are grateful to Binod B. Bhoi, Vimal Kishore, Himani Shekhar and Satadru Das for valuable comments. Views expressed in the article are that of the authors and not of the Reserve Bank. 1 The RBI’s first survey of household inflation expectations started in September 2005 and qualitative information was the focus in the first two rounds. From the third round in 2006, quantitative information (3-months ahead and 1-year ahead inflation expectations) from twelve cities was collected. Starting December 2012, data were collected from sixteen Indian cities. Currently, the survey covers 19 cities. 2 The IESH survey elicits information on household inflation expectations through a structured questionnaire covering a wide range of diverse demographic aspects in terms of gender, age profile, and occupation status of the survey participants. The survey respondents report their current perception of inflation as well as inflation expectations for both three months ahead and one year ahead in numerical values. For the purpose of this study, we use quarterly data from Q1:2012 to Q2:2022. 3 For example, as in the article “New barometer of India’s economy fails to reflect deprivations of poor households” by Jean Dreze and Anmol Somanchi, Economic Times, June 21, 2021. 4 During this period, Indian basket crude oil prices fell precipitously (by 55 per cent between June 2014 and January 2015) and the transportation and communication sub-group registered a deflation (Monetary Policy Report, RBI, April 2015). Moreover, adoption of the inflation glide path, following the submission of the Expert Committee Report to Revise and Strengthen the Monetary Policy Framework in January 2014, also signalled greater commitment to price stability in the conduct of monetary policy. 5 Here the projected CPI inflation at period t is a function of the measure of inflation expectation assessed by the households for period t at time t-1 (i.e., one year back). 6 A commonly used approach to measure anchoring of inflation expectations is to check whether the coefficient of backward-looking expectations (or lagged inflation) in a hybrid New Keynesian Phillips Curve (NKPC) declines over time or not. For Indian data, when household inflation expectations are used as a proxy of forward-looking inflation expectations along with lagged inflation in NKPC, the model yields misleading results (Pattanaik et al., 2020). Hence, an alternative approach is adopted here. Specific factors that help improve anchoring of expectations include adoption of an inflation targeting regime, central bank transparency and also structural and fiscal factors in EMDEs such as lower public debt and greater trade openness ( Ha et al, 2019). |

Share this page:


Install the RBI mobile application and get quick access to the latest news!
Scan the QR code to install our app


Page Last Updated on:


