Banks’ Exposure to Non-SSI Sick/Weak Companies/Units: March 2007* This review presents a comparative position of Non-SSI sick/weak companies/ units financed by scheduled commercial banks (excluding RRBs) and bank credit to them as at end-March 2007 with respect to their positions as at end of the previous two years. The number of Non-SSI sick/weak companies/units and advances to them have been presented according to industry, sector of industrial units, bank group, and size of bank credit with the help of tables and graphs/charts. I. Introduction Industrial sickness is a serious clog in the smooth functioning of the financial system as it impairs the repayment capacity of borrowers and thereby impedes the recycling of funds lent by the financial system. Banks and other financial intermediaries show reluctance in lending to industries which are gripped by actual or perceived sickness. It is, therefore, imperative that such units should be identified at the incipient stage itself so that prompt corrective measures may be taken as early as possible to minimise the drain on national resources. In this connection, the present review attempts to gauge and analyse the extent of banks’ exposure to sick/weak industrial units as on March 2007. The review is divided into four sections. Section II deals with data coverage and Section III presents the detailed analysis of banks’ exposure to sick/weak industrial units. A brief summary of the discussion is presented in Section IV. Though the review attempts to present the scenario of industrial sickness/weakness in true perspective, it does not claim to be a comprehensive and exhaustive document in the area, as the source of information is limited. It is likely that all the Non-SSI sick/ weak industrial companies/units may not get included in the review as some of them might not have been financed by scheduled commercial banks. II. Data Coverage1 The data cover all scheduled commercial banks (excluding RRBs), which had exposures to Non-SSI sick/weak companies/units. In case of no exposure, these banks submitted ‘nil’ return. The reporting banks collect related data from their branches concerned and submit consolidated data for entire bank to the Reserve Bank on an annual basis. III. Discussion on Exposure of Banks to Non-SSI Sick/Weak Companies/Units: III.1 Overall Position : The total number of Non-SSI sick/weak companies/units declined from 5,252 as at end-March 2005 and 4,540 as at end-March 2006 to 3,967 as at end-March 2007 (Chart 1). Also, the aggregate outstanding bank credit to such units declined from Rs.34,427 crore as at end-March 2005 and Rs.32,988 crore as at end-March 2006 to Rs.25,066 crore as at end-March 2007 (Chart 2).
Table 1: Number of Sick/Weak Companies/Units and Advances to them - Year wise |
(Amounts in Rs. crore) |
Year |
Number of Sick/Weak Companies/Units |
Advances to Sick/Weak Companies/Units |
Sick Companies |
Weak Units |
Total |
Sick Companies |
Weak Units |
Total |
1 |
2 |
3 |
4 |
5 |
6 |
7 |
2005 |
4,478 |
774 |
5,252 |
29,644 |
4,783 |
34,427 |
| |
(85.3) |
(14.7) |
(100.0) |
(86.1) |
(13.9) |
(100.0) |
2006 |
3,408 |
1,132 |
4,540 |
26,013 |
6,976 |
32,988 |
| |
(75.1) |
(24.9) |
(100.0) |
(78.9) |
(21.1) |
(100.0) |
2007 |
2,957 |
1,010 |
3,967 |
17,984 |
7,082 |
25,066 |
| |
(74.5) |
(25.5) |
(100.0) |
(71.7) |
(28.3) |
(100.0) |
Note: 1. Figures in brackets represent percentage to total.
2. Totals may not tally due to rounding off. |
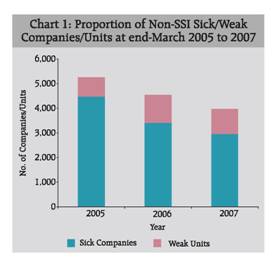
The number of weak units increased from 774 at end-March 2005 to 1,132 at end-March 2006 and declined to 1,010 at end-March 2007. On the other hand, the number of sick companies declined over the period and stood at 2,957 as at end-March 2007, compared with 3,408 and 4,478 as at end-March 2006 and 2005, respectively. In respect of bank credit to Non-SSI sick/weak companies/units, the share of sick companies declined over the period and, correspondingly, the share of weak units increased.
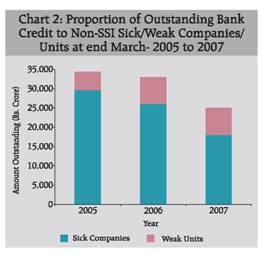
Table 2: Number of Sick/Weak Companies/Units - Industry wise |
Industries |
No. of Sick Companies at end-March |
No. of Weak Units at end-March |
Total No. of Sick/Weak Companies/Units at end-March |
2005 |
2006 |
2007 |
2005 |
2006 |
2007 |
2005 |
2006 |
2007 |
1 |
2 |
3 |
4 |
5 |
6 |
7 |
8 |
9 |
10 |
Total |
4,478 |
3,408 |
2,957 |
774 |
1,132 |
1,010 |
5,252 |
4,540 |
3,967 |
| |
(100.0) |
(100.0) |
(100.0) |
(100.0) |
(100.0) |
(100.0) |
(100.0) |
(100.0) |
(100.0) |
Of which: |
|
|
|
|
|
|
|
|
|
Textiles |
846 |
701 |
628 |
125 |
166 |
143 |
971 |
867 |
771 |
| |
(18.9) |
(20.6) |
(21.2) |
(16.1) |
(14.7) |
(14.2) |
(18.5) |
(19.1) |
(19.4) |
Chemicals |
363 |
317 |
294 |
59 |
105 |
80 |
422 |
422 |
374 |
| |
(8.1) |
(9.3) |
(9.9) |
(7.6) |
(9.3) |
(7.9) |
(8.0) |
(9.3) |
(9.4) |
Iron & Steel |
378 |
295 |
253 |
32 |
37 |
34 |
410 |
332 |
287 |
| |
(8.4) |
(8.7) |
(8.6) |
(4.1) |
(3.3) |
(3.4) |
(7.8) |
(7.3) |
(7.2) |
Engineering |
304 |
263 |
219 |
61 |
69 |
51 |
365 |
332 |
270 |
| |
(6.8) |
(7.7) |
(7.4) |
(7.9) |
(6.1) |
(5.0) |
(6.9) |
(7.3) |
(6.8) |
Note: 1. Figures into bracket represent percentage to total.
2. Totals may not tally due to rounding off. |
III.2 Industry-wise Position :
About 43 per cent of the total number of Non-SSI sick/weak companies/units as at end-March 2007 were from four major industries, viz., Textiles (19.4 per cent), Chemicals (9.4 per cent), Iron & Steel (7.2 per cent), and Engineering (6.8 per cent) [Table 2, Chart 3]. The share of such units increased during the period March 2005 to March 2007 in respect of industries like Textiles, and Chemicals and it declined for Iron and Steel and Engineering. It may be mentioned that 31.1 per cent of Non-SSI sick/ weak companies/units were from miscellaneous industries, which include Plastics, Pharmaceuticals and Drugs, Petroleum Products, Fertilizers, Consumer Durables, etc., (Statement I).
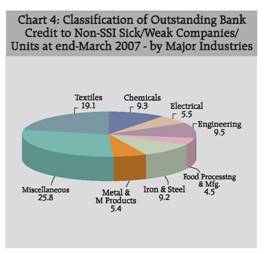
In respect of advances to Non-SSI sick/ weak companies/units as at end-March 2007, about 47 per cent of total advances were concentrated to the companies/units of only four industries, viz., Textiles (19.1 per cent), Chemicals (9.3 per cent), Engineering (9.5 per cent), and Iron & Steel (9.2 per cent) [Table 3]. Also, more than one-fourth of total advances were accounted for by the miscellaneous industries as at end-March 2007 (Statement II).
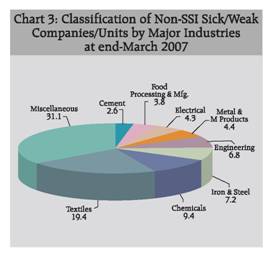
Table 3: Advances to Sick/Weak Companies/Units - Industry wise |
(Amount in Rs. crore) |
Industries |
Advances to Sick Companies at end-March |
Advances to Weak Units at end-March |
Total Advances to Sick/Weak Companies/Units at end-March |
2005 |
2006 |
2007 |
2005 |
2006 |
2007 |
2005 |
2006 |
2007 |
1 |
2 |
3 |
4 |
5 |
6 |
7 |
8 |
9 |
10 |
Total |
29,644 |
26,013 |
17,984 |
4,783 |
6,976 |
7,082 |
34,427 |
32,988 |
25,066 |
| |
(100.0) |
(100.0) |
(100.0) |
(100.0) |
(100.0) |
(100.0) |
(100.0) |
(100.0) |
(100.0) |
Of which |
|
|
|
|
|
|
|
|
|
Textiles |
5,658 |
5,159 |
3,360 |
533 |
1,099 |
1,425 |
6,191 |
6,258 |
4,785 |
| |
(19.1) |
(19.8) |
(18.7) |
(11.1) |
(15.8) |
(20.1) |
(18.0) |
(19.0) |
(19.1) |
Engineering |
2,250 |
2,504 |
2,221 |
377 |
324 |
154 |
2,627 |
2,828 |
2,374 |
| |
(7.6) |
(9.6) |
(12.3) |
(7.9) |
(4.6) |
(2.2) |
(7.6) |
(8.6) |
(9.5) |
Chemicals |
2,039 |
2,252 |
1,852 |
445 |
681 |
473 |
2,484 |
2,933 |
2,325 |
| |
(6.9) |
(8.7) |
(10.3) |
(9.3) |
(9.8) |
(6.7) |
(7.2) |
(8.9) |
(9.3) |
Iron & Steel |
3,100 |
2,257 |
1,867 |
194 |
457 |
428 |
3,294 |
2,714 |
2,295 |
| |
(10.5) |
(8.7) |
(10.4) |
(4.0) |
(6.6) |
(6.0) |
(9.6) |
(8.2) |
(9.2) |
Note: 1. Figures in brackets represent percentage to total.
2. Totals may not tally due to rounding off. |
III.3 Industry and Sector-wise Position:
The sector-wise number of Non-SSI sick/weak companies/units in various industries as at end-March 2005 to 2007 are given in Table 4. Of the total number of such units as at end-March 2007, only 6.8 per cent were from public sector industries. Moreover, of the total Non-SSI sick/weak public sector companies/units, 7.9 per cent were sick companies and 3.8 per cent weak units. In tandem with the decline in total number of Non-SSI sick/ weak companies/units from 5,252 as at end-March 2005 to 3,967 as at end-March 2007, the number of public sector Non-SSI sick/weak companies/units also declined from 349 as at end-March 2005 to 271 as at end-March 2007. The detailed data on number of Non-SSI sick/weak companies/units by industry and sector are given in Statement III.
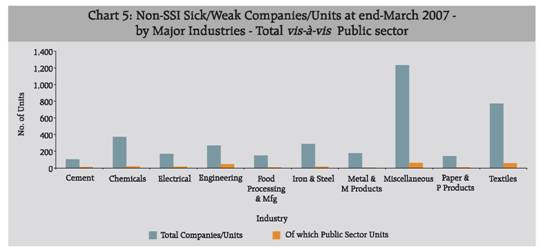
Table 4: Industry wise Number of Sick/Weak Companies/Units - by Sector |
Industries |
Year |
No. of Sick Companies |
No. of Weak Units |
Total No. of Sick/Weak Companies/Units |
Total |
Of Which Public Sector |
Total |
Of Which Public Sector |
Total |
Of Which Public Sector |
1 |
2 |
3 |
4 |
5 |
6 |
7 |
8 |
9 |
10 |
11 |
Total |
2005 |
4,478 |
315 |
(7.0) |
774 |
34 |
(4.4) |
5,252 |
349 |
(6.6) |
| |
2006 |
3,408 |
269 |
(7.9) |
1,132 |
41 |
(3.6) |
4,540 |
310 |
(6.8) |
| |
2007 |
2,957 |
233 |
(7.9) |
1,010 |
38 |
(3.8) |
3,967 |
271 |
(6.8) |
Of which |
|
|
|
|
|
|
|
|
Sugar |
2005 |
41 |
8 |
(19.5) |
10 |
3 |
(30.0) |
51 |
11 |
(21.6) |
| |
2006 |
39 |
7 |
(17.9) |
16 |
0 |
(0.0) |
55 |
7 |
(12.7) |
| |
2007 |
32 |
8 |
(25.0) |
14 |
2 |
(14.3) |
46 |
10 |
(21.7) |
Vehicle & |
2005 |
41 |
6 |
(14.6) |
9 |
0 |
(0.0) |
50 |
6 |
(12.0) |
Transport |
2006 |
35 |
8 |
(22.9) |
9 |
1 |
(11.1) |
44 |
9 |
(20.5) |
Equipments |
2007 |
32 |
6 |
(18.8) |
10 |
1 |
(10.0) |
42 |
7 |
(16.7) |
Engineering |
2005 |
304 |
42 |
(13.8) |
61 |
6 |
(9.8) |
365 |
48 |
(13.2) |
| |
2006 |
263 |
44 |
(16.7) |
69 |
6 |
(8.7) |
332 |
50 |
(15.1) |
| |
2007 |
219 |
42 |
(19.2) |
51 |
5 |
(9.8) |
270 |
47 |
(17.4) |
Jute |
2005 |
18 |
7 |
(38.9) |
1 |
0 |
(0.0) |
19 |
7 |
(36.8) |
| |
2006 |
15 |
4 |
(26.7) |
2 |
1 |
(50.0) |
17 |
5 |
(29.4) |
| |
2007 |
14 |
2 |
(14.3) |
2 |
0 |
(0.0) |
16 |
2 |
(12.5) |
Note: Figures into bracket represent percentage to respective totals. |
The share of advances to public sector units in total advances to Non-SSI sick/weak companies/units increased marginally from 12.6 per cent as at end-March 2005 to 12.9 per cent as at end-March 2007 (Table 5). Moreover, the share of advances to Non-SSI sick public sector companies increased marginally from 13.0 per cent as at end-March 2005 to 13.1 per cent as at end-March 2007 and increased moderately in respect of Non-SSI weak public sector units from 10.4 per cent as at end-March 2005 to 12.4 per cent as at end-March 2007. As regards industry and sector-wise classification of advances to Non-SSI sick/weak companies/ units, the share of public sector companies/units from ‘Engineering’ industry accounted for 39.9 per cent of the advances to the companies/units of this industry. The detailed data on advances to Non-SSI sick/ weak companies/units by industry and sector are provided in Statement IV.
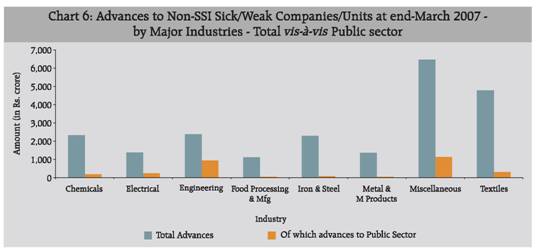
Table 5: Industry wise Advances to Sick/Weak Companies/Units - by Sector |
(Amount in Rs. crore) |
Industries |
Year |
Advances to Sick Companies |
Advances to Weak Units |
Total Advances to Sick/Weak Companies/Units |
Total |
Of Which Public Sector |
Total |
Of Which Public Sector |
Total |
Of Which Public Sector |
1 |
2 |
3 |
4 |
5 |
6 |
7 |
8 |
9 |
10 |
11 |
Total |
2005 |
29,644 |
3,846 |
(13.0) |
4,783 |
496 |
(10.4) |
34,427 |
4,342 |
(12.6) |
| |
2006 |
26,013 |
3,181 |
(12.2) |
6,976 |
830 |
(11.9) |
32,988 |
4,010 |
(12.2) |
| |
2007 |
17,984 |
2,352 |
(13.1) |
7,082 |
878 |
(12.4) |
25,066 |
3,230 |
(12.9) |
Of which |
|
|
|
|
|
|
|
|
|
Engineering |
2005 |
2,250 |
904 |
(40.2) |
377 |
92 |
(24.4) |
2,627 |
996 |
(37.9) |
| |
2006 |
2,504 |
1,296 |
(51.7) |
324 |
42 |
(13.0) |
2,828 |
1,338 |
(47.3) |
| |
2007 |
2,221 |
904 |
(40.7) |
154 |
43 |
(28.1) |
2,374 |
947 |
(39.9) |
Electrical |
2005 |
1,517 |
586 |
(38.6) |
239 |
5 |
(1.9) |
1,756 |
591 |
(33.6) |
| |
2006 |
1,203 |
278 |
(23.1) |
324 |
25 |
(7.6) |
1,527 |
302 |
(19.8) |
| |
2007 |
1,054 |
177 |
(16.8) |
334 |
70 |
(20.8) |
1,388 |
247 |
(17.8) |
Vehicle & |
2005 |
1,034 |
78 |
(7.5) |
82 |
0 |
(0.0) |
1,116 |
78 |
(7.0) |
Tran Equip |
2006 |
341 |
94 |
(27.5) |
161 |
15 |
(9.6) |
501 |
109 |
(21.7) |
| |
2007 |
238 |
74 |
(31.0) |
174 |
15 |
(8.9) |
412 |
89 |
(21.7) |
Note: Figures in brackets represent percentage to respective totals. |
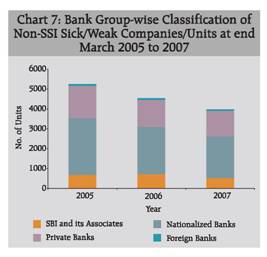
III.4 Bank Group-wise Position:
Bank group-wise classification of Non-SSI sick/weak companies/units as at end-March 2005 to 2007 showed that Nationalized Banks had lent to 52.1 per cent of Non-SSI sick/weak companies/units as at end-March 2007, as compared to 54.1 per cent units as at end-March 2005 (Table 6). On the other hand, the share of private sector banks in total number of Non-SSI sick/ weak companies/ units financed increased to 32.3 per cent at end-March 2007 as compared to 30.9 per cent at end-March 2005. While the share of SBI & its Associates in total number of Non-SSI sick/weak companies/units financed increased from 13.1 per cent as at end-March 2005 to 13.5 per cent as at end-March 2007, the share of foreign banks hovered around 2.0 per cent.
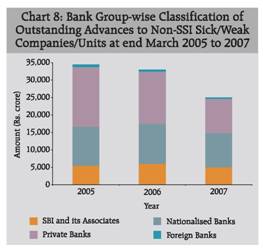
As regards bank group-wise classification of advances to Non-SSI sick/ weak companies/units, the share of Private Banks continued to be the highest as at end-March 2007 (Table 7). However, it declined from 49.8 per cent as at end-March 2005 to 39.4 per cent as at end-March 2007. On the other hand, the shares of Nationalised Banks and SBI & its Associates increased during the same period.
Table 6: Number of Sick/Weak Companies/Units - Bank Group wise |
Bank Group |
No. of Sick Companies at end-March |
No. of Weak Units at end-March |
Total No. of Sick/Weak Companies/Units at end-March |
2005 |
2006 |
2007 |
2005 |
2006 |
2007 |
2005 |
2006 |
2007 |
1 |
2 |
3 |
4 |
5 |
6 |
7 |
8 |
9 |
10 |
SBI and its |
580 |
575 |
427 |
108 |
147 |
107 |
688 |
722 |
534 |
Associates |
(13.0) |
(16.9) |
(14.4) |
(14.0) |
(13.0) |
(10.6) |
(13.1) |
(15.9) |
(13.5) |
Nationalized |
2,510 |
2,012 |
1,743 |
330 |
357 |
325 |
2,840 |
2,369 |
2,068 |
Banks |
(56.1) |
(59.0) |
(58.9) |
(42.6) |
(31.5) |
(32.2) |
(54.1) |
(52.2) |
(52.1) |
Private Banks |
1,305 |
745 |
725 |
317 |
602 |
564 |
1,622 |
1,347 |
1,289 |
| |
(29.1) |
(21.9) |
(24.5) |
(41.0) |
(53.2) |
(55.8) |
(30.9) |
(29.7) |
(32.5) |
Foreign Banks |
83 |
76 |
62 |
19 |
26 |
14 |
102 |
102 |
76 |
| |
(1.9) |
(2.2) |
(2.1) |
(2.5) |
(2.3) |
(1.4) |
(1.9) |
(2.2) |
(1.9) |
Total |
4,478 |
3,408 |
2,957 |
774 |
1,132 |
1,010 |
5,252 |
4,540 |
3,967 |
| |
(100.0) |
(100.0) |
(100.0) |
(100.0) |
(100.0) |
(100.0) |
(100.0) |
(100.0) |
(100.0) |
Note: 1. Figures in brackets represent percentage to total.
2. Totals may not tally due to rounding off. |
III.5 Bank Group-cum-Industry-wise Position:
Industry and bank group-wise classification of number of Non-SSI sick/ weak companies/units as at end-March 2005 to 2007, presented in Statement V, revealed that Nationalised Banks and Private Banks had exposure to maximum number of units of ‘Textiles’ and ‘Chemicals’ industries. On the other hand, SBI & its Associates’ banks and Foreign Banks were mainly exposed to the companies/units of ‘Textiles’ and ‘Engineering’ industries as at end-March 2007.
It may be seen that the bulk of the outstanding bank credit to Non-SSI sick/ weak companies/units as at end-March 2007 was accounted for by the companies/ units of Textiles, Iron & Steel, Engineering and Chemicals industries (Statement VI). While majority of advances by Nationalised Banks to such units was shared by the units of Textiles, Iron & Steel and Chemicals industries, the units of Engineering and Textiles industries had maximum share of advances by SBI & its Associates. In the case of Private Banks, Textiles industries accounted for the major share of their credit to Non-SSI sick/weak companies/ units.
Table 7: Advances to Sick/Weak Companies/Units - Bank Group wise |
(Amounts in Rs. crore) |
Bank Group |
Advances to Sick Companies at end-March |
Advances to Weak Units at end-March |
Total Advances to Sick/Weak Companies/Units at end-March |
2005 |
2006 |
2007 |
2005 |
2006 |
2007 |
2005 |
2006 |
2007 |
1 |
2 |
3 |
4 |
5 |
6 |
7 |
8 |
9 |
10 |
SBI and its |
4,086 |
4,605 |
3,676 |
1,403 |
1,479 |
1,350 |
5,488 |
6,084 |
5,026 |
Associates |
(13.8) |
(17.7) |
(20.4) |
(29.3) |
(21.2) |
(19.1) |
(15.9) |
(18.4) |
(20.1) |
Nationalized |
9,604 |
9,480 |
7,614 |
1,504 |
1,855 |
2,113 |
11,108 |
11,334 |
9,727 |
Banks |
(32.4) |
(36.4) |
(42.3) |
(31.4) |
(26.6) |
(29.8) |
(32.3) |
(34.4) |
(38.8) |
Private Banks |
15,346 |
11,499 |
6,303 |
1,796 |
3,557 |
3,563 |
17,142 |
15,056 |
9,866 |
| |
(51.8) |
(44.2) |
(35.0) |
(37.5) |
(51.0) |
(50.3) |
(49.8) |
(45.6) |
(39.4) |
Foreign Banks |
608 |
430 |
391 |
80 |
85 |
56 |
688 |
514 |
447 |
| |
(2.0) |
(1.7) |
(2.2) |
(1.7) |
(1.2) |
(0.8) |
(2.0) |
(1.6) |
(1.8) |
Total |
29,644 |
26,013 |
17,984 |
4,783 |
6,976 |
7,082 |
34,427 |
32,988 |
25,066 |
| |
(100.0) |
(100.0) |
(100.0) |
(100.0) |
(100.0) |
(100.0) |
(100.0) |
(100.0) |
(100.0) |
Note: 1. Figures in brackets represent percentage to total.
2. Totals may not tally due to rounding off. |
IV. Summary
The aggregate outstanding bank credit to Non-SSI sick/weak companies/units declined from Rs. 34,427 crore as at end-March 2005 and Rs. 32,988 crore as at end-March 2006 to Rs. 25,066 crore as at end-March 2007. Also, the total number of such companies/units declined from 5,252 as at end-March 2005 and 4,540 as at end-March 2006 to 3,967 as at end-March 2007.
In respect of number of financed Non-SSI sick/weak companies/units as at end-March 2007, about 43 per cent were from four industries, viz., Textiles, Chemicals, Iron & Steel, and Engineering. As regards advances to such units as at end-March 2007, about 47 per cent of total advances were concentrated in units of these four industries, viz., Textiles, Chemicals, Engineering, and Iron & Steel.
Of the total number of Non-SSI sick/weak companies/units as at end-March 2007, only 6.8 per cent units were from the public sector. Further, the share of advances to Non-SSI sick/weak public sector companies/units in total advances stood at 12.9 per cent as at end-March 2007.
Bank group-wise position as at end-March 2007 showed that more than 50 per cent of the Non-SSI sick/weak companies/ units financed had availed advances from Nationalised Banks. However, in terms of advances to Non-SSI sick/weak companies/ units, the share of Private Banks remained the highest (39.4 per cent) as at end-March 2007.
Statement I: Number of Sick/Weak Companies/Units - Industry wise |
Industries |
No. of Sick Companies at end-March |
No. of Weak Units at end-March |
Total No. of Sick/Weak Companies/Units at end-March |
| |
2005 |
2006 |
2007 |
2005 |
2006 |
2007 |
2005 |
2006 |
2007 |
1 |
2 |
3 |
4 |
5 |
6 |
7 |
8 |
9 |
10 |
Cement |
135 |
96 |
81 |
31 |
36 |
23 |
166 |
132 |
104 |
| |
(3.0) |
(2.8) |
(2.7) |
(4.0) |
(3.2) |
(2.3) |
(3.2) |
(2.9) |
(2.6) |
Chemicals |
363 |
317 |
294 |
59 |
105 |
80 |
422 |
422 |
374 |
| |
(8.1) |
(9.3) |
(9.9) |
(7.6) |
(9.3) |
(7.9) |
(8.0) |
(9.3) |
(9.4) |
Electrical |
159 |
155 |
133 |
38 |
47 |
36 |
197 |
202 |
169 |
| |
(3.6) |
(4.5) |
(4.5) |
(4.9) |
(4.2) |
(3.6) |
(3.8) |
(4.4) |
(4.3) |
Engineering |
304 |
263 |
219 |
61 |
69 |
51 |
365 |
332 |
270 |
| |
(6.8) |
(7.7) |
(7.4) |
(7.9) |
(6.1) |
(5.0) |
(6.9) |
(7.3) |
(6.8) |
Food Processing & Mfg. |
154 |
131 |
108 |
34 |
37 |
41 |
188 |
168 |
149 |
| |
(3.4) |
(3.8) |
(3.7) |
(4.4) |
(3.3) |
(4.1) |
(3.6) |
(3.7) |
(3.8) |
Gem & Jewellery |
20 |
20 |
13 |
3 |
2 |
3 |
23 |
22 |
16 |
| |
(0.4) |
(0.6) |
(0.4) |
(0.4) |
(0.2) |
(0.3) |
(0.4) |
(0.5) |
(0.4) |
Iron & Steel |
378 |
295 |
253 |
32 |
37 |
34 |
410 |
332 |
287 |
| |
(8.4) |
(8.7) |
(8.6) |
(4.1) |
(3.3) |
(3.4) |
(7.8) |
(7.3) |
(7.2) |
Jute |
18 |
15 |
14 |
1 |
2 |
2 |
19 |
17 |
16 |
| |
(0.4) |
(0.4) |
(0.5) |
(0.1) |
(0.2) |
(0.2) |
(0.4) |
(0.4) |
(0.4) |
Leather & L Products |
60 |
41 |
37 |
9 |
18 |
14 |
69 |
59 |
51 |
| |
(1.3) |
(1.2) |
(1.3) |
(1.2) |
(1.6) |
(1.4) |
(1.3) |
(1.3) |
(1.3) |
Metal & M Products |
157 |
131 |
111 |
28 |
55 |
65 |
185 |
186 |
176 |
| |
(3.5) |
(3.8) |
(3.8) |
(3.6) |
(4.9) |
(6.4) |
(3.5) |
(4.1) |
(4.4) |
Miscellaneous |
1,483 |
914 |
801 |
287 |
471 |
432 |
1,770 |
1,385 |
1,233 |
| |
(33.1) |
(26.8) |
(27.1) |
(37.1) |
(41.6) |
(42.8) |
(33.7) |
(30.5) |
(31.1) |
Paper & P Products |
161 |
128 |
110 |
26 |
29 |
33 |
187 |
157 |
143 |
| |
(3.6) |
(3.8) |
(3.7) |
(3.4) |
(2.6) |
(3.3) |
(3.6) |
(3.5) |
(3.6) |
Rubber & R Products |
40 |
36 |
23 |
3 |
4 |
6 |
43 |
40 |
29 |
| |
(0.9) |
(1.1) |
(0.8) |
(0.4) |
(0.4) |
(0.6) |
(0.8) |
(0.9) |
(0.7) |
Sugar |
41 |
39 |
32 |
10 |
16 |
14 |
51 |
55 |
46 |
| |
(0.9) |
(1.1) |
(1.1) |
(1.3) |
(1.4) |
(1.4) |
(1.0) |
(1.2) |
(1.2) |
Textiles |
846 |
701 |
628 |
125 |
166 |
143 |
971 |
867 |
771 |
| |
(18.9) |
(20.6) |
(21.2) |
(16.1) |
(14.7) |
(14.2) |
(18.5) |
(19.1) |
(19.4) |
Tobacco & T Products |
6 |
5 |
5 |
1 |
1 |
1 |
7 |
6 |
6 |
| |
(0.1) |
(0.1) |
(0.2) |
(0.1) |
(0.1) |
(0.1) |
(0.1) |
(0.1) |
(0.2) |
Veg Oil & Vanaspati |
112 |
86 |
63 |
17 |
28 |
22 |
129 |
114 |
85 |
| |
(2.5) |
(2.5) |
(2.1) |
(2.2) |
(2.5) |
(2.2) |
(2.5) |
(2.5) |
(2.1) |
Vehicle & Tran Equip |
41 |
35 |
32 |
9 |
9 |
10 |
50 |
44 |
42 |
| |
(0.9) |
(1.0) |
(1.1) |
(1.2) |
(0.8) |
(1.0) |
(1.0) |
(1.0) |
(1.1) |
Total |
4,478 |
3,408 |
2,957 |
774 |
1,132 |
1,010 |
5,252 |
4,540 |
3,967 |
| |
(100.0) |
(100.0) |
(100.0) |
(100.0) |
(100.0) |
(100.0) |
(100.0) |
(100.0) |
(100.0) |
Note: Figures in brackets represent percentage to total. |
Statement II: Advances to Sick/Weak Companies/Units - Industry wise |
(Amounts in Rs. crore) |
Industries |
Advances to Sick Companies at end-March |
Advances to Weak Units at end-March |
Total Advances to Sick/Weak Companies/Units at end-March |
| |
2005 |
2006 |
2007 |
2005 |
2006 |
2007 |
2005 |
2006 |
2007 |
1 |
2 |
3 |
4 |
5 |
6 |
7 |
8 |
9 |
10 |
Cement |
1,236 |
1,198 |
386 |
180 |
189 |
122 |
1,416 |
1,387 |
508 |
| |
(4.2) |
(4.6) |
(2.1) |
(3.8) |
(2.7) |
(1.7) |
(4.1) |
(4.2) |
(2.0) |
Chemicals |
2,039 |
2,252 |
1,852 |
445 |
681 |
473 |
2,484 |
2,933 |
2,325 |
| |
(6.9) |
(8.7) |
(10.3) |
(9.3) |
(9.8) |
(6.7) |
(7.2) |
(8.9) |
(9.3) |
Electrical |
1,517 |
1,203 |
1,054 |
239 |
324 |
334 |
1,756 |
1,527 |
1,388 |
| |
(5.1) |
(4.6) |
(5.9) |
(5.0) |
(4.6) |
(4.7) |
(5.1) |
(4.6) |
(5.5) |
Engineering |
2,250 |
2,504 |
2,221 |
377 |
324 |
154 |
2,627 |
2,828 |
2,374 |
| |
(7.6) |
(9.6) |
(12.3) |
(7.9) |
(4.6) |
(2.2) |
(7.6) |
(8.6) |
(9.5) |
Food Processing & Mfg. |
1,155 |
737 |
360 |
94 |
121 |
761 |
1,250 |
858 |
1,122 |
| |
(3.9) |
(2.8) |
(2.0) |
(2.0) |
(1.7) |
(10.8) |
(3.6) |
(2.6) |
(4.5) |
Gem & Jewellery |
152 |
197 |
104 |
46 |
4 |
16 |
197 |
200 |
120 |
| |
(0.5) |
(0.8) |
(0.6) |
(1.0) |
(0.1) |
(0.2) |
(0.6) |
(0.6) |
(0.5) |
Iron & Steel |
3,100 |
2,257 |
1,867 |
194 |
457 |
428 |
3,294 |
2,714 |
2,295 |
| |
(10.5) |
(8.7) |
(10.4) |
(4.0) |
(6.6) |
(6.0) |
(9.6) |
(8.2) |
(9.2) |
Jute |
56 |
44 |
46 |
4 |
9 |
11 |
60 |
53 |
58 |
| |
(0.2) |
(0.2) |
(0.3) |
(0.1) |
(0.1) |
(0.2) |
(0.2) |
(0.2) |
(0.2) |
Leather & L Products |
374 |
380 |
258 |
20 |
37 |
39 |
393 |
417 |
297 |
| |
(1.3) |
(1.5) |
(1.4) |
(0.4) |
(0.5) |
(0.5) |
(1.1) |
(1.3) |
(1.2) |
Metal & M Products |
1,381 |
1,143 |
995 |
116 |
242 |
364 |
1,497 |
1,385 |
1,359 |
| |
(4.7) |
(4.4) |
(5.5) |
(2.4) |
(3.5) |
(5.1) |
(4.3) |
(4.2) |
(5.4) |
Miscellaneous |
8,112 |
7,098 |
4,125 |
2,082 |
2,700 |
2,341 |
10,194 |
9,798 |
6,465 |
| |
(27.4) |
(27.3) |
(22.9) |
(43.5) |
(38.7) |
(33.0) |
(29.6) |
(29.7) |
(25.8) |
Paper & P Products |
510 |
486 |
425 |
97 |
120 |
115 |
607 |
606 |
540 |
| |
(1.7) |
(1.9) |
(2.4) |
(2.0) |
(1.7) |
(1.6) |
(1.8) |
(1.8) |
(2.2) |
Rubber & R Products |
143 |
137 |
133 |
13 |
117 |
97 |
156 |
254 |
230 |
| |
(0.5) |
(0.5) |
(0.7) |
(0.3) |
(1.7) |
(1.4) |
(0.5) |
(0.8) |
(0.9) |
Sugar |
381 |
351 |
230 |
208 |
268 |
122 |
589 |
619 |
352 |
| |
(1.3) |
(1.3) |
(1.3) |
(4.3) |
(3.8) |
(1.7) |
(1.7) |
(1.9) |
(1.4) |
Textiles |
5,658 |
5,159 |
3,360 |
533 |
1,099 |
1,425 |
6,191 |
6,258 |
4,785 |
| |
(19.1) |
(19.8) |
(18.7) |
(11.1) |
(15.8) |
(20.1) |
(18.0) |
(19.0) |
(19.1) |
Tobacco & T Products |
18 |
12 |
6 |
5 |
5 |
4 |
23 |
17 |
10 |
| |
(0.1) |
(0.0) |
(0.0) |
(0.1) |
(0.1) |
(0.1) |
(0.1) |
(0.1) |
(0.0) |
Veg Oil & Vanaspati |
528 |
517 |
324 |
49 |
118 |
103 |
576 |
635 |
427 |
| |
(1.8) |
(2.0) |
(1.8) |
(1.0) |
(1.7) |
(1.5) |
(1.7) |
(1.9) |
(1.7) |
Vehicle & Tran Equip |
1,034 |
341 |
238 |
82 |
161 |
174 |
1,116 |
501 |
412 |
| |
(3.5) |
(1.3) |
(1.3) |
(1.7) |
(2.3) |
(2.4) |
(3.2) |
(1.5) |
(1.6) |
Total |
29,644 |
26,013 |
17,984 |
4,783 |
6,976 |
7,082 |
34,427 |
32,988 |
25,066 |
| |
(100.0) |
(100.0) |
(100.0) |
(100.0) |
(100.0) |
(100.0) |
(100.0) |
(100.0) |
(100.0) |
Note: 1. Figures in brackets represent percentage to total.
2. Totals may not tally due to rounding off. |
Statement III: Industry wise Number of Sick/Weak Companies/Units – by Sector |
Industries |
Year |
No. of Sick Companies |
No. of Weak Units |
Total No. of Sick/Weak Companies/Units |
Total |
Of Which Public Sector |
Total |
Of Which Public Sector |
Total |
Of Which Public Sector |
1 |
2 |
3 |
4 |
5 |
6 |
7 |
8 |
9 |
10 |
11 |
Cement |
2005 |
135 |
13 |
(9.6) |
31 |
0 |
(0.0) |
166 |
13 |
(7.8) |
| |
2006 |
96 |
9 |
(9.4) |
36 |
0 |
(0.0) |
132 |
9 |
(6.8) |
| |
2007 |
81 |
11 |
(13.6) |
23 |
0 |
(0.0) |
104 |
11 |
(10.6) |
Chemicals |
2005 |
363 |
27 |
(7.4) |
59 |
2 |
(3.4) |
422 |
29 |
(6.9) |
| |
2006 |
317 |
23 |
(7.3) |
105 |
2 |
(1.9) |
422 |
25 |
(5.9) |
| |
2007 |
294 |
16 |
(5.4) |
80 |
4 |
(5.0) |
374 |
20 |
(5.3) |
Electrical |
2005 |
159 |
24 |
(15.1) |
38 |
3 |
(7.9) |
197 |
27 |
(13.7) |
| |
2006 |
155 |
19 |
(12.3) |
47 |
4 |
(8.5) |
202 |
23 |
(11.4) |
| |
2007 |
133 |
13 |
(9.8) |
36 |
3 |
(8.3) |
169 |
16 |
(9.5) |
Engineering |
2005 |
304 |
42 |
(13.8) |
61 |
6 |
(9.8) |
365 |
48 |
(13.2) |
| |
2006 |
263 |
44 |
(16.7) |
69 |
6 |
(8.7) |
332 |
50 |
(15.1) |
| |
2007 |
219 |
42 |
(19.2) |
51 |
5 |
(9.8) |
270 |
47 |
(17.4) |
Food Processing |
2005 |
154 |
8 |
(5.2) |
34 |
1 |
(2.9) |
188 |
9 |
(4.8) |
& Mfg. |
2006 |
131 |
9 |
(6.9) |
37 |
1 |
(2.7) |
168 |
10 |
(6.0) |
| |
2007 |
108 |
7 |
(6.5) |
41 |
2 |
(4.9) |
149 |
9 |
(6.0) |
Gem & |
2005 |
20 |
0 |
(0.0) |
3 |
0 |
(0.0) |
23 |
0 |
(0.0) |
Jewellery |
2006 |
20 |
0 |
(0.0) |
2 |
0 |
(0.0) |
22 |
0 |
(0.0) |
| |
2007 |
13 |
0 |
(0.0) |
3 |
0 |
(0.0) |
16 |
0 |
(0.0) |
Iron & Steel |
2005 |
378 |
16 |
(4.2) |
32 |
1 |
(3.1) |
410 |
17 |
(4.1) |
| |
2006 |
295 |
13 |
(4.4) |
37 |
3 |
(8.1) |
332 |
16 |
(4.8) |
| |
2007 |
253 |
13 |
(5.1) |
34 |
2 |
(5.9) |
287 |
15 |
(5.2) |
Jute |
2005 |
18 |
7 |
(38.9) |
1 |
0 |
(0.0) |
19 |
7 |
(36.8) |
| |
2006 |
15 |
4 |
(26.7) |
2 |
1 |
(50.0) |
17 |
5 |
(29.4) |
| |
2007 |
14 |
2 |
(14.3) |
2 |
0 |
(0.0) |
16 |
2 |
(12.5) |
Leather & L |
2005 |
60 |
5 |
(8.3) |
9 |
0 |
(0.0) |
69 |
5 |
(7.2) |
Products |
2006 |
41 |
1 |
(2.4) |
18 |
0 |
(0.0) |
59 |
1 |
(1.7) |
| |
2007 |
37 |
0 |
(0.0) |
14 |
0 |
(0.0) |
51 |
0 |
(0.0) |
Metal & M |
2005 |
157 |
9 |
(5.7) |
28 |
1 |
(3.6) |
185 |
10 |
(5.4) |
Products |
2006 |
131 |
4 |
(3.1) |
55 |
1 |
(1.8) |
186 |
5 |
(2.7) |
| |
2007 |
111 |
3 |
(2.7) |
65 |
1 |
(1.5) |
176 |
4 |
(2.3) |
Miscellaneous |
2005 |
1,483 |
60 |
(4.0) |
287 |
8 |
(2.8) |
1,770 |
68 |
(3.8) |
| |
2006 |
914 |
62 |
(6.8) |
471 |
13 |
(2.8) |
1,385 |
75 |
(5.4) |
| |
2007 |
801 |
50 |
(6.2) |
432 |
12 |
(2.8) |
1,233 |
62 |
(5.0) |
Paper & P |
2005 |
161 |
10 |
(6.2) |
26 |
1 |
(3.8) |
187 |
11 |
(5.9) |
Products |
2006 |
128 |
8 |
(6.3) |
29 |
1 |
(3.4) |
157 |
9 |
(5.7) |
| |
2007 |
110 |
7 |
(6.4) |
33 |
0 |
(0.0) |
143 |
7 |
(4.9) |
Rubber & R |
2005 |
40 |
2 |
(5.0) |
3 |
0 |
(0.0) |
43 |
2 |
(4.7) |
Products |
2006 |
36 |
2 |
(5.6) |
4 |
0 |
(0.0) |
40 |
2 |
(5.0) |
| |
2007 |
23 |
3 |
(13.0) |
6 |
0 |
(0.0) |
29 |
3 |
(10.3) |
Sugar |
2005 |
41 |
8 |
(19.5) |
10 |
3 |
(30.0) |
51 |
11 |
(21.6) |
| |
2006 |
39 |
7 |
(17.9) |
16 |
0 |
(0.0) |
55 |
7 |
(12.7) |
| |
2007 |
32 |
8 |
(25.0) |
14 |
2 |
(14.3) |
46 |
10 |
(21.7) |
Textiles |
2005 |
846 |
66 |
(7.8) |
125 |
8 |
(6.4) |
971 |
74 |
(7.6) |
| |
2006 |
701 |
53 |
(7.6) |
166 |
8 |
(4.8) |
867 |
61 |
(7.0) |
| |
2007 |
628 |
51 |
(8.1) |
143 |
6 |
(4.2) |
771 |
57 |
(7.4) |
Tobacco & T |
2005 |
6 |
0 |
(0.0) |
1 |
0 |
(0.0) |
7 |
0 |
(0.0) |
Products |
2006 |
5 |
0 |
(0.0) |
1 |
0 |
(0.0) |
6 |
0 |
(0.0) |
| |
2007 |
5 |
0 |
(0.0) |
1 |
0 |
(0.0) |
6 |
0 |
(0.0) |
Veg Oil & |
2005 |
112 |
12 |
(10.7) |
17 |
0 |
(0.0) |
129 |
12 |
(9.3) |
Vanaspati |
2006 |
86 |
3 |
(3.5) |
28 |
0 |
(0.0) |
114 |
3 |
(2.6) |
| |
2007 |
63 |
1 |
(1.6) |
22 |
0 |
(0.0) |
85 |
1 |
(1.2) |
Vehicle & |
2005 |
41 |
6 |
(14.6) |
9 |
0 |
(0.0) |
50 |
6 |
(12.0) |
Tran Equip |
2006 |
35 |
8 |
(22.9) |
9 |
1 |
(11.1) |
44 |
9 |
(20.5) |
| |
2007 |
32 |
6 |
(18.8) |
10 |
1 |
(10.0) |
42 |
7 |
(16.7) |
TOTAL |
2005 |
4,478 |
315 |
(7.0) |
774 |
34 |
(4.4) |
5,252 |
349 |
(6.6) |
| |
2006 |
3,408 |
269 |
(7.9) |
1,132 |
41 |
(3.6) |
4,540 |
310 |
(6.8) |
| |
2007 |
2,957 |
233 |
(7.9) |
1,010 |
38 |
(3.8) |
3,967 |
271 |
(6.8) |
Note: Figures in brackets represent percentage to respective totals |
Statement IV: Industry wise Advances to Sick/Weak Companies/Units - by Sector |
(Amounts O/S in Rs. crore) |
Industries |
Year |
Advances to Sick Companies |
Advances to Weak Units |
Total Advances to Sick/Weak Companies/Units |
Total |
Of which Public Sector |
Total |
Of which Public Sector |
Total |
Of which Public Sector |
1 |
2 |
3 |
4 |
5 |
6 |
7 |
8 |
9 |
10 |
11 |
Cement |
2005 |
1,236 |
279 |
(22.6) |
180 |
0 |
(0.0) |
1,416 |
279 |
(19.7) |
| |
2006 |
1,198 |
44 |
(3.7) |
189 |
0 |
(0.0) |
1,387 |
44 |
(3.2) |
| |
2007 |
386 |
47 |
(12.1) |
122 |
0 |
(0.0) |
508 |
47 |
(9.2) |
Chemicals |
2005 |
2,039 |
278 |
(13.6) |
445 |
4 |
(1.0) |
2,484 |
282 |
(11.4) |
| |
2006 |
2,252 |
292 |
(13.0) |
681 |
3 |
(0.5) |
2,933 |
295 |
(10.1) |
| |
2007 |
1,852 |
152 |
(8.2) |
473 |
37 |
(7.9) |
2,325 |
189 |
(8.1) |
Electrical |
2005 |
1,517 |
586 |
(38.6) |
239 |
5 |
(1.9) |
1,756 |
591 |
(33.6) |
| |
2006 |
1,203 |
278 |
(23.1) |
324 |
25 |
(7.6) |
1,527 |
302 |
(19.8) |
| |
2007 |
1,054 |
177 |
(16.8) |
334 |
70 |
(20.8) |
1,388 |
247 |
(17.8) |
Engineering |
2005 |
2,250 |
904 |
(40.2) |
377 |
92 |
(24.4) |
2,627 |
996 |
(37.9) |
| |
2006 |
2,504 |
1,296 |
(51.7) |
324 |
42 |
(13.0) |
2,828 |
1,338 |
(47.3) |
| |
2007 |
2,221 |
904 |
(40.7) |
154 |
43 |
(28.1) |
2,374 |
947 |
(39.9) |
Food Processing |
2005 |
1,155 |
438 |
(37.9) |
94 |
0 |
(0.4) |
1,250 |
439 |
(35.1) |
& Mfg |
2006 |
737 |
46 |
(6.3) |
121 |
0 |
(0.3) |
858 |
47 |
(5.4) |
| |
2007 |
360 |
11 |
(3.0) |
761 |
28 |
(3.6) |
1,122 |
39 |
(3.4) |
Gem & Jewellery |
2005 |
152 |
0 |
(0.0) |
46 |
0 |
(0.0) |
197 |
0 |
(0.0) |
| |
2006 |
197 |
0 |
(0.0) |
4 |
0 |
(0.0) |
200 |
0 |
(0.0) |
| |
2007 |
104 |
0 |
(0.0) |
16 |
0 |
(0.0) |
120 |
0 |
(0.0) |
Iron & Steel |
2005 |
3,100 |
79 |
(2.5) |
194 |
9 |
(4.8) |
3,294 |
88 |
(2.7) |
| |
2006 |
2,257 |
85 |
(3.8) |
457 |
56 |
(12.3) |
2,714 |
141 |
(5.2) |
| |
2007 |
1,867 |
73 |
(3.9) |
428 |
1 |
(0.2) |
2,295 |
74 |
(3.2) |
Jute |
2005 |
56 |
12 |
(20.5) |
4 |
0 |
(0.0) |
60 |
12 |
(19.3) |
| |
2006 |
44 |
7 |
(14.9) |
9 |
1 |
(5.4) |
53 |
7 |
(13.3) |
| |
2007 |
46 |
5 |
(9.8) |
11 |
0 |
(0.0) |
58 |
5 |
(7.9) |
Leather & L |
2005 |
374 |
4 |
(1.1) |
20 |
0 |
(0.0) |
393 |
4 |
(1.1) |
Products |
2006 |
380 |
0 |
(0.1) |
37 |
0 |
(0.0) |
417 |
0 |
(0.1) |
| |
2007 |
258 |
0 |
(0.0) |
39 |
0 |
(0.0) |
297 |
0 |
(0.0) |
Metal & M Products |
2005 |
1,381 |
193 |
(14.0) |
116 |
31 |
(27.0) |
1,497 |
224 |
(15.0) |
| |
2006 |
1,143 |
72 |
(6.3) |
242 |
31 |
(12.9) |
1,385 |
103 |
(7.5) |
| |
2007 |
995 |
7 |
(0.7) |
364 |
31 |
(8.6) |
1,359 |
39 |
(2.8) |
Miscellaneous |
2005 |
8,112 |
687 |
(8.5) |
2,082 |
289 |
(13.9) |
10,194 |
975 |
(9.6) |
| |
2006 |
7,098 |
669 |
(9.4) |
2,700 |
607 |
(22.5) |
9,798 |
1,275 |
(13.0) |
| |
2007 |
4,125 |
512 |
(12.4) |
2,341 |
623 |
(26.6) |
6,465 |
1,136 |
(17.6) |
Paper & P Products |
2005 |
510 |
22 |
(4.3) |
97 |
16 |
(16.0) |
607 |
38 |
(6.2) |
| |
2006 |
486 |
25 |
(5.1) |
120 |
16 |
(12.9) |
606 |
40 |
(6.6) |
| |
2007 |
425 |
56 |
(13.1) |
115 |
0 |
(0.0) |
540 |
56 |
(10.3) |
Rubber & R |
2005 |
143 |
5 |
(3.8) |
13 |
0 |
(0.0) |
156 |
5 |
(3.5) |
Products |
2006 |
137 |
5 |
(3.9) |
117 |
0 |
(0.0) |
254 |
5 |
(2.1) |
| |
2007 |
133 |
27 |
(20.5) |
97 |
0 |
(0.0) |
230 |
27 |
(11.9) |
Sugar |
2005 |
381 |
22 |
(5.8) |
208 |
2 |
(0.8) |
589 |
24 |
(4.1) |
| |
2006 |
351 |
12 |
(3.5) |
268 |
0 |
(0.0) |
619 |
12 |
(2.0) |
| |
2007 |
230 |
13 |
(5.6) |
122 |
1 |
(0.9) |
352 |
14 |
(4.0) |
Textiles |
2005 |
5,658 |
163 |
(2.9) |
533 |
49 |
(9.1) |
6,191 |
212 |
(3.4) |
| |
2006 |
5,159 |
186 |
(3.6) |
1,099 |
34 |
(3.1) |
6,258 |
220 |
(3.5) |
| |
2007 |
3,360 |
284 |
(8.5) |
1,425 |
28 |
(2.0) |
4,785 |
312 |
(6.5) |
Tobacco & T |
2005 |
18 |
0 |
(0.0) |
5 |
0 |
(0.0) |
23 |
0 |
(0.0) |
Products |
2006 |
12 |
0 |
(0.0) |
5 |
0 |
(0.0) |
17 |
0 |
(0.0) |
| |
2007 |
6 |
0 |
(0.0) |
4 |
0 |
(0.0) |
10 |
0 |
(0.0) |
Veg Oil & |
2005 |
528 |
96 |
(18.3) |
49 |
0 |
(0.0) |
576 |
96 |
(16.7) |
Vanaspati |
2006 |
517 |
71 |
(13.8) |
118 |
0 |
(0.0) |
635 |
71 |
(11.2) |
| |
2007 |
324 |
11 |
(3.3) |
103 |
0 |
(0.0) |
427 |
11 |
(2.5) |
Vehicle & |
2005 |
1,034 |
78 |
(7.5) |
82 |
0 |
(0.0) |
1,116 |
78 |
(7.0) |
Tran Equip |
2006 |
341 |
94 |
(27.5) |
161 |
15 |
(9.6) |
501 |
109 |
(21.7) |
| |
2007 |
238 |
74 |
(31.0) |
174 |
15 |
(8.9) |
412 |
89 |
(21.7) |
TOTAL |
2005 |
29,644 |
3,846 |
(13.0) |
4,783 |
496 |
(10.4) |
34,427 |
4,342 |
(12.6) |
| |
2006 |
26,013 |
3,181 |
(12.2) |
6,976 |
830 |
(11.9) |
32,988 |
4,010 |
(12.2) |
| |
2007 |
17,984 |
2,352 |
(13.1) |
7,082 |
878 |
(12.4) |
25,066 |
3,230 |
(12.9) |
Note: 1. Figures in brackets represent percentage to respective totals.
2. Totals may not tally due to rounding off. |
Statement V: Bank Group wise Number of Sick/Weak Companies/Units - Major Industries |
Industries |
Year |
SBI & Its Associates |
Nationalised Banks |
| |
|
Sick Companies |
Weak Units |
Total |
Sick Companies |
Weak Units |
Total |
1 |
2 |
3 |
4 |
5 |
6 |
7 |
8 |
Total |
2005 |
580 |
108 |
688 |
2,510 |
330 |
2,840 |
| |
|
(100.0) |
(100.0) |
(100.0) |
(100.0) |
(100.0) |
(100.0) |
| |
2006 |
575 |
147 |
722 |
2,012 |
357 |
2,369 |
| |
|
(100.0) |
(100.0) |
(100.0) |
(100.0) |
(100.0) |
(100.0) |
| |
2007 |
427 |
107 |
534 |
1,743 |
325 |
2,068 |
| |
|
(100.0) |
(100.0) |
(100.0) |
(100.0) |
(100.0) |
(100.0) |
of which: |
|
|
|
|
|
|
|
Chemicals |
2005 |
40 |
7 |
47 |
189 |
32 |
221 |
| |
|
(6.9) |
(6.5) |
(6.8) |
(7.5) |
(9.7) |
(7.8) |
| |
2006 |
37 |
16 |
53 |
189 |
30 |
219 |
| |
|
(6.4) |
(10.9) |
(7.3) |
(9.4) |
(8.4) |
(9.2) |
| |
2007 |
27 |
7 |
34 |
180 |
29 |
209 |
| |
|
(6.3) |
(6.5) |
(6.4) |
(10.3) |
(8.9) |
(10.1) |
Engineering |
2005 |
83 |
18 |
101 |
158 |
25 |
183 |
| |
|
(14.3) |
(16.7) |
(14.7) |
(6.3) |
(7.6) |
(6.4) |
| |
2006 |
73 |
15 |
88 |
151 |
18 |
169 |
| |
|
(12.7) |
(10.2) |
(12.2) |
(7.5) |
(5.0) |
(7.1) |
| |
2007 |
58 |
7 |
65 |
126 |
16 |
142 |
| |
|
(13.6) |
(6.5) |
(12.2) |
(7.2) |
(4.9) |
(6.9) |
Iron & Steel |
2005 |
62 |
3 |
65 |
221 |
21 |
242 |
| |
|
(10.7) |
(2.8) |
(9.4) |
(8.8) |
(6.4) |
(8.5) |
| |
2006 |
52 |
6 |
58 |
176 |
21 |
197 |
| |
|
(9.0) |
(4.1) |
(8.0) |
(8.7) |
(5.9) |
(8.3) |
| |
2007 |
33 |
4 |
37 |
161 |
25 |
186 |
| |
|
(7.7) |
(3.7) |
(6.9) |
(9.2) |
(7.7) |
(9.0) |
Miscellaneous |
2005 |
169 |
43 |
212 |
889 |
90 |
979 |
| |
|
(29.1) |
(39.8) |
(30.8) |
(35.4) |
(27.3) |
(34.5) |
| |
2006 |
193 |
72 |
265 |
485 |
96 |
581 |
| |
|
(33.6) |
(49.0) |
(36.7) |
(24.1) |
(26.9) |
(24.5) |
| |
2007 |
127 |
50 |
177 |
438 |
90 |
528 |
| |
|
(29.7) |
(46.7) |
(33.1) |
(25.1) |
(27.7) |
(25.5) |
Textiles |
2005 |
99 |
12 |
111 |
450 |
65 |
515 |
| |
|
(17.1) |
(11.1) |
(16.1) |
(17.9) |
(19.7) |
(18.1) |
| |
2006 |
104 |
8 |
112 |
433 |
76 |
509 |
| |
|
(18.1) |
(5.4) |
(15.5) |
(21.5) |
(21.3) |
(21.5) |
| |
2007 |
83 |
10 |
93 |
363 |
59 |
422 |
| |
|
(19.4) |
(9.3) |
(17.4) |
(20.8) |
(18.2) |
(20.4) |
Note: Figures in brackets represent percentage to total. |
Statement V: Bank Group wise Number of Sick/Weak Companies/Units - Major Industries (Concld.) |
Industries |
Year |
Private Banks |
Foreign Banks |
Sick Companies |
Weak Units |
Total |
Sick Companies |
Weak Units |
Total |
1 |
2 |
9 |
10 |
11 |
12 |
13 |
14 |
Total |
2005 |
1,305 |
317 |
1,622 |
83 |
19 |
102 |
| |
|
(100.0) |
(100.0) |
(100.0) |
(100.0) |
(100.0) |
(100.0) |
| |
2006 |
745 |
602 |
1,347 |
76 |
26 |
102 |
| |
|
(100.0) |
(100.0) |
(100.0) |
(100.0) |
(100.0) |
(100.0) |
| |
2007 |
725 |
564 |
1,289 |
62 |
14 |
76 |
| |
|
(100.0) |
(100.0) |
(100.0) |
(100.0) |
(100.0) |
(100.0) |
of which: |
|
|
|
|
|
|
|
Chemicals |
2005 |
122 |
19 |
141 |
12 |
1 |
13 |
| |
|
(9.3) |
(6.0) |
(8.7) |
(14.5) |
(5.3) |
(12.7) |
| |
2006 |
79 |
54 |
133 |
12 |
5 |
17 |
| |
|
(10.6) |
(9.0) |
(9.9) |
(15.8) |
(19.2) |
(16.7) |
| |
2007 |
81 |
42 |
123 |
6 |
2 |
8 |
| |
|
(11.2) |
(7.4) |
(9.5) |
(9.7) |
(14.3) |
(10.5) |
Engineering |
2005 |
56 |
16 |
72 |
7 |
2 |
9 |
| |
|
(4.3) |
(5.0) |
(4.4) |
(8.4) |
(10.5) |
(8.8) |
| |
2006 |
33 |
34 |
67 |
6 |
2 |
8 |
| |
|
(4.4) |
(5.6) |
(5.0) |
(7.9) |
(7.7) |
(7.8) |
| |
2007 |
25 |
28 |
53 |
10 |
0 |
10 |
| |
|
(3.4) |
(5.0) |
(4.1) |
(16.1) |
(0.0) |
(13.2) |
Iron & Steel |
2005 |
89 |
6 |
95 |
6 |
2 |
8 |
| |
|
(6.8) |
(1.9) |
(5.9) |
(7.2) |
(10.5) |
(7.8) |
| |
2006 |
60 |
8 |
68 |
7 |
2 |
9 |
| |
|
(8.1) |
(1.3) |
(5.0) |
(9.2) |
(7.7) |
(8.8) |
| |
2007 |
55 |
3 |
58 |
4 |
2 |
6 |
| |
|
(7.6) |
(0.5) |
(4.5) |
(6.5) |
(14.3) |
(7.9) |
Miscellaneous |
2005 |
406 |
151 |
557 |
19 |
3 |
22 |
| |
|
(31.1) |
(47.6) |
(34.3) |
(22.9) |
(15.8) |
(21.6) |
| |
2006 |
222 |
297 |
519 |
14 |
6 |
20 |
| |
|
(29.8) |
(49.3) |
(38.5) |
(18.4) |
(23.1) |
(19.6) |
| |
2007 |
222 |
289 |
511 |
14 |
3 |
17 |
| |
|
(30.6) |
(51.2) |
(39.6) |
(22.6) |
(21.4) |
(22.4) |
Textiles |
2005 |
283 |
45 |
328 |
14 |
3 |
17 |
| |
|
(21.7) |
(14.2) |
(20.2) |
(16.9) |
(15.8) |
(16.7) |
| |
2006 |
151 |
79 |
230 |
13 |
3 |
16 |
| |
|
(20.3) |
(13.1) |
(17.1) |
(17.1) |
(11.5) |
(15.7) |
| |
2007 |
170 |
73 |
243 |
12 |
1 |
13 |
| |
|
(23.4) |
(12.9) |
(18.9) |
(19.4) |
(7.1) |
(17.1) |
Statement VI: Bank Group wise Advances to Sick/Weak Companies/Units - Major Industries |
(Amounts in Rs. crore) |
Industries |
Year |
SBI & Its Associates |
Nationalized Banks |
Sick Companies |
Weak Units |
Total |
Sick Companies |
Weak Units |
Total |
1 |
2 |
3 |
4 |
5 |
6 |
7 |
8 |
Total |
2005 |
4,086 |
1,403 |
5,488 |
9,604 |
1,504 |
11,108 |
| |
|
(100.0) |
(100.0) |
(100.0) |
(100.0) |
(100.0) |
(100.0) |
| |
2006 |
4,605 |
1,479 |
6,084 |
9,480 |
1,855 |
11,334 |
| |
|
(100.0) |
(100.0) |
(100.0) |
(100.0) |
(100.0) |
(100.0) |
| |
2007 |
3,676 |
1,350 |
5,026 |
7,614 |
2,113 |
9,727 |
| |
|
(100.0) |
(100.0) |
(100.0) |
(100.0) |
(100.0) |
(100.0) |
Of which: |
|
|
|
|
|
|
|
Chemicals |
2005 |
210 |
84 |
294 |
861 |
241 |
1,102 |
| |
|
(5.1) |
(6.0) |
(5.4) |
(9.0) |
(16.0) |
(9.9) |
| |
2006 |
245 |
90 |
335 |
859 |
234 |
1,092 |
| |
|
(5.3) |
(6.1) |
(5.5) |
(9.1) |
(12.6) |
(9.6) |
| |
2007 |
211 |
91 |
302 |
868 |
231 |
1,099 |
| |
|
(5.7) |
(6.7) |
(6.0) |
(11.4) |
(10.9) |
(11.3) |
Engineering |
2005 |
1,247 |
233 |
1,480 |
627 |
49 |
676 |
| |
|
(30.5) |
(16.6) |
(27.0) |
(6.5) |
(3.2) |
(6.1) |
| |
2006 |
1,315 |
175 |
1,490 |
624 |
36 |
660 |
| |
|
(28.6) |
(11.8) |
(24.5) |
(6.6) |
(1.9) |
(5.8) |
| |
2007 |
1,205 |
58 |
1,263 |
565 |
37 |
602 |
| |
|
(32.8) |
(4.3) |
(25.1) |
(7.4) |
(1.8) |
(6.2) |
Iron & Steel |
2005 |
499 |
12 |
511 |
1,221 |
114 |
1,335 |
| |
|
(12.2) |
(0.8) |
(9.3) |
(12.7) |
(7.5) |
(12.0) |
| |
2006 |
502 |
25 |
527 |
1,069 |
165 |
1,234 |
| |
|
(10.9) |
(1.7) |
(8.7) |
(11.3) |
(8.9) |
(10.9) |
| |
2007 |
187 |
52 |
239 |
1,087 |
361 |
1,448 |
| |
|
(5.1) |
(3.9) |
(4.8) |
(14.3) |
(17.1) |
(14.9) |
Miscellaneous |
2005 |
898 |
810 |
1,707 |
2,225 |
386 |
2,611 |
| |
|
(22.0) |
(57.7) |
(31.1) |
(23.2) |
(25.6) |
(23.5) |
| |
2006 |
1,125 |
969 |
2,094 |
2,176 |
518 |
2,694 |
| |
|
(24.4) |
(65.5) |
(34.4) |
(22.9) |
(27.9) |
(23.8) |
| |
2007 |
850 |
844 |
1,694 |
1,717 |
395 |
2,112 |
| |
|
(23.1) |
(62.5) |
(33.7) |
(22.6) |
(18.7) |
(21.7) |
Textiles |
2005 |
584 |
49 |
633 |
1,957 |
321 |
2,278 |
| |
|
(14.3) |
(3.5) |
(11.5) |
(20.4) |
(21.3) |
(20.5) |
| |
2006 |
671 |
10 |
681 |
1,889 |
300 |
2,189 |
| |
|
(14.6) |
(0.7) |
(11.2) |
(19.9) |
(16.1) |
(19.3) |
| |
2007 |
590 |
94 |
684 |
1,367 |
376 |
1,743 |
| |
|
(16.1) |
(7.0) |
(13.6) |
(18.0) |
(17.8) |
(17.9) |
Note: 1. Figures in brackets represent percentage to total.
2. Totals may not tally due to rounding off. |
Statement VI: Bank Group wise Advances to Sick/Weak Companies/Units - Major Industries (Concld.) |
(Amounts in Rs. crore) |
Industries |
Year |
Private Banks |
Foreign Banks |
Sick Companies |
Weak Units |
Total |
Sick Companies |
Weak Units |
Total |
1 |
2 |
9 |
10 |
11 |
12 |
13 |
14 |
Total |
2005 |
15,346 |
1,796 |
17,142 |
608 |
80 |
688 |
| |
|
(100.0) |
(100.0) |
(100.0) |
(100.0) |
(100.0) |
(100.0) |
| |
2006 |
11,499 |
3,557 |
15,056 |
430 |
85 |
514 |
| |
|
(100.0) |
(100.0) |
(100.0) |
(100.0) |
(100.0) |
(100.0) |
| |
2007 |
6,303 |
3,563 |
9,866 |
391 |
56 |
447 |
| |
|
(100.0) |
(100.0) |
(100.0) |
(100.0) |
(100.0) |
(100.0) |
Of which: |
|
|
|
|
|
|
|
Chemicals |
2005 |
818 |
118 |
936 |
150 |
2 |
152 |
| |
|
(5.3) |
(6.6) |
(5.5) |
(24.7) |
(3.0) |
(22.2) |
| |
2006 |
1,093 |
337 |
1,430 |
56 |
20 |
76 |
| |
|
(9.5) |
(9.5) |
(9.5) |
(13.0) |
(23.8) |
(14.8) |
| |
2007 |
727 |
144 |
870 |
47 |
8 |
55 |
| |
|
(11.5) |
(4.0) |
(8.8) |
(12.0) |
(13.7) |
(12.2) |
Engineering |
2005 |
350 |
94 |
444 |
26 |
2 |
27 |
| |
|
(2.3) |
(5.2) |
(2.6) |
(4.2) |
(2.1) |
(4.0) |
| |
2006 |
546 |
97 |
642 |
19 |
17 |
36 |
| |
|
(4.7) |
(2.7) |
(4.3) |
(4.4) |
(19.9) |
(6.9) |
| |
2007 |
411 |
59 |
470 |
40 |
0 |
40 |
| |
|
(6.5) |
(1.7) |
(4.8) |
(10.2) |
(0.0) |
(8.9) |
Iron & Steel |
2005 |
1,322 |
46 |
1,369 |
58 |
22 |
80 |
| |
|
(8.6) |
(2.6) |
(8.0) |
(9.5) |
(27.6) |
(11.6) |
| |
2006 |
603 |
265 |
869 |
82 |
3 |
85 |
| |
|
(5.2) |
(7.5) |
(5.8) |
(19.1) |
(3.7) |
(16.5) |
| |
2007 |
549 |
14 |
562 |
45 |
1 |
46 |
| |
|
(8.7) |
(0.4) |
(5.7) |
(11.5) |
(1.6) |
(10.2) |
Miscellaneous |
2005 |
4,870 |
885 |
5,755 |
120 |
2 |
122 |
| |
|
(31.7) |
(49.3) |
(33.6) |
(19.8) |
(2.0) |
(17.7) |
| |
2006 |
3,716 |
1,209 |
4,925 |
82 |
3 |
85 |
| |
|
(32.3) |
(34.0) |
(32.7) |
(19.1) |
(3.8) |
(16.6) |
| |
2007 |
1,457 |
1,100 |
2,557 |
101 |
1 |
101 |
| |
|
(23.1) |
(30.9) |
(25.9) |
(25.7) |
(1.4) |
(22.7) |
Textiles |
2005 |
2,998 |
148 |
3,146 |
119 |
15 |
134 |
| |
|
(19.5) |
(8.2) |
(18.4) |
(19.5) |
(19.1) |
(19.5) |
| |
2006 |
2,518 |
787 |
3,306 |
81 |
2 |
83 |
| |
|
(21.9) |
(22.1) |
(22.0) |
(18.8) |
(2.7) |
(16.2) |
| |
2007 |
1,314 |
955 |
2,269 |
88 |
0 |
88 |
| |
|
(20.9) |
(26.8) |
(23.0) |
(22.5) |
(0.4) |
(19.7) |
Annex 1. Concepts/Definitions and related Acts/Provisions
1.1. Non-SSI Sick Industrial Company @
“Non-SSI Sick Industrial Company” means a Non-SSI industrial company (being a company registered for not less than seven years) which has at the end of any financial year accumulated losses equal to or exceeding its entire net worth.
1.2. Non-SSI Weak Units (other than 1.1 above)
A Non-SSI industrial unit is defined as a “weak” unit, if its accumulated losses as at the end of any financial year have resulted in the erosion of fifty per cent or more of its peak net worth in the immediately preceding four financial years. It is clarified that weak units will not only include those units (viz. industrial companies) which fall within the purview of Sick Industrial Companies (Special Provisions) Act, 1985, but also other categories such as partnership firms, proprietary concerns, etc.
- In the review, the joint reference to these categories made as Non-SSI (sick/weak) units would be in terms of these definitions.
- A “weak” industrial company would be termed as a potential “sick” company if and when it is reported to BIFR in terms of section 23(1)(a) of SICA, 1985.
2. Sick Industrial Companies (Special Provisions) Act, 1985 & BIFR
Following the Tiwari Committee recommendations (1981), the Sick Industrial Companies (Special Provisions) Act, 1985 (SICA) was passed and the Board for Industrial and Financial Reconstruction (BIFR) was established in 1987 for determining the preventive, ameliorative, remedial and other measures which need to be taken in respect of Non-SSI sick industrial companies and the expeditious enforcement of the measures so determined. However, no special Act has been enacted in respect of revival of sick SSI units.
3. Developments:
- The enactment of the Securitization and Reconstruction of Financial Assets and Enforcement of Security Interest (SARFAESI) Act 2002, has provided a significant impetus to banks to ensure sustained recovery. The Act provides, inter alia for enforcement of security interest for realization of dues without the intervention of courts or tribunals.
- The Government of India had also notified the Security Interest (Enforcement) Rules, 2002 to enable secured creditors to authorize their officials to enforce the securities and recover the dues from the borrowers. Banks have initiated the process of recovery under the Act. The Government has advised them to take action under the Act and report the compliance to the Reserve Bank.
- RBI Guidelines and Policy Initiatives:
The Reserve Bank of India has always given prime importance to the question of rehabilitation of sick/weak industrial companies/units. RBI has constantly reviewed the credit policy and other measures for rehabilitation of viable sick/ weak industries.
- RBI Guidelines:
The RBI had issued elaborate guidelines covering all areas of industrial rehabilitation, viz. detection of industrial sickness at incipient stage, identification of sick/weak companies/units, carrying out viability study of the unit, extension of reliefs and concessions to only viable units, co-ordination among banks and financial institutions and among banks themselves, norms for promoters’ contribution, extended period for repayment/ rescheduling of loans, conversion of debt into equity, single window concept of lending, interest rate concessions and waiver of penal rate, liquidated damages and right of recompense for sacrifices made. [RBI guidelines are equally applicable to weak (non-BIFR cases) Non-SSI units as well]. Similar guidelines have also been issued in the matter of rehabilitation of sick SSI companies/units. Individual cases of sick SSI companies/units where difficulties of co-ordination etc. may be encountered are sorted out in the meetings of State Level Inter-Institutional Committee (SLIIC).
- Annual Review of Industrial Sickness:
The RBI collects related information, on an annual basis, from all scheduled commercial banks in respect of their exposure to Non-SSI sick/weak industrial companies/units. RBI brings out the Review of these industrial units financed by scheduled commercial banks as at the end of March every year, based on the data received from these banks.
*Prepared in the OSMOS Division of the Department of Banking Supervision.
1The concepts/definitions and related acts/provisions have been provided in the Annex.
@ The definitions of Sick/Weak Industrial Companies/ Units have been taken from IECD Circular dated September 22, 1989, which has been based on the definitions in the erstwhile “Sick Industrial Companies (Special Provision) Act, 1985 (prior to its amendment)”. |


