
Indian Investment Abroad in Joint Ventures and Wholly Owned Subsidiaries : 2008-09 (April-March)* - RBI - Reserve Bank of India


Indian Investment Abroad in Joint Ventures and Wholly Owned Subsidiaries : 2008-09 (April-March)*
Indian Investment Abroad in Joint Ventures and Wholly Owned Subsidiaries : 2008-09 (April-March)* During the period 2004-08, India’s actual FDI outflows grew at a higher pace than global FDI outflows, mainly due to progressive liberalisation in India’s overseas investment policy during these years. However, during 2008-09, FDI outflows from India declined by 15 per cent in an aftermath of global financial crisis and resultant slowdown in world GDP growth, which had an adverse impact on FDI flows all over the world. The fall in India’s outflows was larger than that of the world. India’s ‘outflows’ as a proportion of ‘proposals’ also declined. During 2008-09, ‘manufacturing sector’ was the single largest component of India’s FDI outflows. As regards India’s outward FDI proposals, the amount of proposals also witnessed a decline in 2008-09. Most of the proposals were through automatic route and equity was the dominant mode of financing. Among India’s outward FDI proposals during 2008-09, ‘manufacturing sector’ was the single largest component. Direction of India’s outward FDI proposals indicated that Singapore, the Netherlands, Mauritius and the US continued to be the leading destinations in 2008-09. As part of India’s Balance of Payments (BoP) position, the Reserve Bank of India has been disseminating the aggregate data on foreign direct investment (FDI) - both inward and outward. Since 2000-01, in line with international best practices, the coverage of FDI was expanded to include more disaggregated data. An important development in India’s balance of payments since the late 1990s has been the rising prominence of Indian investment abroad in joint ventures (JVs) and wholly owned subsidiaries (WOSs). In order to disseminate such information, an article on Indian investment abroad in joint ventures/wholly owned subsidiaries has been brought out along with the quarterly release of India’s BoP statistics since 2008-09. The quarterly articles published so far comprised the data and analysis of India’s outward FDI proposals including their sectoral pattern and direction and aggregate data on actual FDI outflows from India. In the present article, for the first time, an attempt has been made to present a comparative picture of India’s outward FDI proposals and actual FDI outflows for 2007-08 and 2008-09. Moreover, it also presents a new feature, viz., sectoral pattern of actual FDI outflows from India during these two years. However, the sectoral analysis has been restricted to 2007-08 and 2008-09 only, as quarterly data for earlier years are not available. Against the above backdrop, the present article reviews India’s outward FDI in JVs and WOSs during the quarter January-March 2009 and the financial year 2008-09 (April-March). Section I presents an overview of India’s outward FDI – proposals as well as actual outflows. A detailed account of India’s outward FDI proposals, covering magnitude, sectoral pattern and destination-wise allocation is discussed in Section II. Section III analyses India’s actual investment outflows, including the magnitude and composition. Conclusions are set out in Section IV. I. India’s Outward FDI : An Overview Recent trends in global FDI outflows showed that these outflows increased by 63.5 per cent in 2004, but subsequently declined by 4.3 per cent in 2005. In 2006 these again exhibited a high growth of 50.2 per cent, and the growth momentum was maintained in 2007 with 50.9 per cent growth in global FDI outflows. During 2004-2007, the annual average growth in global FDI outflows worked out to 40.1 per cent. India’s FDI outflows increased by 26.5 per cent in 2004-05. Thereafter the growth rates shot up to 169.4 per cent in 2005-06 and further to 173.1 per cent in 2006-07. However, the growth rate came down to 34.6 per cent in 2007-08. During the period 2004-05 to 2007-08, annual average growth in India’s actual FDI outflows worked out to 100.9 per cent, which was much higher than the growth in global FDI outflows. This was an outcome of various liberalisation measures announced by the Reserve Bank of India in line with the progressive liberalisation in India’s overseas investment policy over these years (Annex I). Due to the global economic crisis, global FDI outflows slowed down in 2008 as well as in the current year. According to the latest data released by United Nations Conference on Trade and Development (UNCTAD), global FDI outflows declined by 9.4 per cent in 2008 (January-December) consequent to global slowdown in an aftermath of world economic crisis (Table 1). FDI outflows from developed economies declined by 11.9 per cent, with European developed economies and the US showing the decline of 22.1 per cent and 4.8 per cent, respectively. FDI outflows from developing countries rose by 2.0 per cent in 2008, but began to decline in the first half of 2009.
In line with the above trend, during 2008-09 (April-March), FDI outflows from India declined by 14.9 per cent. During this year, the proportion of ‘actual investment outflows’ to ‘cleared investment proposals’ also witnessed a decline, as the ratio declined to 72 per cent in 2008-09 from 81 per cent in 2007-08 (Table 2). During 2008-09, majority of the amount of India’s FDI outflows was in ‘manufacturing sector’ and its share in total outflows increased substantially, whereas the shares of the ‘other sectors’ (including trading, manufacturing, financial services, non-financial services and the other miscellaneous and residual activities) witnessed a marginal change. Similar trend was observed in India’s outward investment proposals. In the last quarter of 2008-09 (January-March 2009), FDI outflows from India witnessed a sharp decline of 14.0 per cent. The pattern of proposals for outward FDI during this quarter showed that manufacturing was the single largest sector with 21 per cent share in total amount of proposals; and Singapore and Cyprus were the main recipients of India’s FDI which together accounted for 66 per cent of the amount of proposals. As regards India’s outward FDI proposals, the amount of proposals witnessed a decline in 2008-09. Most of the proposals were through automatic route. During 2008-09,both under automatic and approval routes, equity was the dominant mode of financing. Almost half of the amount of proposals was in manufacturing, while the other sectors, viz., trading, financial services, non-financial services, and others had much lower shares. The year 2008-09 witnessed an increase in the shares of manufacturing, trading and financial services and a decline in the shares of non-financial services over the previous year. The pattern of direction of the proposals in 2008-09 was similar to that in 2007-08, as Singapore, the Netherlands, Mauritius and the US continued to be the leading destinations.
II. India’s Outward FDI Proposals1 II.1 Magnitude During the quarter January-March 2009, 881 proposals amounting to US$ 5,746 million were cleared for investments abroad in JVs and WOSs, as against 666 proposals amounting to US$ 4,635 million during January-March 2008. The number of investment proposals recorded an increase of 32.3 per cent, and the magnitude of proposals showed a rise of 24.0 per cent during the quarter under review (Table 3). Equity accounted for 70.6 per cent of the investment, followed by guarantees (16.4 per cent) and loans (13.0 per cent). During the corresponding quarter of the previous year (January-March 2008), equity constituted 60.4 per cent, guarantees formed 11.5 per cent and loans constituted 28.1 per cent of the amount of proposals for investment. During the financial year 2008-09 (April-March), 3,709 proposals amounting to US$ 22,098 million were cleared for investments abroad in JVs and WOSs, as against 2,261 proposals amounting to US$ 23,072 million during 2007-08 (Table 4). The number of proposals recorded a substantial growth of 64.0 per cent over the previous year, whereas the amount of investment proposals showed a decline of 4.2 per cent. During 2008-09, equity accounted for 68.1 per cent of the amount of proposals for investment, followed by loans (17.2 per cent) and guarantees (14.7 per cent). As against this, during 2007-08, equity constituted 61.2 per cent of the total amount of proposals for investment, while guarantees and loans formed 27.4 per cent and 11.4 per cent, respectively. This reflects increase in the shares of equity and loans in the financing of investment proposals during 2008-09 as compared with the previous year.
During 2008-09, most of the proposals were through automatic route2. Under the automatic route, equity constituted 68.0 per cent of the amount of investment proposals, whereas under approval route, all the proposals were through equity only. II.2 Sectoral Pattern and Direction II.2.1 Sectoral Pattern During the quarter January-March 2009, about 95 per cent of the amount of total outward FDI proposals cleared was for investments of US$ 5 million and above. Sector-wise, around 21 per cent of the amount of proposals was in manufacturing, followed by non-financial services (5 per cent), trading (3 per cent), financial services (1 per cent) and the balance was ‘others’ (Table 5). During the corresponding quarter of the previous year, 42 per cent of the amount of proposals was in manufacturing, followed by non-financial services (17 per cent), trading (3 per cent), financial services (0.2 per cent), and the rest was ‘others’. The investment proposals during 2008-09 indicated that almost 95 per cent of the amount of total proposals was for investments of US$ 5 million and above. Sector-wise, 47 per cent of the amount of total proposals was in manufacturing, followed by non-financial services (8 per cent), trading (5 per cent), financial services (1 per cent), and the balance was ‘others’ (Table 5). During 2007-08, 43 per cent of the total amount of proposals was in manufacturing, followed by non-financial services (11 per cent), trading (3 per cent), financial services (0.2 per cent), and the rest was ‘others’. The pattern of investment proposals during 2008-09 revealed an increase in the shares of manufacturing, trading and financial services and decline in the shares of non-financial services from the previous year.
II.2.2 Direction (Recipient Countries) Direction of investment proposals during January-March 2009 revealed that Singapore and Cyprus together accounted for about 66 per cent of the amount of proposals for outward FDI (US$ 5 million and above). As against this, during the corresponding quarter of the previous year, Singapore, Mauritius, Cyprus, the UAE and the Netherlands accounted for 65 per cent of the total amount of proposals (Table 6).
During 2008-09, Singapore, the Netherlands, Cyprus, the UK, the US and Mauritius together accounted for 81 per centof the amount of proposals for outward FDI (US$ 5 million and above) [Table 6 and Chart 1]. During 2007-08, Singapore, the Netherlands, Mauritius and the US accounted for 68 per cent of the total amount of proposals. Thus, Singapore, the Netherlands, Mauritius and the US continued to be the leading destinations. 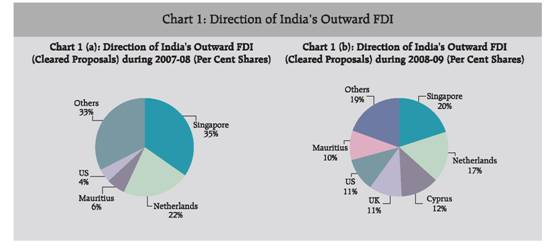
III. India’s Outward FDI: Actual Outflows3 III.1 Magnitude of Outflows Actual outward FDI in JVs and WOSs during the quarter January-March 2009 stood at US$ 4,647 million, showing a decline of 14.0 per cent over US$ 5,403 million during January-March 2008. Of the total investments, 89 per cent were in the form of equity and the remaining 11 per cent were loans. During January-March 2008, 74 per cent of the outward investments were in the form of equity and the remaining 26 per cent were loans (Table 7). During 2008-09, the actual outward FDI in JVs and WOSs stood at US$ 15,948 million, registering a decline of 14.9 per cent over the investment of US$ 18,749 million during the previous year (Table 7). Of the total amount of investments, 82 per cent was in the form of equity and 18 per cent was in loans. During 2007-08, 83 per cent of the amount of investments in JVs and WOSs was in the form of equity and the remaining 17 per cent was in loans. Thus, during 2008-09, the share of equity has marginally declined in the outward investments, with the amount of equity showing a decline of 15.6 per cent. The decline of 14.9 per cent witnessed in India’s actual outward FDI during 2008-09 as against a growth of 34.6 per cent in 2007-08 (on the top of an average annual growth of 123.0 per cent during 2004-05 to 2006-07) was mainly an outcome of global financial crisis and resultant slowdown in world GDP growth, which had an adverse impact on FDI flows all over the world (Box). Box: Impact of Global Economic Crisis on World FDI United Nations Conference on Trade and Development (UNCTAD) has released a Report on ‘Assessing the Impact of the Current Financial and Economic Crisis on Global FDI Flows’ in April 2009. The Report, inter alia, has estimated and analysed the overall as well as region-wise and sectoral impact of global economic crisis on world FDI. The Report has also discussed short-term and medium-term prospects for global FDI and prescribed the role of public policy for the recovery of FDI flows. According to the Report, growth cycle in international investment started in 2004. The world foreign direct investment (FDI) inflows reached a historic record of $1.9 trillion in 2007. However, due to the impact of the ongoing worldwide financial and economic crisis, FDI flows are estimated to have declined by 15 per cent in 2008. A further decrease in FDI flows is expected in 2009, as the full consequences of the crisis on transnational corporations’ (TNCs) investment expenditures continue to unfold. The fall in global FDI in 2008–2009 is the result of two major factors. First, the capability of firms to invest has been reduced by a fall in access to financial resources, both internally – due to a decline in corporate profits – and externally – due to the lower availability and higher cost of finance. Second, the propensity to invest has been affected negatively by economic prospects, especially in developed countries that are hit by the most severe recession of the post-war era. As of early 2009, a very high level of risk perception is leading companies to extensively curtail their costs and investment programmes in order to become more resilient to any further deterioration in their business environment. All the three major types of FDI (market-seeking, efficiency-seeking and resources-seeking) will be impacted by all these factors. The setback in FDI has particularly affected cross-border mergers and acquisitions (M&As), the value of which sharply declined in 2008 and early 2009. In fact, there is a rising wave of divestments and restructurings. The impact of the crisis on FDI differs, depending on region and sector. Developed countries have so far been the most affected, with a significant decline in FDI inflows in 2008, due mainly to sluggish market prospects. Flows into developing economies continued to grow in 2008, but at a much lower rate than in 2007. The impact of the crisis on FDI to developing countries is expected to be worse in 2009. One major concern of developing countries is how to retain existing investment and attract new FDI in the times of global recession. Economic stimulus programmes can be an incentive for foreign investment, but many developing countries do not have the financial resources to successfully compete with the investment promotion packages of developed countries. Moreover, incentives-based competition for foreign investment may risk lowering social and environmental standards, which would be detrimental for sustainable development. All the sectors have been affected by a decrease in cross-border M&As in 2008, with the exception of oil, mining and agri-food businesses. FDI flows to financial services, automotive industries, building materials, intermediate goods and some consumption goods have been most significantly affected in 2008. In the short-term, the negative impact of the present economic recession on global FDI prospects would be the dominant one. Medium-term FDI prospects are more difficult to assess, due to the exceptional magnitude of the present crisis and due to the fact that it could lead to major structural changes in the world economy. The financial crisis may, however, also trigger renewed efforts of developing countries to improve their investment climate. More important than ‘quick fix’ solutions are structural and institutional reforms that enhance the long-term competitiveness of host countries. Some favourable factors for FDI growth are still at work. Driving forces such as investment opportunities triggered by cheap asset prices and industry restructuring, large amounts of financial resources available in a number of emerging countries, quick expansion of new activities such as new energies and environment-related industries and a resilient trend in the internationalisation of companies will presumably trigger, sooner or later, a new pick-up in FDI flows. The timing of this upward shift will, however, depend on a series of uncertain factors such as the speed of economic and financial recovery, the effectiveness of public policy in addressing the causes of the present crisis, the return of investor confidence and the ability to prevent protectionist tendencies. According to UNCTAD’s World Investment Prospects Survey (WIPS), there is a high probability of slow recovery beginning in 2011. According to the UNCTAD Report, public policies will play a major role in the restoration of favourable conditions for a quick recovery in FDI flows. Structural reforms aimed at ensuring more stability in the global financial system, renewed commitment to an open environment for inward and outward FDI and the implementation of policies aimed at promoting investment and innovation are the key issues in this respect. For effectively dealing with the crisis and its economic aftermath, it is important for policymakers to resist the temptation of protectionism, and to maintain a favourable overall business and investment climate. The Report has further prescribed that apart from the much needed international regulation of the financial markets, economic stimulus packages should be built around common principles that embrace open markets and avoid ‘beggar thy neighbour’ policies. Moreover, there is a necessity of going beyond the mere short-term management of the ongoing crisis and of setting up the base of sound economic regulations, especially in banking, with more control and restriction on the activities of commercial banks, hedge funds and other financial institutions. (Source: www.unctad.org). III.2 Sectoral Pattern The distribution of actual outward FDI during 2008-09 indicated that sector-wise, 43 per cent of the amount of total proposals was in manufacturing, followed by non-financial services (7 per cent), trading (4 per cent), financial services (1 per cent), and the balance was ‘others’ (Table 8 and Chart 2). During 2007-08, 29 per cent of the total amount of proposals was in manufacturing, followed by non-financial services (9 per cent), trading (6 per cent) and the rest was ‘others’. The pattern of investment proposals during 2008-09 revealed an increase in the shares of manufacturing and financial services and decline in the shares of non-financial services and trading. IV. Conclusion Recent trends in global FDI outflows reveal that global FDI outflows witnessed a high growth during 2004-07. In line with the global trend, India’s outward FDI proposals as also actual FDI outflows showed higher growth during the period 2004-05 to 2007-08, mainly due to progressive liberalisation in India’s overseas investment policy during these years. However, in an aftermath of global economic crisis and resultant slowdown in growth of world economy, world FDI outflows showed a decline in 2008. Accordingly, during 2008-09 India’s outward FDI proposals as well as FDI outflows from India also recorded decline; and the fall in India’s outflows was larger than that of the world in 2008. Moreover, in case of India, the proportion of ‘actual investment outflows’ to ‘cleared investment proposals’ also witnessed a decline. During 2008-09, manufacturing remained the single largest sector in India’s FDI outflows, and there was an increase in the shares of manufacturing and financial services, while a decline in the shares of non-financial services and trading was observed. As regards the outward FDI proposals, in India, most of the proposals during 2008-09 were cleared through automatic route, as it was in 2007-08. Equity continued to be the dominant mode of financing of the investment proposals and the shares of equity and loans increased during the year. Direction of outward FDI proposals indicated that Singapore, the Netherlands, Mauritius and the US continued to be the leading recipients of India’s outward FDI in 2008-09.

Annex I: The introduction of FEMA in 2000 brought about significant policy liberalisation. The limit for investment up to US$ 50 million, which was earlier available in a block of three years, was made available annually without any profitability condition. Companies were allowed to invest 100 per cent of the proceeds of their ADR/GDR issues for acquisitions of foreign companies and direct investments in JVs and WOSs. Automatic route was further liberalised in March 2002 wherein Indian parties investing in JVs/WOSs outside India were permitted to invest an amount not exceeding US$ 100 million as against the earlier limit of US$ 50 million in a financial year. Also, the investments under the automatic route could be funded by withdrawal of foreign exchange from an authorised dealer (AD) not exceeding 50 per cent of the net worth of the Indian party. With a view to enabling Indian corporates to become global players by facilitating their overseas direct investment, permitted end-use for ECB was enlarged to include overseas direct investment in JVs/WOSs in February 2004. This was designed to facilitate corporates to undertake fresh investment or expansion of existing JV/WOS including mergers and acquisitions abroad by harnessing resources at globally competitive rates. In order to promote Indian investment abroad and to enable Indian companies to reap the benefits of globalisation, the ceiling of investment by Indian entities was revised from 100 per cent of the net worth to 200 per cent of the net worth of the investing company under the automatic route for overseas investment. The limit of 200 per cent of the net worth of the Indian party was enhanced to 300 per cent of the net worth in June 2007 under automatic route (200 per cent in case of registered partnership firms). In September 2007, this was further enhanced to 400 per cent of the net worth of the Indian party. As a simplification of the procedure, share certificates or any other document as an evidence of investment in the foreign entity by an Indian party which has acquired foreign security should not be submitted to the Reserve Bank. The share certificates or any other document as evidence of investment where share certificates are not issued would be required to be submitted to and retained by the designated AD category–I bank, which would be required to monitor the receipt of such documents to ensure bona fides of the documents so received. The Indian venture capital funds (VCFs), registered with the SEBI, are permitted to invest in equity and equity-linked instruments of off-shore venture capital undertakings, subject to an overall limit of US$ 500 million and compliance with the SEBI regulations issued in this regard. The Liberalised Remittance Scheme (LRS) for Resident Individuals was further liberalised by enhancing the existing limit of US$ 100,000 per financial year to US$ 200,000 per financial year (April-March) in September 2007. The limit for portfolio investment by listed Indian companies in the equity of listed foreign companies was raised in September 2007 from 35 per cent to 50 per cent of the net worth of the investing company as on the date of its last audited balance sheet. Furthermore, the requirement of reciprocal 10 per cent shareholding in Indian companies has been dispensed with. The aggregate ceiling for overseas investment by mutual funds, registered with SEBI, was enhanced from US$ 4 billion to US$ 5 billion in September 2007. This was further raised to US$ 7 billion in April 2008. The existing facility to allow a limited number of qualified Indian mutual funds to invest cumulatively up to US$ 1 billion in overseas Exchange Traded Funds, as may be permitted by the SEBI, would continue. The investments would be subject to the terms and conditions and operational guidelines as issued by SEBI. Registered Trusts and Societies engaged in manufacturing/educational sector have been allowed in June 2008 to make investment in the same sector(s) in a Joint Venture or Wholly Owned Subsidiary outside India, with the prior approval of the Reserve Bank. Registered Trusts and Societies which have set up hospital(s) in India have been allowed in August 2008 to make investment in the same sector(s) in a JV/WOS outside India, with the prior approval of the Reserve Bank. * Prepared in the Division of International Trade, Department of Economic Analysis and Policy. The previous issue of the article was published in RBI Bulletin, April 2009. 1 India’s outward FDI in this review refers to Indian investment abroad in joint ventures (JVs) and wholly owned subsidiaries (WOSs) by Indian public and private limited companies, registered partnership firms and remittances in respect of production sharing agreements for oil exploration. 2 Indian residents are permitted to make investment in overseas joint ventures and wholly owned subsidiaries under automatic route and approval route. Under automatic route, all proposals are routed through designated authorised dealer banks and these do not require prior approval from the Reserve Bank. Proposals not covered by the conditions under the automatic route require the prior clearance of the Reserve Bank and come under approval route. 3 Financing of outward FDI by Indian entities is broadly in the form of equity, loan and guarantee. These include sources such as, drawal of foreign exchange in India, capitalisation of exports, funds raised through external commercial borrowings, foreign currency convertible bonds and ADRs/GDRs, and also through leveraged buyouts by way of setting up of special purpose vehicles (SPVs). The equity data presented in this review do not include equity of individuals and banks, and the SPVs set up for funding overseas investment, while BoP statistics, in addition, include the equity of banks (unincorporated banks’ branches operating abroad). |
||||||||||||||||||||||||||||||||||||||||||||||||||||||||||||||||||||||||||||||||||||||||||||||||||||||||||||||||||||||||||||||||||||||||||||||||||||||||||||||||||||||||||||||||||||||||||||||||||||||||||||||||||||||||||||||||||||||||||||||||||||||||||||||||||||||||||||||||||||||||||||||||||||||||||||||||||||||||||||||||||||||||||||||||||||||||||||||||||||||||||||||||||||||||||||||||||||||||||||||||||||||||||||||||||||||||||||||||||||||||||||||||||||||||||||||||||||||||||||||||||||||||||||||||||||||||||||||||||||||||||||||||||||||

Share this page:


Install the RBI mobile application and get quick access to the latest news!


