International Banking Statistics of India – December 31, 2008* The article presents analysis of international liabilities and assets of banks in India, classified under Locational Banking Statistics (LBS) and consolidated international/foreign claims under Consolidated Banking Statistics (CBS), collected as per the reporting system of the Bank for International Settlements (BIS), for the quarter ended December 2008. These data are compared with those as at the end of the previous quarters and a year ago. The analysis of international liabilities/assets, based on LBS, has been undertaken by instrument, country and sector of customer/borrower, currency and country of incorporation of reporting bank; and the consolidated international claims, based on CBS, according to country and sector of borrower and residual maturity. Further, a broad comparison of international/ foreign claims of BIS reporting banks vis-à-vis Indian Banks at the end of December 2007 has also been covered. Besides, the article details international/foreign claims derived from on- balance sheet items, viz., loans and deposits, holdings of securities as well as off- balance sheet items, viz., derivatives, guarantees and credit commitments on ultimate risk basis. Highlights
International Liabilities
- The international liabilities (in Rupees) of banks in India, as at end-December 2008 declined by 2.2 per cent over the position a year ago.
- The international liabilities (in Rupees) of banks in India, as at end-December 2008 declined by 0.9 per cent over the previous quarter
- The components of international liabilities causing the decline on year-on-year basis were ADRs / GDRs, equities of banks held by non-residents and other issues of debt securities.
- At the end of December 2008, composition of currency of the international liabilities revealed that international liabilities denominated in Indian Rupee, which comprise mainly of NRI deposits, continued to have the largest share. However, the share of the international liabilities denominated in this currency (Indian Rupee) was lower than the corresponding share a year ago.
- For the reference quarter, the share of the international liabilities towards the non-bank sector was lower at 69.3 per cent than 77.9 per cent a year ago.
International Assets
- At end-December 2008, the year-on-year growth of international assets (in Rupees) of banks in India was at 7.9 per cent over the previous year.
- The international assets, as at the end of December 2008 registered an increase of 2.4 per cent over its position in the previous quarter.
- The year-on-year growth in the international assets, for the quarter, was on account of the components NOSTRO balances, investment in equities abroad, investment in foreign government securities, loans to non-residents, etc. while the increase over the previous quarter was due to increase in the NOSTRO balances alone.
- In contrast to an increasing trend since December 2007 till September 2008, the share of the non-bank sector in the international assets, as at end-December 2008, declined drastically to 62.9 per cent from 72.9 per cent as at end of September 2008.
- As at end-December 2008, almost all (99.5 per cent) the assets denominated in Indian Rupee were towards non-bank sector.
Consolidated Banking Statistics
- The growth, on year-on-year basis in consolidated international claims (in Rupees) of banks based on immediate risk, as at end-December 2008, was 24.6 per cent as compared to 14.9 per cent registered a year ago.
- Consolidated international claims of Indian banks on immediate risk basis, as at the end-December 2008, continued to be of short-term nature (less than one year) and accounted for 60.7 per cent of total claims, compared to 69.1 per cent a year ago.
I. Introduction
International Banking Statistics (IBS) is defined as banks’ on-balance sheet liabilities and assets vis-à-vis non-residents in any currency or unit of account along with such liabilities and assets vis-à-vis residents in foreign currencies or units of account. The IBS comprises Locational Banking Statistics (LBS) and Consolidated Banking Statistics (CBS). The LBS are designed to provide comprehensive and consistent quarterly data on international banking business conducted in the Bank for International Settlements (BIS) reporting area. The purpose of CBS is to provide comprehensive and consistent quarterly data on banks’ financial claims on other countries, on immediate borrower basis for providing a measure of country transfer risk and on an ultimate risk basis for assessing country risk exposures of national banking system. LBS provides the assets and liabilities by instrument/ components, currency, sector, country of residence of counter-party / transacting unit, and nationality of reporting banks, while CBS provides data on international/foreign claims as per residual maturity and sector of borrower along with the exposures by country of immediate borrower and on the reallocation of claims (i.e. risk transfers) to the country of ultimate risk. The BIS reporting system of IBS was revised since March 2005, inter alia, covering the claims of domestic reporting banks arising from derivatives, guarantees and credit commitments.
Other than India, central banks from 42 other countries report aggregate LBS to BIS while central banks from 30 countries report aggregate CBS under the BIS reporting system of IBS. The data are published as a part of the BIS Quarterly Review. This article presents a brief analysis of the LBS as well as CBS for India for the quarter ending December 2008. It also presents data on comparative position of CBS of India vis-à-vis other countries based on data published by BIS1 . II. Data Coverage and Methodology2
The analysis is based on data as on December 31, 2008 reported by 85 banks. These banks are authorised to conduct business in foreign exchange through their branches, designated as authorised dealers. These banks include 57 Indian banks and 28 foreign banks (incorporated in 21 countries). Out of the 57 Indian banks, 27 are public sector banks (including IDBI Ltd.), 20 are private sector banks and 10 are co-operative banks. The banks received data from their branches, which in turn are consolidated at bank level and submitted to the Reserve Bank. The details such as asset / liability, actual currency (24 major currencies and domestic currency), country of transacting unit, sector of the transacting unit, country of ultimate risk, sector of ultimate risk, etc., are reported.
III. Comparison of External Debt Statistics and International Liabilities
The international liabilities of banks covered in IBS (as per BIS definition) and external debt accounted for by banking sector in India are not strictly comparable, since certain items of liabilities, like, American Depositary Receipts (ADRs), Global Depositary Receipts (GDRs), equity of banks held by non-residents, included in IBS, are not part of the external debt statistics. It may be construed that broadly international liabilities of banking sector in India (under IBS reporting) are the sum of external debt statistics (for banking sector in India), liabilities of banks in foreign currency towards residents (EEFC, RFC, Intra-bank FC Deposits), equities of banks held by NRIs, non-debt credit flows on account of ADRs/ GDRs, capital supplied by head offices of foreign banks in India, Rupee and ACU Dollar balance in VOSTRO.
Table 1: International Liabilities of Banks in India |
(US $ million) |
Categories /Items |
Amount Outstanding as at end |
December 2007 |
September 2008 |
December 2008 |
I. |
Items included under External Debt Statistics + |
67,513 |
65,376 |
62,904 |
| |
1. |
Foreign Currency Non-Resident Bank [FCNR(B)] Schemes |
15,522 |
13,812 |
13,418 |
| |
2. |
Non-Resident External (NRE) Rupee A/Cs |
27,756 |
24,778 |
24,410 |
| |
3. |
Foreign Currency Borrowings (includes Inter-bank borrowings and external commercial borrowings of banks) other than through ADRs, GDRs, Bonds, etc. |
15,927 |
20,048 |
18,105 |
| |
4. |
Bonds |
1,971 |
1,966 |
1,651 |
| |
5. |
Floating Rate Notes (FRNs) |
- |
- |
- |
| |
6. |
Foreign Institutional Investors’ (FII) A/Cs |
3,630 |
2,261 |
1,846 |
| |
7. |
Other Own issues of Intl. Debt Securities |
304 |
186 |
0 |
| |
8. |
Non-Resident Ordinary(NRO) Rupee Deposits |
2,402 |
2,326 |
3,475 |
II. |
Items not included under External Debt Statistics |
26 |
51 |
45 |
| |
1. |
Embassy A/Cs |
24 |
51 |
45 |
| |
2. |
ESCROW A/Cs |
3 |
0 |
0 |
III. |
Non-Debt Liabilities (not included in External Debt due to definitional aspects) |
30,764 |
15,544 |
13,593 |
| |
1. |
American Depository Receipts(ADRs) and Global Depository Receipts (GDRs) |
10,588 |
3,763 |
2,935 |
| |
2. |
Equities of banks held by NRIs |
15,530 |
6,313 |
5,351 |
| |
3. |
Capital of foreign banks/branches in India and certain other items in transition |
4,646 |
5,468 |
5,306 |
IV. |
FC Liabilities to Residents (not included in External Debt due to definitional aspects) + |
3,383 |
3,055 |
3,789 |
| |
1. |
Exchange Earners’ Foreign Currency (EEFC) A/Cs |
2,422 |
2,378 |
3,102 |
| |
2. |
Resident Foreign Currency (RFC) Deposits |
398 |
215 |
223 |
| |
3. |
Inter-Bank Foreign Currency Deposits and other Foreign Currency Deposits of Residents |
563 |
461 |
464 |
V. |
Other Items of International Liabilities (not included in External Debt due to definitional aspects) |
368 |
440 |
401 |
| |
1. |
Balances in VOSTRO A/Cs of non-resident banks and exchange houses (including term deposits) |
368 |
440 |
401 |
VI. |
Total International Liabilities (I+II+III+IV+V) |
102,067 |
84,471 |
80,736 |
+ : Data as reported under IBS do not cover all branches and are not comparable with data reported by all bank branches
under a different set of data. Notes: 1 . All figures are inclusive of accrued interest.
2. The FEDAI revaluation rate for Rupee-US Dollar exchange as at end-December 2007, September 2008, and December
2008 were Rs. 39.4150, Rs.46.9650 and Rs. 48.7100 per US Dollar, respectively . 3 . Data have been revised for previous quarters. |
Table 1 presents a classification of the international liabilities as at end of December 2008 covered under IBS, in US dollar terms, into items included and not included under external debt statistics.
IV. Results
IV.1 Locational Banking Statistics
The LBS provides component/ instrument wise, country-wise (residence of transacting unit and the country of incorporation of reporting bank), sector-wise, major currency-wise classification of international liabilities and assets of banks in India. Data presented in this section are based on data reported by branches of banks, which are conducting business in India, viz. the branches of Indian banks and branches of foreign banks in India.
IV.1.A International Liabilities and Assets –Aggregate Level
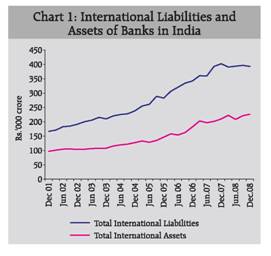
As at end-December 2008, the international assets increased by Rs. 5,284 crore (2.4 per cent) over the previous quarter (Chart 1), while the increase over the previous year was Rs. 16,593 crore (7.9 per cent). On the other hand, the international liabilities witnessed a decline of Rs. 3,454 crore (0.9 per cent) over the previous quarter and a decline of 2.2 per cent (Rs. 9,034 crore) over the previous year. The gap between the international assets and liabilities continued to be lower than the previous quarter level due to the low growth in the international assets and the decline in the international liabilities.
IV.1.B Components and composition of International Liabilities
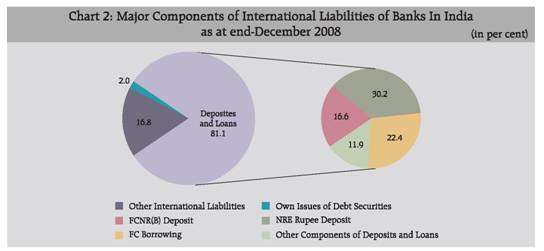
The year-on-year decline in the international liabilities as at end of December 2008, over the previous year, was triggered by the decline in the value of ADRs / GDRs, equities of banks held by the nonresidents and other own issues of international debt securities (Statement I). Other components such as FCNR(B), foreign currency borrowings, VOSTRO balances, NRO and NRE deposits and capital/ remittable profits of foreign banks in India, on the other hand, recorded a substantial rise during the period.
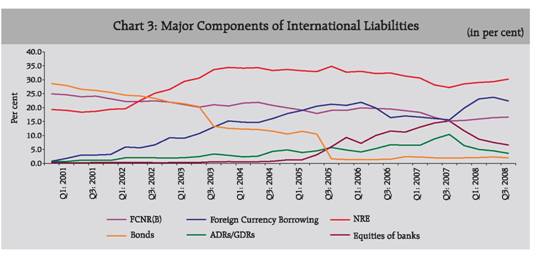
Major components of the international liabilities of banks in India are presented in Chart 2 and Chart 3. The percentage share of the major component ‘Deposits and Loans’ in total international liabilities increased to 81.1 per cent as at end December-2008 from 67.6 per cent a year ago, with a corresponding decline in the share of the major component ‘Other International Liabilities’ to 16.8 per cent from 30.1 per cent during the period.
During the period, foreign currency borrowings, NRE and NRO deposits have contributed primarily to the increase in the share of the ‘Loans and Deposits’.
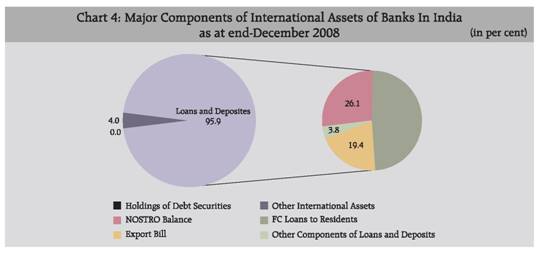
IV.1.C Components and composition of International Assets
As at end-December 2008, the year-on-year growth in the international assets (Chart 4 and Chart 5) was on account of the components NOSTRO balances, investment in equities abroad, investment in foreign government securities, loans to non-residents and foreign currency loans to residents. The rise in the international assets over the previous quarter, on the other hand, was due to NOSTRO balances only and all the other components registered a decline or only a marginal rise.
The composition of the international assets in terms of the shares by the three major components (viz. ‘Loans and Deposits’, ‘Holdings of Debt Securities’ and ‘Other International Assets’) in the total international assets remained more or less same since December 2007 [Statement I]. Due to the substantial increase in the NOSTRO balances for the reference quarter, its share to the total international assets surged to 26.1 per cent from 17.4 per cent in the previous quarter.
IV.1.D Composition of Liabilities and Assets by Sector and Currency
As at end December 2008, the share of the international liabilities towards the non-bank sector was lower at 69.3 per cent than 77.9 per cent a year ago (Statement II, Chart 6). As regards the currency composition of the international liabilities, the Indian Rupee continued to be the dominating currency, at end December 2008, though it declined over the position a year ago.
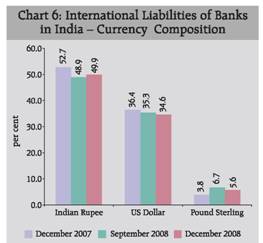
The sector and currency wise composition of total international liabilities as at end of December 2008 showed that as high as 85.4 per cent and 81.0 per cent of liabilities denominated in Indian Rupees and Pound Sterling, respectively, are towards non-bank sector, while 71.1 per cent and 53.9 per cent liabilities denominated in Euro and US Dollar are towards non-bank sector, respectively.
After an increasing trend, since December 2007 till September 2008, at the end of December 2008, the share of non-bank sector in the international assets declined drastically to 62.9 per cent (Statement II) from 72.9 per cent as at end September 2008. In terms of the currency composition of international assets for all sectors as at end-December 2008, the US Dollar continued to be the major currency with a share of 82.5 per cent, distantly followed by Euro (6.0 per cent), Indian Rupee (3.8 per cent) and Pound Sterling (2.5 per cent) (Chart 7, Statement II).
Sector and currency-wise composition of total assets showed that as at end December 2008, almost all (99.5 per cent) assets denominated in Indian Rupee are towards non-bank sector. For the assets denominated in US Dollar, Euro and Pound Sterling, non-bank sector accounted for 64.4 per cent, 64.3 per cent and 20.2 per cent, respectively.
IV.1.E Composition by Country of Residence of Transaction Units
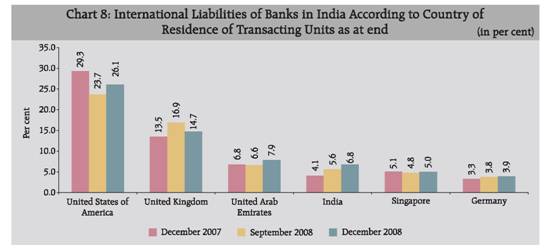
Statement III presents the classification of liabilities and assets according to country of residence of transacting unit denominated in all as well as foreign currencies. As at end of December 2008, about 55.5 per cent of total international liabilities of banks were towards the transacting units (bank and non-bank sectors) of four countries, viz., the USA (26.1 per cent), the UK (14.7 per cent),UAE (7.9 per cent) and India (6.8 per cent) (Chart 8), while the liabilities towards these countries had a share of 52.8 per cent to the total liabilities in the previous quarter and 53.7 per cent a year ago. The share of the liabilities towards India depicted an increasing trend since December 2007.
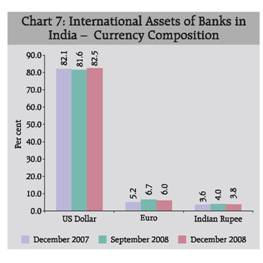
Table 2: International Liabilities and Assets of Banks in India (branches of Indian and Foreign Banks in India) |
(in Rs. crore) |
Items |
Amount Outstanding # as at end |
Growth (in Rs. Crore) [absolute/ in %] over |
December 2007 |
September 2008 |
December 2008 |
International Liabilities |
Rs. Crore+ |
US $ million |
Rs. Crore+ |
US $ million |
Rs. Crore+ |
US $ million |
Prev Qtr |
Prev Yr |
Liabilities to residents and non-residents |
190,137 |
48,240 |
202,914 |
43,205 |
197,074 |
40,459 |
-5,840 |
6,937 |
denominated in foreign currencies |
(47.3) |
(47.3) |
(51.1) |
(51.1) |
(50.1) |
(50.1) |
-2.9 |
3.6 |
Liabilities to non-residents |
212,160 |
53,827 |
193,803 |
41,265 |
196,189 |
40,277 |
2,386 |
-15,971 |
denominated in Indian Rupees |
(52.7) |
(52.7) |
(48.9) |
(48.9) |
(49.9) |
(49.9) |
1.2 |
-7.5 |
Total International |
402,297 |
102,067 |
396,717 |
84,471 |
393,263 |
80,736 |
-3,454 |
-9,034 |
Liabilities + |
(100.0) |
(100.0) |
(100.0) |
(100.0) |
(100.0) |
(100.0) |
-0.9 |
-2.2 |
International Assets |
|
|
|
|
|
|
|
|
Foreign Currency(FC) Assets (includes FC loans to residents and non-residents, Outstanding Export Bills, FC lending to banks in India, FC deposits with banks in India, Overseas FC Assets, Remittable profits of foreign branches of Indian banks, etc.) |
202,469 |
51,369 |
212,352 |
45,215 |
217,958 |
44,746 |
5,606 |
15,489 |
|
(96.4) |
(96.4) |
(96.0) |
(96.0) |
(96.2) |
(96.2) |
2.6 |
7.7 |
Assets in Indian Rupees with Non- residents (includes Rupee loans to non- |
7,468 |
1,895 |
8,894 |
1,894 |
8,572 |
1,760 |
-322 |
1,104 |
residents out of non-resident deposits) |
(3.6) |
(3.6) |
(4.0) |
(4.0) |
(3.8) |
(3.8) |
-3.6 |
14.8 |
Total International Assets |
209,937 |
53,263 |
221,246 |
47,109 |
226,530 |
46,506 |
5,284 |
16,593 |
| |
(100.0) |
(100.0) |
(100.0) |
(100.0) |
(100.0) |
(100.0) |
2.4 |
7.9 |
+ : 1 crore= 10 million. The FEDAI revaluation rate for Rupee-US Dollar exchange as at end-December 2007, September 2008, and December 2008 were Rs 39.415 Rs. 46.9650 and Rs.48.7100 per US Dollar, respectively .
# : Data pertain to only reporting branches. As such, these data provide broad dimensions of international assets and liabilities,
Notes: 1. All figures are inclusive of accrued interest.
2. Figures in brackets represent percentages to total international assets
3. Sum of the components may not tally with total due to rounding off .
4. Data have been revised for previous quarters. |
The country-wise breakup of major components of the international liabilities (Statement IV) revealed that the share of the (foreign currency) borrowings from the Indian units / entities to the total borrowings (for all countries) has been increasing since December 2007. As at end of December 2008, while the share of the borrowings towards the USA increased sharply over that at the end of previous year, the share towards the UK declined during the period (Statement IV).
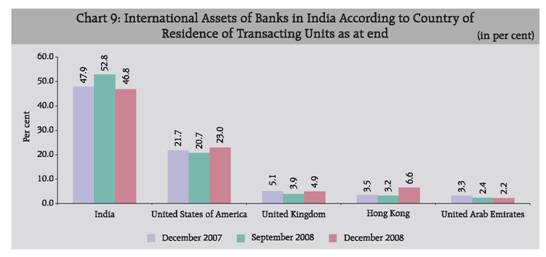
For the reference quarter, of the total international assets of banks, 69.8 per cent were concentrated in the two countries, viz., India (46.8 per cent) and the USA (23.0 per cent) (Chart 9, Statement III). Among the major components of the international assets, the steep rise in the NOSTRO balances as at the end of December 2008, over the previous quarter, was primarily towards the banks from Hong Kong and the UK (Statement V). IV.1.F Composition by Country of Incorporation of Reporting Bank
The classification of international liabilities of banks according to their country of incorporation is presented in Statement VI. Among the banks incorporated in countries other than India, as at end December 2008, the USA had the highest share in international liabilities at 6.9 per cent while those from the Netherlands, Hong Kong and the UK had shares ranging between 2.7 per cent to 6.8 per cent. The banks incorporated in India accounted for the highest share at 71.5 per cent as at end-December 2008 as against a share of 79.8 per cent a year ago.
For the reference quarter, the share of the banks incorporated in India in the international assets declined to 70.7 per cent from 79.1 per cent registered a year ago. The share of the banks incorporated in the UK registered an increase to 9.6 per cent from 3.7 per cent during the same period (Statement VI).
IV.2 Consolidated Banking Statistics (CBS)
The CBS provides country-wise (immediate country risk exposure), residual-maturity-wise and sector-wise classification of international claims (on-balance-sheet) of banks on countries other than India. It also provides consolidated country risk exposure on an ultimate risk basis and international claims arising out of derivatives, guarantees and credit commitments.
There are four reports comprising the consolidated banking statistics on immediate risk basis. The first report is sum of the consolidated banking statistics for (i) domestic banks, (ii) inside (reporting) area foreign banks and (iii) outside (reporting) area foreign banks and the remaining three reports recount the above three components (i), (ii) and (iii), separately. The data presented in this section and Statement VII are based on data reported by banks functioning in India as well as foreign branches of Indian banks i.e. based on the first combined report and no separate discussion is done on other three reports.
IV.2.A Overall Exposure/Claims on Immediate Risk Basis
Consolidated international claims of banks, based on immediate risk basis, on countries other than India as at end-December 2008, recorded an increase of Rs. 13,558 crore (7.6 per cent) to Rs.1,91,118 crore over the previous quarter and an increase of Rs. 37,765 crore (24.6 per cent) over the position a year ago (Statement VII).
IV.2.B Composition by Country of Residence of Transacting Unit – Immediate Risk
Consolidated international claims of banks, classified according to country of immediate risk, revealed that as at end of December 2008 reporting banks’ claims on the USA accounted for the largest share (23.0 per cent), followed by the UK (13.2 per cent), Hong Kong (7.7 per cent) and Singapore (7.6 per cent) (Chart 10 and Table 3).
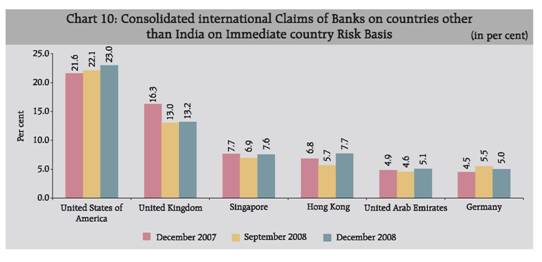
Table 3: Consolidated International Claims of Indian Banks on Countries other than India on Immediate Country Risk Basis |
Country |
Amount Outstanding as at end |
December 2007 |
September 2008 |
December 2008 |
Rs. crore+ |
US $ million |
Rs. crore+ |
US $ million |
Rs. crore+ |
US $ million |
Total Consolidated International Claims (excluding claims on India) |
153,353 |
38,907 |
177,560 |
37,807 |
191,118 |
39,236 |
of which: |
|
|
|
|
|
|
United States of America # |
33,114 |
8,401 |
39,294 |
8,367 |
43,986 |
9,030 |
| |
(21.6) |
(21.6) |
(22.1) |
(22.1) |
(23.0) |
(23.0) |
United Kingdom@ |
24,987 |
6,339 |
23,109 |
4,920 |
25,246 |
5,183 |
| |
(16.3) |
(16.3) |
(13.0) |
(13.0) |
(13.2) |
(13.2) |
Singapore |
11,749 |
2,981 |
12,303 |
2,620 |
14,454 |
2,967 |
| |
(7.7) |
(7.7) |
(6.9) |
(6.9) |
(7.6) |
(7.6) |
Hong Kong |
10,487 |
2,661 |
10,056 |
2,141 |
14,779 |
3,034 |
| |
(6.8) |
(6.8) |
(5.7) |
(5.7) |
(7.7) |
(7.7) |
United Arab Emirates |
7,467 |
1,894 |
8,082 |
1,721 |
9,660 |
1,983 |
| |
(4.9) |
(4.9) |
(4.6) |
(4.6) |
(5.1) |
(5.1) |
Germany |
6,896 |
1,750 |
9,742 |
2,074 |
9,565 |
1,964 |
| |
(4.5) |
(4.5) |
(5.5) |
(5.5) |
(5.0) |
(5.0) |
+ : 1 crore= 10 million. The FEDAI revaluation rate for Rupee-US Dollar exchange as at end-December 2007, September 2008, and December 2008 were Rs. 39.4150Rs 46.9650 and Rs. 48.7100 per US Dollar, respectively .
@ : excluding Guernsey, Isle of Man and Jersey, # : includes Miday Island and Wake Islands
Note: 1. Figures in brackets represent percentages to the total international claims. 2. Data have been revised for previous quarters. |
IV.2.C Composition by Sector -Immediate Risk Basis
Sectoral classification of consolidated international claims of banks on other countries, on immediate country risk basis is presented in Statement VII. As at end-December 2008, the share of the banking sector in the international claims increased marginally to 39.3 per cent from 38.4 per cent a year ago. A corresponding decline was observed in the share towards the non-bank private sector.
The sectoral classification of the consolidated international claims of banks against various countries depicts a shift in the sectoral composition during the period December 2007 to December 2008. For the international claims against the USA, UAE and Singapore the share of the banking sector declined during the period while the share of the banking sector against the UK, Hong Kong and Switzerland increased during the period.
IV.2.D Composition by Residual Maturity- Immediate risk basis
As evidenced by the data as at end-December 2008, the reporting banks continued to prefer short-term lending/ investments over the long-term portfolio. However, the share of the long-term claims to the total international claims has increased to 37.7 per cent from 29.8 per cent a year ago. The details of consolidated international claims of banks according to residual maturity and country of immediate risk are provided in Statement VII. IV.2.E Exposure/Claims on Ultimate Risk Basis
Consolidated foreign claims of domestic banks (international claims of Indian banks plus local claims in local currency of foreign offices of Indian banks) on ultimate risk basis, as at end-December 2008, showed a rise to Rs. 180,585 crore (23.1 per cent) from Rs. 146,733 crore a year ago (Table 4). Consolidated foreign claims of Indian banks, for the quarter, against the USA, Singapore,Canada and UAE witnessed an increase over the levels as at end-December 2007, while that against the UK declined during the period.
The consolidated claims/exposure of Indian banks, on countries other than India, arising out of derivatives, as at end-December 2008, increased to Rs. 19,001 crore from Rs. 14,595 crore a year ago. The claims arising out of guarantees, as at end-December 2008 registered a substantial increase over the previous quarter level as well as the level a year ago. For the reference quarter, the consolidated claims of India, on countries other than India, arising out of credit commitments witnessed a substantial increase over the position a year ago.
Table 4: Consolidated Foreign Claims and Contingent Claims/Exposures arising from Derivatives, Guarantees and Credit Commitments of Domestic Banks on Ultimate Risk Basis |
(Rs. crore) |
Total Foreign Claims |
Contingent Claims/Exposures Arising from Guarantees |
Country of Ultimate Risk |
Consolidated Claims as at end |
Country of Ultimate Risk |
Consolidated Claims as at end |
December 2007 |
September 2008 |
December 2008 |
December 2007 |
September 2008 |
December 2008 |
Total |
146,733 |
180,210 |
180,585 |
Total |
27,191 |
43,412 |
45,920 |
of which: |
|
|
|
of which: |
|
|
|
United States of |
30,570 |
35,439 |
37,941 |
United States of |
6994 |
6606 |
8884 |
America # |
(20.8) |
(19.7) |
(21.0) |
America # |
(25.7) |
(15.2) |
(19.3) |
United Kingdom @ |
18768 |
24860 |
17537 |
China |
2041 |
3021 |
5156 |
| |
(12.8) |
(13.8) |
(9.7) |
|
(7.5) |
(7.0) |
(11.2) |
Singapore |
12071 |
12504 |
14725 |
United kingdom |
1066 |
2116 |
3619 |
| |
(8.2) |
(6.9) |
(8.2) |
|
(3.9) |
(4.9) |
(7.9) |
Canada |
8155 |
11494 |
11239 |
Germany |
1834 |
3799 |
3433 |
| |
(5.6) |
(6.4) |
(6.2) |
|
(6.7) |
(8.8) |
(7.5) |
United Arab Emirates |
7199 |
8230 |
9130 |
United Arab Emirates |
1568 |
2657 |
3270 |
| |
(4.9) |
(4.6) |
(5.1) |
|
(5.8) |
(6.1) |
(7.1) |
Contingent Claims/Exposures Arising from Derivatives |
Contingent Claims/Exposures Arising from Credit Commitments |
Country of Ultimate Risk |
Consolidated Claim as at end |
Country of Ultimate Risk |
Consolidated Claim as at end |
December 2007 |
September 2008 |
December 2008 |
December 2007 |
September 2008 |
December 2008 |
Total |
14,595 |
18,182 |
19,001 |
Total |
2083 |
6482 |
6737 |
of which: |
|
|
|
of which: |
|
|
|
United Kingdom @ |
3411 |
4169 |
4887 |
United States of |
248 |
3719 |
4113 |
| |
(23.4) |
(22.9) |
(25.7) |
America # |
(11.9) |
(57.4) |
(61.1) |
United States of |
2967 |
2975 |
3491 |
Bangladesh |
863 |
1122 |
870 |
America # |
(20.3) |
(16.4) |
(18.4) |
|
(41.4) |
(17.3) |
(12.9) |
France |
1606 |
2745 |
2284 |
Singspore |
50 |
412 |
458 |
| |
(11.0) |
(15.1) |
(12.0) |
|
(2.4) |
(6.4) |
(6.8) |
Switzerland |
954 |
1127 |
1217 |
Hongkong |
9 |
218 |
428 |
| |
(6.5) |
(6.2) |
(6.4) |
|
(0.4) |
(3.4) |
(6.4) |
Germany |
2296 |
1258 |
1135 |
Mauritius |
54 |
239 |
245 |
| |
(15.7) |
(6.9) |
(6.0) |
|
(2.6) |
(3.7) |
(3.6) |
@ : excluding Guernsey, Isle of Man and Jersey. # : includes Miday Island and Wake Islands.
Note: Figures in brackets represent percentages to total. |
IV.2.F Comparison of CBS of the Countries Reporting Data to BIS vis-à-vis CBS of India
A comparative position of CBS of India and the CBS of BIS reporting countries as at end-December 2008 and end-December 2007 has been presented in various tables (Table 5, 6, 7 and 8) which cover three aspects, viz., (i) consolidated international/ foreign claims of banks in the BIS reporting countries on all other countries, (ii) consolidated international/foreign claims of banks in the BIS reporting countries on India, and (iii) international/foreign claims of Indian Banks on countries other than India. The data published by the BIS relate to the consolidated total international/ foreign claims of all BIS reporting countries on other countries. Further, the claims of India denote claims of Indian Banks’ branches/offices, operating in India and abroad, on countries other than India.
Table 5: Claims of BIS Reporting Banks on India & other Countries and Indian Banks’ claim on other Countries - Immediate Country Risk basis |
(US $ billion) |
Maturity/sector |
Claims of BIS Reporting
Countries’ Banks on all Countries including India |
Claims of BIS Reporting Countries’ Banks on India |
Claims of Indian Banks on countries other than India # |
December 2007 |
December 2008 |
December 2007 |
December 2008 |
December 2007 |
December 2008 |
(a) Total Foreign |
34,216.7 |
30,425.4 |
218.2 |
207.2 |
43.0 |
41.3 |
Claims (b+c) |
(100.0) |
(100.0) |
(100.0) |
(100.0) |
(100.0) |
(100.0) |
(b) Local Claims in |
10,984.0 |
10,161.4 |
76.3 |
73.9 |
5.7 |
4.4 |
Local Currencies |
(32.1) |
(33.4) |
(35.0) |
(35.7) |
(13.3) |
(10.5) |
(C) Total International |
23,232.7 |
20,264.0 |
141.9 |
133.3 |
37.3 |
37.0 |
Claims |
(67.9) |
(66.6) |
(65.0) |
(64.3) |
(86.7) |
(89.5) |
of which: |
|
|
|
|
|
|
Maturity |
Short Term * |
12,395.2 |
10,145.7 |
77.7 |
70.3 |
25.3 |
21.5 |
| |
|
(53.4) |
(50.1) |
(54.7) |
(52.8) |
(67.8) |
(58.3) |
| |
Long Term ** |
7,077.7 |
7,017.4 |
35.9 |
47.3 |
11.6 |
14.8 |
| |
|
(30.5) |
(34.6) |
(25.3) |
(35.5) |
(31.1) |
(40.0) |
Sector $ |
Bank |
10,670.5 |
9,060.9 |
42.8 |
44.6 |
14.1 |
13.8 |
| |
|
(45.9) |
(44.7) |
(30.2) |
(33.5) |
(37.8) |
(37.4) |
| |
Non-Bank |
2,355.2 |
2,225.0 |
6.3 |
6.8 |
0.2 |
0.2 |
| |
Public |
(10.1) |
(11.0) |
(4.4) |
(5.1) |
(0.5) |
(0.4) |
| |
Non-Bank |
9,954.7 |
8,730.5 |
89.5 |
78.1 |
23.1 |
23.0 |
| |
Private |
(42.8) |
(43.1) |
(63.1) |
(58.6) |
(61.9) |
(62.2) |
# : Claims of Indian Banks’ branches/offices operating in India and abroad, on countries other than India; these data are taken from the data supplied to the BIS.
* : Claims with a residual maturity of up to and including one year
** : Claims with a maturity of over one year (excluding unallocated maturity)
$ : Excluding unallocated sector
Note: Figures in brackets represent percentages to total international claims.
Source: BIS International Consolidated Banking Statistics (www.bis.org) |
Table 6: International Claims of BIS Reporting Banks on all other Countries - by Country of Incorporation |
(US $ billion) |
Country of Incorporation |
International Claims on all other Countries |
December 2007 |
December 2008 |
Total International Claims |
18,397.1 |
15,854.8 |
of Which: |
|
|
Germany |
3,681.8 |
2,979.5 |
| |
(20.0) |
(18.8) |
France |
2,187.4 |
1,979.7 |
| |
(11.9) |
(12.5) |
Japan |
1,973.1 |
1,904.2 |
| |
(10.7) |
(12.0) |
United Kingdom |
1,901.2 |
1,752.1 |
| |
(10.3) |
(11.1) |
Switzerland |
1,440.8 |
1,076.8 |
| |
(7.8) |
(6.8) |
Netherlands |
1,279.1 |
923.7 |
| |
(7.0) |
(5.8) |
United States |
1,042.0 |
871.0 |
| |
(5.7) |
(5.5) |
India # |
37.3 |
37.0 |
| |
(0.2) |
(0.2) |
# : Claims of Indian Banks’ branches/offices operating in India and abroad, on countries other than India; these data are taken from the data supplied to the BIS.
Note : Figures in brackets represent percentages to total international claims.
Source: BIS International Consolidated Banking Statistics (www.bis.org) |
Table 7: International Claims of BIS Reporting Banks on India - by Country of Incorporation |
(US $ billion) |
Country of Incorporation |
International Claims on India |
December 2007 |
December 2008 |
Total International |
120.0 |
108.9 |
Claims |
|
|
of Which: |
|
|
United States |
29.3 |
18.2 |
| |
(24.4) |
(16.7) |
United Kingdom |
17.7 |
18.9 |
| |
(14.8) |
(17.4) |
Germany |
12.7 |
15.8 |
| |
(10.6) |
(14.5) |
Netherlands |
11.9 |
10.8 |
| |
(9.9) |
(9.9) |
Japan |
11.5 |
11.0 |
| |
(9.6) |
(10.1) |
Switzerland |
10.4 |
4.5 |
| |
(8.7) |
(4.1) |
Source: BIS International Consolidated Banking Statistics (www.bis.org).
Note: 1. The data on international claims on India of banks incorporated in Canada and Ireland are masked by the BIS.
2. Figures in brackets represent percentages to total international claims. |
Table 8: Consolidated Foreign Claims of BIS Reporting Banks on India & other Countries and Indian Banks’ claim on other Countries: Ultimate Risk Basis |
(US $ billion) |
Claims |
Claims of BIS Reporting
Countries’ Banks on all Countries including India## |
Claims of BIS Reporting
Countries’ Banks on India |
Claims of Indian Banks on countries other than India # |
December 2007 |
December 2008 |
December 2007 |
December 2008 |
December 2007 |
December 2008 |
(a) Total Foreign Claims |
28,260.8 |
25,087.2 |
198.5 |
183.4 |
37.2 |
37.1 |
of which : |
|
|
|
|
|
|
Sector |
Banks |
7,895.7 |
6,673.8 |
40.2 |
39.5 |
18.1 |
17.3 |
| |
|
(27.9) |
(26.6) |
(20.3) |
(21.5) |
(48.7) |
(46.6) |
| |
Non-Bank Public |
3,946.7 |
3,974.0 |
15.6 |
16.3 |
0.4 |
0.5 |
| |
|
(14.0) |
(15.8) |
(7.9) |
(8.9) |
(1.1) |
(1.3) |
| |
Non-Bank Private |
16,229.1 |
14,194.2 |
142.7 |
127.3 |
18.7 |
19.3 |
| |
|
(57.4) |
(56.6) |
(71.9) |
(69.4) |
(50.3) |
(52.0) |
(b) Other Exposures |
|
|
|
|
|
|
Derivatives |
3,483.6 |
7,232.3 |
13.2 |
25.9 |
3.7 |
3.9 |
Guarantees |
7,404.2 |
6,333.0 |
19.7 |
23.1 |
6.9 |
9.4 |
Credit Commitments |
4,744.6 |
4,029.5 |
14.9 |
15.9 |
0.5 |
1.4 |
# : Claims of Indian Banks’ branches/offices operating in India and abroad, on countries other than India; these data are taken from the data supplied to the BIS.
## : Out of thirty countries submitting CBS on immediate risk basis, twenty four countries submitted CBS on ultimate risk basis to the BIS
Note : Figures in brackets represent percentages to total foreign claims.
Source: BIS International Consolidated Banking Statistics (www.bis.org) |
Statement I: International Liabilities/Assets of Banks Classified According to Type (Based on LBS Statements) |
(Rs. crore) |
Liability/Asset Category |
International Liabilities |
Amount Outstanding as at end of |
Q4: 2007 |
Q1: 2008 |
Q2: 2008 |
Q3: 2008 |
Q4: 2008 |
1. |
Deposits and Loans |
272,024 |
289,362 |
304,586 |
313,589 |
318,994 |
| |
|
|
(67.6) |
(74.0) |
(77.3) |
(79.0) |
(81.1) |
| |
(a) |
Foreign Currency Non-resident Bank |
61,181 |
60,340 |
62,730 |
64,868 |
65,357 |
| |
|
[FCNR(B)] scheme |
(15.2) |
(15.4) |
(15.9) |
(16.4) |
(16.6) |
| |
(b) |
Resident Foreign Currency (RFC) A/Cs |
1,570 |
1,421 |
1,197 |
1,010 |
1,084 |
| |
|
|
(0.4) |
(0.4) |
(0.3) |
(0.3) |
(0.3) |
| |
(c) |
Exchange Earners Foreign Currency |
9,545 |
10,036 |
10,897 |
11,170 |
15,112 |
| |
|
(EEFC) A/Cs |
(2.4) |
(2.6) |
(2.8) |
(2.8) |
(3.8) |
| |
(d) |
Other foreign currency deposits |
|
|
|
|
|
| |
|
(including Inter-bank Foreign Currency |
2,221 |
1,736 |
1,712 |
2,166 |
2,261 |
| |
|
deposits) |
(0.6) |
(0.4) |
(0.4) |
(0.5) |
(0.6) |
| |
(e) |
Foreign Currency Borrowing (Inter-bank borrowing in India and from abroad, |
62,776 |
77,257 |
90,791 |
94,155 |
88,189 |
| |
|
external commercial borrowings of banks) |
(15.6) |
(19.8) |
(23.1) |
(23.7) |
(22.4) |
| |
(f) |
VOSTRO balances and balances in |
1,451 |
1,485 |
1,867 |
2,066 |
1,954 |
| |
|
exchange houses and in term deposits |
(0.4) |
(0.4) |
(0.5) |
(0.5) |
(0.5) |
| |
(g) |
Non-Resident External Rupee(NRE) |
109,400 |
111,301 |
114,316 |
116,368 |
118,899 |
| |
|
Accounts |
(27.2) |
(28.5) |
(29.0) |
(29.3) |
(30.2) |
| |
(h) |
Non-Resident Ordinary (NRO) Rupee |
9,469 |
11,387 |
10,339 |
10,926 |
16,929 |
| |
|
Accounts |
(2.4) |
(2.9) |
(2.6) |
(2.8) |
(4.3) |
| |
(i) |
Embassy accounts |
93 |
95 |
227 |
239 |
218 |
| |
|
|
(0.0) |
(0.0) |
(0.1) |
(0.1) |
(0.1) |
| |
(j) |
Foreign Institutional Investors’ (FII) |
14,308 |
14,290 |
10,505 |
10,619 |
8,991 |
| |
|
Accounts |
(3.6) |
(3.7) |
(2.7) |
(2.7) |
(2.3) |
| |
(k) |
ESCROW A/Cs |
11 |
13 |
4 |
2 |
1 |
| |
|
|
(0.0) |
(0.0) |
(0.0) |
(0.0) |
(0.0) |
2. |
Own Issues of International Securities |
9,016 |
9,166 |
9,369 |
10,127 |
8,058 |
| |
|
|
(2.2) |
(2.3) |
(2.4) |
(2.6) |
(2.0) |
| |
(a) |
Bonds |
7,770 |
7,980 |
8,322 |
9,231 |
8,040 |
| |
|
|
(1.9) |
(2.0) |
(2.1) |
(2.3) |
(2.0) |
| |
(b) |
Floating Rate Notes (FRNs) |
48 |
48 |
35 |
25 |
19 |
| |
|
|
(0.0) |
(0.0) |
(0.0) |
(0.0) |
(0.0) |
| |
(c) |
Other Own Issues of International |
1,198 |
1,138 |
1,013 |
872 |
0 |
| |
|
Debt Securities |
(0.3) |
(0.3) |
(0.3) |
(0.2) |
(0.0) |
3. |
Other International Liabilities |
121,257 |
92,329 |
79,877 |
73,001 |
66,210 |
| |
|
|
(30.1) |
(23.6) |
(20.3) |
(18.4) |
(16.8) |
| |
(a) |
ADRs/GDRs |
41,733 |
25,111 |
19,861 |
17,673 |
14,298 |
| |
|
|
(10.4) |
(6.4) |
(5.0) |
(4.5) |
(3.6) |
| |
(b) |
Equities of banks held by non-residents |
61,213 |
45,603 |
34,388 |
29,648 |
26,066 |
| |
|
|
(15.2) |
(11.7) |
(8.7) |
(7.5) |
(6.6) |
| |
(c) |
Capital/remittable profits of foreign banks in India and other unclassified |
18,311 |
21,615 |
25,628 |
25,681 |
25,846 |
| |
|
international liabilities |
(4.6) |
(5.5) |
(6.5) |
(6.5) |
(6.6) |
Total International Liabilities + |
402,297 |
390,857 |
393,832 |
396,717 |
393,263 |
| |
(100.0) |
(100.0) |
(100.0) |
(100.0) |
(100.0) |
Statement I: International Liabilities/Assets of Banks Classified According to Type (Based on LBS Statements) (Concld.) |
(Rs. crore) |
Liability/Asset Category |
International Assets |
Amount Outstanding as at end of |
Q4: 2007 |
Q1: 2008 |
Q2: 2008 |
Q3: 2008 |
Q4: 2008 |
1. |
Loans and Deposits |
199464 |
212126 |
198278 |
211606 |
217310 |
| |
|
|
(95.0) |
(95.2) |
(95.1) |
(95.6) |
(95.9) |
| |
(a) |
Loans to Non-residents (includes Rupee |
|
|
|
|
|
| |
|
loans and Foreign Currency (FC) loans |
7,896 |
8,565 |
8,321 |
8,324 |
8,387 |
| |
|
out of non-resident deposits) |
(3.8) |
(3.8) |
(4.0) |
(3.8) |
(3.7) |
| |
(b) |
FC Loans to Residents (incl. loans out of |
|
|
|
|
|
| |
|
FCNR(B) deposits, PCFCs, FC lending to & |
100,423 |
108,440 |
106,393 |
116,257 |
105,582 |
| |
|
FC Deposits with banks in India, etc., |
(47.8) |
(48.7) |
(51.0) |
(52.5) |
(46.6) |
| |
(c) |
Outstanding Export Bills drawn on |
43,899 |
49,011 |
45,951 |
47,872 |
44,041 |
| |
|
non-residents by residents |
(20.9) |
(22.0) |
(22.0) |
(21.6) |
(19.4) |
| |
(d) |
Foreign Currency /TTs, etc., in hand |
382 |
358 |
361 |
571 |
159 |
| |
|
|
(0.2) |
(0.2) |
(0.2) |
(0.3) |
(0.1) |
| |
(e) |
NOSTRO balances including balances in |
|
|
|
|
|
| |
|
Term Deposits with non-resident banks |
46,863 |
45,752 |
37,252 |
38,581 |
59,140 |
| |
|
(includes FCNR funds held abroad) |
(22.3) |
(20.5) |
(17.9) |
(17.4) |
(26.1) |
2. |
Holdings of Debt Securities |
609 |
334 |
287 |
152 |
84 |
| |
|
|
(0.3) |
(0.1) |
(0.1) |
(0.1) |
(0.0) |
| |
(a) |
Investment in Foreign Government |
55 |
41 |
74 |
70 |
61 |
| |
|
Securities (including Treasury Bills) |
(0.0) |
(0.0) |
(0.0) |
(0.0) |
(0.0) |
| |
(b) |
Investment in Other Debt Securities |
554 |
293 |
213 |
81 |
23 |
| |
|
|
(0.3) |
(0.1) |
(0.1) |
(0.0) |
(0.0) |
3. |
Other International Assets |
9,864 |
10,250 |
9,951 |
9,489 |
9,137 |
| |
|
|
(4.7) |
(4.6) |
(4.8) |
(4.3) |
(4.0) |
| |
(a) |
Investments in Equities Abroad |
1,421 |
1,432 |
1,480 |
1,579 |
1,585 |
| |
|
|
(0.7) |
(0.6) |
(0.7) |
(0.7) |
(0.7) |
| |
(b) |
Capital supplied to and receivable profits from foreign branches of Indian banks |
8,443 |
8,818 |
8,471 |
7,910 |
7,552 |
| |
|
and other unclassified intl. assets |
(4.0) |
(4.0) |
(4.1) |
(3.6) |
(3.3) |
Total International Assets + |
209,937 |
222,711 |
208,516 |
221,246 |
226,530 |
| |
(100.0) |
(100.0) |
(100.0) |
(100.0) |
(100.0) |
+ : In view of the incomplete data coverage from all the branches, the data reported under the LBS are not strictly comparable with those capturing data from all the branches ‘-’ : nil/negligible
Notes: 1. Figures in brackets represent percentages to total international liabilities/assets.
2. Totals may not tally due to rounding off .
3. Data have been revised for previous quarters.
4. Q1, Q2, Q3 and Q4 denote quarters ended March, June, September and December, respectively. |
Statement II: Currency and Sector - wise Breakup of International Liabilities/Assets of Banks
(Based on LBS Statements) |
(Rs. crore) |
Currency |
International Liabilities |
All Sector |
Non-Bank Sector |
Q4: 2007 |
Q1: 2008 |
Q2: 2008 |
Q3: 2008 |
Q4: 2008 |
Q4: 2007 |
Q1: 2008 |
Q2: 2008 |
Q3: 2008 |
Q4: 2008 |
Swiss Franc |
370 |
413 |
491 |
567 |
594 |
49 |
59 |
28 |
21 |
59 |
| |
(0.1) |
(0.1) |
(0.1) |
(0.1) |
(0.2) |
(0.0) |
(0.0) |
(0.0) |
(0.0) |
(0.0) |
EURO |
13,074 |
15,304 |
16,423 |
16,399 |
16,802 |
10,370 |
10,826 |
12,574 |
12,425 |
11,944 |
| |
(3.2) |
(3.9) |
(4.2) |
(4.1) |
(4.3) |
(3.3) |
(3.8) |
(4.6) |
(4.6) |
(4.4) |
Pound Sterling |
15,188 |
18,641 |
26,124 |
26,445 |
21,831 |
13,237 |
15,677 |
17,211 |
16,934 |
17,681 |
| |
(3.8) |
(4.8) |
(6.6) |
(6.7) |
(5.6) |
(4.2) |
(5.5) |
(6.3) |
(6.3) |
(6.5) |
Indian Rupee |
212,160 |
203,850 |
195,065 |
193,803 |
196,188 |
191,248 |
179,761 |
168,373 |
166,437 |
167,458 |
| |
(52.7) |
(52.2) |
(49.5) |
(48.9) |
(49.9) |
(61.0) |
(63.0) |
(61.9) |
(61.5) |
(61.4) |
Japanese Yen |
12,838 |
18,035 |
15,162 |
15,473 |
17,451 |
1,600 |
1,874 |
1,401 |
1,213 |
1,178 |
| |
(3.2) |
(4.6) |
(3.8) |
(3.9) |
(4.4) |
(0.5) |
(0.7) |
(0.5) |
(0.4) |
(0.4) |
Other Foreign |
2,372 |
2,288 |
3,367 |
4,181 |
4,341 |
561 |
658 |
1,041 |
1,073 |
983 |
Currencies |
(0.6) |
(0.6) |
(0.9) |
(1.1) |
(1.1) |
(0.2) |
(0.2) |
(0.4) |
(0.4) |
(0.4) |
US Dollar |
146,295 |
132,328 |
137,201 |
139,850 |
136,056 |
96,443 |
76,447 |
71,365 |
72,714 |
73,307 |
| |
(36.4) |
(33.9) |
(34.8) |
(35.3) |
(34.6) |
(30.8) |
(26.8) |
(26.2) |
(26.8) |
(26.9) |
Total |
402,297 |
390,857 |
393,832 |
396,717 |
393,263 |
313,507 |
285,303 |
271,993 |
270,817 |
272,609 |
| |
(100.0) |
(100.0) |
(100.0) |
(100.0) |
(100.0) |
(100.0) |
(100.0) |
(100.0) |
(100.0) |
(100.0) |
| |
International Assets |
Swiss Franc |
3,199 |
2,466 |
1,861 |
1,693 |
1,555 |
2,475 |
1,836 |
1,387 |
1,368 |
1,043 |
| |
(1.5) |
(1.1) |
(0.9) |
(0.8) |
(0.7) |
(1.7) |
(1.2) |
(0.9) |
(0.8) |
(0.7) |
EURO |
10,855 |
13,972 |
13,218 |
14,891 |
13,650 |
7,718 |
9,915 |
9,715 |
9,755 |
8,776 |
| |
(5.2) |
(6.3) |
(6.3) |
(6.7) |
(6.0) |
(5.4) |
(6.3) |
(6.4) |
(6.0) |
(6.2) |
Pound Sterling |
6,512 |
6,018 |
6,082 |
5,258 |
5,690 |
2,772 |
2,216 |
1,784 |
1,442 |
1,147 |
| |
(3.1) |
(2.7) |
(2.9) |
(2.4) |
(2.5) |
(1.9) |
(1.4) |
(1.2) |
(0.9) |
(0.8) |
Indian Rupee |
7,468 |
7,354 |
7,541 |
8,894 |
8,572 |
7,413 |
7,300 |
7,518 |
8,812 |
8,529 |
| |
(3.6) |
(3.3) |
(3.6) |
(4.0) |
(3.8) |
(5.2) |
(4.7) |
(5.0) |
(5.5) |
(6.0) |
Japanese Yen |
3,253 |
4,180 |
3,091 |
3,179 |
3,049 |
2,149 |
2,895 |
1,969 |
1,818 |
1,753 |
| |
(1.5) |
(1.9) |
(1.5) |
(1.4) |
(1.3) |
(1.5) |
(1.9) |
(1.3) |
(1.1) |
(1.2) |
Other Foreign |
6,320 |
7,976 |
6,691 |
6,826 |
7,167 |
428 |
1,222 |
945 |
1,130 |
839 |
Currencies |
(3.0) |
(3.6) |
(3.2) |
(3.1) |
(3.2) |
(0.3) |
(0.8) |
(0.6) |
(0.7) |
(0.6) |
US Dollar |
172,330 |
180,743 |
170,032 |
180,504 |
186,848 |
119,360 |
130,926 |
127,366 |
136,969 |
120,292 |
| |
(82.1) |
(81.2) |
(81.5) |
(81.6) |
(82.5) |
(83.9) |
(83.8) |
(84.5) |
(84.9) |
(84.5) |
Total |
209,937 |
222,711 |
208,516 |
221,246 |
226,530 |
142,314 |
156,309 |
150,683 |
161,294 |
142,378 |
| |
(100.0) |
(100.0) |
(100.0) |
(100.0) |
(100.0) |
(100.0) |
(100.0) |
(100.0) |
(100.0) |
(100.0) |
@ : excluding Guernsey, Isle of Man and Jersey. # : includes Miday Island and Wake Islands. ‘-’ : nil/negligible.
Note: 1. Figures in brackets represent percentages to total in the respective group (column).
2. Totals may not tally due to rounding off.
3. Data have been revised for previous quarters.
4. Q1, Q2, Q3 and Q4 denote quarters ended March, June, September and December, respectively. |
Statement III: International Liabilities/Assets of Banks Classified According to Country of Residence of Transacting Units (Based on LBS Statements) - Amount outstanding as at end |
(Rs. crore) |
Country |
International Liabilities |
All Currencies |
Foreign Currencies |
Q4: 2007 |
Q1: 2008 |
Q2: 2008 |
Q3: 2008 |
Q4: 2008 |
Q4: 2007 |
Q1: 2008 |
Q2: 2008 |
Q3: 2008 |
Q4: 2008 |
Total |
402,297 |
390,857 |
393,832 |
396,717 |
393,263 |
190,137 |
187,008 |
198,767 |
202,914 |
197,074 |
of Which: |
(100.0) |
(100.0) |
(100.0) |
(100.0) |
(100.0) |
(100.0) |
(100.0) |
(100.0) |
(100.0) |
(100.0) |
Bahrain |
7,476 |
7,451 |
8,027 |
8,423 |
8,059 |
5,687 |
5,602 |
6,024 |
6,093 |
5,874 |
| |
(1.9) |
(1.9) |
(2.0) |
(2.1) |
(2.0) |
(3.0) |
(3.0) |
(3.0) |
(3.0) |
(3.0) |
China |
3,967 |
4,161 |
4,567 |
5,152 |
5,076 |
3,808 |
3,967 |
4,431 |
4,799 |
4,874 |
| |
(1.0) |
(1.1) |
(1.2) |
(1.3) |
(1.3) |
(2.0) |
(2.1) |
(2.2) |
(2.4) |
(2.5) |
France |
4,447 |
5,769 |
6,581 |
7,831 |
6,452 |
2,101 |
3,335 |
3,901 |
5,167 |
4,007 |
| |
(1.1) |
(1.5) |
(1.7) |
(2.0) |
(1.6) |
(1.1) |
(1.8) |
(2.0) |
(2.5) |
(2.0) |
Germany |
13,360 |
14,296 |
15,225 |
15,227 |
15,221 |
9,345 |
9,421 |
10,491 |
10,725 |
10,622 |
(includes ECB) |
(3.3) |
(3.7) |
(3.9) |
(3.8) |
(3.9) |
(4.9) |
(5.0) |
(5.3) |
(5.3) |
(5.4) |
Hong Kong |
9,455 |
9,738 |
10,264 |
12,638 |
14,153 |
4,973 |
5,145 |
5,714 |
6,328 |
7,933 |
| |
(2.4) |
(2.5) |
(2.6) |
(3.2) |
(3.6) |
(2.6) |
(2.8) |
(2.9) |
(3.1) |
(4.0) |
India |
16,386 |
16,929 |
21,583 |
22,282 |
26,711 |
16,386 |
16,929 |
21,583 |
22,282 |
26,711 |
| |
(4.1) |
(4.3) |
(5.5) |
(5.6) |
(6.8) |
(8.6) |
(9.1) |
(10.9) |
(11.0) |
(13.6) |
Kuwait |
7,078 |
6,708 |
6,966 |
6,609 |
6,348 |
1,964 |
1,525 |
1,708 |
1,537 |
1,745 |
| |
(1.8) |
(1.7) |
(1.8) |
(1.7) |
(1.6) |
(1.0) |
(0.8) |
(0.9) |
(0.8) |
(0.9) |
Mauritius |
26,075 |
21,040 |
15,336 |
15,507 |
11,565 |
1,170 |
1,560 |
1,453 |
1,855 |
1,745 |
| |
(6.5) |
(5.4) |
(3.9) |
(3.9) |
(2.9) |
(0.6) |
(0.8) |
(0.7) |
(0.9) |
(0.9) |
Netherlands |
8,175 |
11,641 |
12,250 |
11,315 |
9,989 |
4,544 |
6,330 |
7,196 |
6,440 |
4,925 |
| |
(2.0) |
(3.0) |
(3.1) |
(2.9) |
(2.5) |
(2.4) |
(3.4) |
(3.6) |
(3.2) |
(2.5) |
No Specific |
|
|
|
|
|
|
|
|
|
|
Country (Country |
23,268 |
24,881 |
23,846 |
23,764 |
15,329 |
2,328 |
2,243 |
2,413 |
1,893 |
1,629 |
unknown) |
(5.8) |
(6.4) |
(6.1) |
(6.0) |
(3.9) |
(1.2) |
(1.2) |
(1.2) |
(0.9) |
(0.8) |
Saudi Arabia |
9,902 |
9,481 |
9,640 |
9,668 |
11,930 |
1,513 |
1,550 |
1,626 |
1,676 |
1,660 |
| |
(2.5) |
(2.4) |
(2.4) |
(2.4) |
(3.0) |
(0.8) |
(0.8) |
(0.8) |
(0.8) |
(0.8) |
Singapore |
20,613 |
18,911 |
18,815 |
19,032 |
19,789 |
13,415 |
12,721 |
12,871 |
13,536 |
13,865 |
| |
(5.1) |
(4.8) |
(4.8) |
(4.8) |
(5.0) |
(7.1) |
(6.8) |
(6.5) |
(6.7) |
(7.0) |
United Arab |
27,497 |
24,664 |
27,374 |
26,229 |
31,018 |
7,033 |
4,270 |
4,485 |
5,238 |
5,503 |
Emirates |
(6.8) |
(6.3) |
(7.0) |
(6.6) |
(7.9) |
(3.7) |
(2.3) |
(2.3) |
(2.6) |
(2.8) |
United |
54,350 |
56,417 |
64,851 |
67,195 |
57,665 |
32,039 |
38,287 |
44,827 |
46,593 |
36,350 |
Kingdom@ |
(13.5) |
(14.4) |
(16.5) |
(16.9) |
(14.7) |
(16.9) |
(20.5) |
(22.6) |
(23.0) |
(18.4) |
United States |
|
|
|
|
|
|
|
|
|
|
(Incl. Midway Is., |
117,783 |
107,453 |
97,205 |
94,012 |
102,571 |
64,344 |
53,595 |
48,913 |
46,998 |
48,174 |
Wake Islands)# |
(29.3) |
(27.5) |
(24.7) |
(23.7) |
(26.1) |
(33.8) |
(28.7) |
(24.6) |
(23.2) |
(24.4) |
Statement III: International Liabilities/Assets of Banks Classified According to Country of Residence of Transacting Units (Based on LBS Statements) - Amount outstanding as at end (Concld.) |
(Rs. crore) |
Country |
International Assets |
All Currencies |
Foreign Currencies |
Q4: 2007 |
Q1: 2008 |
Q2: 2008 |
Q3: 2008 |
Q4: 2008 |
Q4: 2007 |
Q1: 2008 |
Q2: 2008 |
Q3: 2008 |
Q4: 2008 |
Total |
209,937 |
222,711 |
208,516 |
221,246 |
226,530 |
202,469 |
215,356 |
200,975 |
212,352 |
217,958 |
of Which: |
(100.0) |
(100.0) |
(100.0) |
(100.0) |
(100.0) |
(100.0) |
(100.0) |
(100.0) |
(100.0) |
(100.0) |
Belgium |
1,729 |
1,765 |
1,798 |
1,705 |
1,871 |
1,723 |
1,759 |
1,788 |
1,684 |
1,864 |
| |
(0.8) |
(0.8) |
(0.9) |
(0.8) |
(0.8) |
(0.9) |
(0.8) |
(0.9) |
(0.8) |
(0.9) |
Canada |
1,451 |
1,825 |
1,429 |
1,481 |
1,432 |
1,310 |
1,585 |
1,267 |
1,312 |
1,256 |
| |
(0.7) |
(0.8) |
(0.7) |
(0.7) |
(0.6) |
(0.6) |
(0.7) |
(0.6) |
(0.6) |
(0.6) |
China |
1,398 |
1,347 |
1,464 |
1,410 |
1,444 |
1,387 |
1,333 |
1,445 |
1,396 |
1,433 |
| |
(0.7) |
(0.6) |
(0.7) |
(0.6) |
(0.6) |
(0.7) |
(0.6) |
(0.7) |
(0.7) |
(0.7) |
France |
1,253 |
1,548 |
1,190 |
1,662 |
1,640 |
1,234 |
1,530 |
1,166 |
1,531 |
1,627 |
| |
(0.6) |
(0.7) |
(0.6) |
(0.8) |
(0.7) |
(0.6) |
(0.7) |
(0.6) |
(0.7) |
(0.7) |
Germany |
3,424 |
4,160 |
3,261 |
5,157 |
4,517 |
3,340 |
4,074 |
3,170 |
5,024 |
4,442 |
(includes ECB) |
(1.6) |
(1.9) |
(1.6) |
(2.3) |
(2.0) |
(1.6) |
(1.9) |
(1.6) |
(2.4) |
(2.0) |
Hong Kong |
7,444 |
6,784 |
7,305 |
7,057 |
14,915 |
7,360 |
6,720 |
7,228 |
6,971 |
14,841 |
| |
(3.5) |
(3.0) |
(3.5) |
(3.2) |
(6.6) |
(3.6) |
(3.1) |
(3.6) |
(3.3) |
(6.8) |
India |
100,572 |
108,614 |
106,894 |
116,711 |
106,062 |
100,572 |
108,614 |
106,894 |
116,711 |
106,062 |
| |
(47.9) |
(48.8) |
(51.3) |
(52.8) |
(46.8) |
(49.7) |
(50.4) |
(53.2) |
(55.0) |
(48.7) |
Italy |
1,459 |
1,577 |
1,426 |
1,355 |
1,234 |
1,449 |
1,568 |
1,412 |
1,339 |
1,224 |
| |
(0.7) |
(0.7) |
(0.7) |
(0.6) |
(0.5) |
(0.7) |
(0.7) |
(0.7) |
(0.6) |
(0.6) |
Japan |
1,675 |
1,837 |
1,634 |
1,773 |
1,862 |
1,641 |
1,805 |
1,599 |
1,744 |
1,834 |
| |
(0.8) |
(0.8) |
(0.8) |
(0.8) |
(0.8) |
(0.8) |
(0.8) |
(0.8) |
(0.8) |
(0.8) |
No Specific |
1,859 |
1,814 |
1,648 |
1,333 |
1,127 |
921 |
949 |
863 |
616 |
433 |
Country |
(0.9) |
(0.8) |
(0.8) |
(0.6) |
(0.5) |
(0.5) |
(0.4) |
(0.4) |
(0.3) |
(0.2) |
Singapore |
6,055 |
5,689 |
4,785 |
4,647 |
4,179 |
5,791 |
5,421 |
4,469 |
4,221 |
3,861 |
| |
(2.9) |
(2.6) |
(2.3) |
(2.1) |
(1.8) |
(2.9) |
(2.5) |
(2.2) |
(2.0) |
(1.8) |
United Arab |
6,898 |
6,458 |
5,733 |
5,306 |
5,024 |
6,096 |
5,641 |
4,918 |
4,246 |
4,219 |
Emirates |
(3.3) |
(2.9) |
(2.7) |
(2.4) |
(2.2) |
(3.0) |
(2.6) |
(2.4) |
(2.0) |
(1.9) |
United |
10,632 |
12,399 |
10,988 |
8,693 |
11,190 |
10,076 |
11,854 |
10,295 |
8,027 |
10,536 |
Kingdom@ |
(5.1) |
(5.6) |
(5.3) |
(3.9) |
(4.9) |
(5.0) |
(5.5) |
(5.1) |
(3.8) |
(4.8) |
United States |
|
|
|
|
|
|
|
|
|
|
(Incl. Midway Is., |
45,635 |
46,615 |
41,412 |
45,689 |
52,053 |
42,149 |
43,267 |
37,984 |
41,469 |
48,521 |
Wake Islands)# |
(21.7) |
(20.9) |
(19.9) |
(20.7) |
(23.0) |
(20.8) |
(20.1) |
(18.9) |
(19.5) |
(22.3) |
@ : excluding Guernsey, Isle of Man and Jersey. #: includes Miday Island and Wake Islands.
‘-’ : nil/negligible.
Note: 1. Figures in brackets represent percentages to total in the respective group (column).
2. Totals may not tally due to rounding off .
3. “No Specific Country” means the country information has not been provided by the reporting bank branches.
4. Data have been revised for previous quarters.
5. Q1, Q2, Q3 and Q4 denote quarters ended March, June, September and December, respectively. |
Statement IV: Country - wise Breakup of Major Component of International Liabilities of Banks
(Based on LBS Statements) |
(Rs. crore) |
Country |
Major Components |
Q4: 2007 |
Q1: 2008 |
Q2: 2008 |
Q3: 2008 |
Q4: 2008 |
Bahrain |
FCNR(B) |
4644 |
(7.6) |
4742 |
(7.9) |
5194 |
(8.3) |
5526 |
(8.5) |
5579 |
(8.5) |
| |
Borrowings |
1034 |
(1.6) |
853 |
(1.1) |
820 |
(0.9) |
556 |
(0.6) |
220 |
(0.2) |
| |
NRE Deposits |
1651 |
(1.5) |
1663 |
(1.5) |
1830 |
(1.6) |
2116 |
(1.8) |
1721 |
(1.4) |
| |
Total |
7476 |
(1.9) |
7451 |
(1.9) |
8027 |
(2.0) |
8423 |
(2.1) |
8059 |
(2.0) |
Belgium |
FCNR(B) |
77 |
(0.1) |
90 |
(0.1) |
86 |
(0.1) |
67 |
(0.1) |
89 |
(0.1) |
| |
Borrowings |
457 |
(0.7) |
1872 |
(2.4) |
1795 |
(2.0) |
1831 |
(1.9) |
3036 |
(3.4) |
| |
NRE Deposits |
99 |
(0.1) |
105 |
(0.1) |
117 |
(0.1) |
100 |
(0.1) |
168 |
(0.1) |
| |
Total |
925 |
(0.2) |
2346 |
(0.6) |
2264 |
(0.6) |
2271 |
(0.6) |
3588 |
(0.9) |
Canada |
FCNR(B) |
972 |
(1.6) |
1019 |
(1.7) |
1039 |
(1.7) |
1025 |
(1.6) |
974 |
(1.5) |
| |
Borrowings |
251 |
(0.4) |
586 |
(0.8) |
557 |
(0.6) |
471 |
(0.5) |
441 |
(0.5) |
| |
NRE Deposits |
1607 |
(1.5) |
1546 |
(1.4) |
1600 |
(1.4) |
1724 |
(1.5) |
1171 |
(1.0) |
| |
Total |
4267 |
(1.1) |
4416 |
(1.1) |
4440 |
(1.1) |
4523 |
(1.1) |
4079 |
(1.0) |
China |
FCNR(B) |
3806 |
(6.2) |
3966 |
(6.6) |
4429 |
(7.1) |
4766 |
(7.3) |
4874 |
(7.5) |
| |
Borrowings |
- |
|
- |
|
- |
|
- |
|
- |
|
| |
NRE Deposits |
110 |
(0.1) |
141 |
(0.1) |
109 |
(0.1) |
221 |
(0.2) |
113 |
(0.1) |
| |
Total |
3967 |
(1.0) |
4161 |
(1.1) |
4567 |
(1.2) |
5152 |
(1.3) |
5076 |
(1.3) |
France |
FCNR(B) |
144 |
(0.2) |
170 |
(0.3) |
137 |
(0.2) |
168 |
(0.3) |
203 |
(0.3) |
| |
Borrowings |
978 |
(1.6) |
2601 |
(3.4) |
3263 |
(3.6) |
4354 |
(4.6) |
3340 |
(3.8) |
| |
NRE Deposits |
415 |
(0.4) |
490 |
(0.4) |
444 |
(0.4) |
431 |
(0.4) |
344 |
(0.3) |
| |
Total |
4447 |
(1.1) |
5769 |
(1.5) |
6581 |
(1.7) |
7831 |
(2.0) |
6452 |
(1.6) |
Germany |
FCNR(B) |
4947 |
(8.1) |
5509 |
(9.1) |
6652 |
(10.6) |
6741 |
(10.4) |
7000 |
(10.7) |
(includes ECB) |
Borrowings |
3919 |
(6.2) |
3526 |
(4.6) |
3502 |
(3.9) |
3605 |
(3.8) |
3283 |
(3.7) |
| |
NRE Deposits |
721 |
(0.7) |
1019 |
(0.9) |
1055 |
(0.9) |
949 |
(0.8) |
1055 |
(0.9) |
| |
Total |
13360 |
(3.3) |
14296 |
(3.7) |
15225 |
(3.9) |
15227 |
(3.8) |
15221 |
(3.9) |
Hong Kong |
FCNR(B) |
779 |
(1.3) |
954 |
(1.6) |
966 |
(1.5) |
807 |
(1.2) |
904 |
(1.4) |
| |
Borrowings |
981 |
(1.6) |
1355 |
(1.8) |
1832 |
(2.0) |
2320 |
(2.5) |
3817 |
(4.3) |
| |
NRE Deposits |
966 |
(0.9) |
1037 |
(0.9) |
901 |
(0.8) |
1187 |
(1.0) |
1203 |
(1.0) |
| |
Total |
9455 |
(2.4) |
9738 |
(2.5) |
10264 |
(2.6) |
12638 |
(3.2) |
14153 |
(3.6) |
India |
FCNR(B) |
- |
|
- |
|
- |
|
- |
|
- |
|
| |
Borrowings |
4216 |
(6.7) |
4908 |
(6.4) |
8594 |
(9.5) |
8773 |
(9.3) |
8944 |
(10.1) |
| |
NRE Deposits |
- |
|
- |
|
- |
|
- |
|
- |
|
| |
Total |
16386 |
(4.1) |
16929 |
(4.3) |
21583 |
(5.5) |
22282 |
(5.6) |
26711 |
(6.8) |
Japan |
FCNR(B) |
370 |
(0.6) |
288 |
(0.5) |
175 |
(0.3) |
172 |
(0.3) |
370 |
(0.6) |
| |
Borrowings |
1949 |
(3.1) |
1385 |
(1.8) |
1783 |
(2.0) |
1412 |
(1.5) |
1521 |
(1.7) |
| |
NRE Deposits |
788 |
(0.7) |
699 |
(0.6) |
758 |
(0.7) |
570 |
(0.5) |
587 |
(0.5) |
| |
Total |
5945 |
(1.5) |
4784 |
(1.2) |
5518 |
(1.4) |
4357 |
(1.1) |
4481 |
(1.1) |
Kenya |
FCNR(B) |
809 |
(1.3) |
958 |
(1.6) |
923 |
(1.5) |
1101 |
(1.7) |
916 |
(1.4) |
| |
Borrowings |
19 |
(0.0) |
37 |
(0.0) |
178 |
(0.2) |
71 |
(0.1) |
43 |
(0.0) |
| |
NRE Deposits |
1180 |
(1.1) |
1217 |
(1.1) |
1027 |
(0.9) |
1079 |
(0.9) |
950 |
(0.8) |
| |
Total |
2043 |
(0.5) |
2257 |
(0.6) |
2187 |
(0.6) |
2317 |
(0.6) |
1999 |
(0.5) |
Kuwait |
FCNR(B) |
1943 |
(3.2) |
1504 |
(2.5) |
1664 |
(2.7) |
1508 |
(2.3) |
1692 |
(2.6) |
| |
Borrowings |
3 |
(0.0) |
2 |
(0.0) |
21 |
(0.0) |
4 |
(0.0) |
2 |
(0.0) |
| |
NRE Deposits |
4800 |
(4.4) |
4808 |
(4.3) |
4943 |
(4.3) |
4709 |
(4.0) |
4101 |
(3.4) |
| |
Total |
7078 |
(1.8) |
6708 |
(1.7) |
6966 |
(1.8) |
6609 |
(1.7) |
6348 |
(1.6) |
Mauritius |
FCNR(B) |
27 |
(0.0) |
34 |
(0.1) |
15 |
(0.0) |
17 |
(0.0) |
15 |
(0.0) |
| |
Borrowings |
1090 |
(1.7) |
1498 |
(1.9) |
1435 |
(1.6) |
1711 |
(1.8) |
1624 |
(1.8) |
| |
NRE Deposits |
48 |
(0.0) |
174 |
(0.2) |
35 |
(0.0) |
32 |
(0.0) |
31 |
(0.0) |
| |
Total |
26075 |
(6.5) |
21040 |
(5.4) |
15336 |
(3.9) |
15507 |
(3.9) |
11565 |
(2.9) |
Netherlands |
FCNR(B) |
128 |
(0.2) |
286 |
(0.5) |
258 |
(0.4) |
243 |
(0.4) |
175 |
(0.3) |
| |
Borrowings |
4308 |
(6.9) |
5885 |
(7.6) |
6778 |
(7.5) |
5950 |
(6.3) |
4496 |
(5.1) |
| |
NRE Deposits |
290 |
(0.3) |
367 |
(0.3) |
163 |
(0.1) |
204 |
(0.2) |
164 |
(0.1) |
| |
Total |
8175 |
(2.0) |
11641 |
(3.0) |
12250 |
(3.1) |
11315 |
(2.9) |
9989 |
(2.5) |
Statement IV: Country - wise Breakup of Major Component of International Liabilities of Banks
(Based on LBS Statements) (Concld.) |
(Rs. crore) |
Country |
Major Components |
Q4: 2007 |
Q1: 2008 |
Q2: 2008 |
Q3: 2008 |
Q4: 2008 |
No Specific |
FCNR(B) |
1964 |
(3.2) |
1613 |
(2.7) |
1744 |
(2.8) |
1312 |
(2.0) |
1291 |
(2.0) |
Country |
Borrowings |
271 |
(0.4) |
42 |
(0.1) |
52 |
(0.1) |
- |
(-) |
- |
(-) |
(country Unknown) |
NRE Deposits |
11201 |
(10.2) |
12209 |
(11.0) |
12984 |
(11.4) |
12215 |
(10.5) |
5519 |
(4.6) |
| |
Total |
23268 |
(5.8) |
24881 |
(6.4) |
23846 |
(6.1) |
23764 |
(6.0) |
15329 |
(3.9) |
Oman |
FCNR(B) |
1038 |
(1.7) |
614 |
(1.0) |
675 |
(1.1) |
608 |
(0.9) |
638 |
(1.0) |
| |
Borrowings |
49 |
(0.1) |
133 |
(0.2) |
72 |
(0.1) |
31 |
(0.0) |
15 |
(0.0) |
| |
NRE Deposits |
2821 |
(2.6) |
2736 |
(2.5) |
2899 |
(2.5) |
2998 |
(2.6) |
3999 |
(3.4) |
| |
Total |
4094 |
(1.0) |
3747 |
(1.0) |
3866 |
(1.0) |
3946 |
(1.0) |
5059 |
(1.3) |
Qatar |
FCNR(B) |
453 |
(0.7) |
517 |
(0.9) |
481 |
(0.8) |
405 |
(0.6) |
377 |
(0.6) |
| |
Borrowings |
- |
|
1 |
(0.0) |
16 |
(0.0) |
1 |
(0.0) |
- |
|
| |
NRE Deposits |
1944 |
(1.8) |
1954 |
(1.8) |
2143 |
(1.9) |
2568 |
(2.2) |
2267 |
(1.9) |
| |
Total |
2534 |
(0.6) |
2617 |
(0.7) |
2841 |
(0.7) |
3208 |
(0.8) |
2979 |
(0.8) |
Saudi Arabia |
FCNR(B) |
1499 |
(2.5) |
1537 |
(2.5) |
1612 |
(2.6) |
1648 |
(2.5) |
1638 |
(2.5) |
| |
Borrowings |
5 |
(0.0) |
4 |
(0.0) |
3 |
(0.0) |
17 |
(0.0) |
3 |
(0.0) |
| |
NRE Deposits |
7965 |
(7.3) |
7474 |
(6.7) |
7653 |
(6.7) |
7621 |
(6.5) |
9555 |
(8.0) |
| |
Total |
9902 |
(2.5) |
9481 |
(2.4) |
9640 |
(2.4) |
9668 |
(2.4) |
11930 |
(3.0) |
Singapore |
FCNR(B) |
643 |
(1.1) |
513 |
(0.9) |
568 |
(0.9) |
620 |
(1.0) |
626 |
(1.0) |
| |
Borrowings |
9708 |
(15.5) |
9754 |
(12.6) |
9312 |
(10.3) |
9942 |
(10.6) |
11821 |
(13.4) |
| |
NRE Deposits |
2328 |
(2.1) |
1967 |
(1.8) |
2626 |
(2.3) |
2330 |
(2.0) |
2199 |
(1.8) |
| |
Total |
20613 |
(5.1) |
18911 |
(4.8) |
18815 |
(4.8) |
19032 |
(4.8) |
19789 |
(5.0) |
Spain |
FCNR(B) |
273 |
(0.4) |
379 |
(0.6) |
458 |
(0.7) |
451 |
(0.7) |
325 |
(0.5) |
(Incl. Balaric Is, |
Borrowings |
8 |
(0.0) |
5 |
(0.0) |
8 |
(0.0) |
13 |
(0.0) |
6 |
(0.0) |
Canary Is and |
NRE Deposits |
160 |
(0.1) |
238 |
(0.2) |
377 |
(0.3) |
788 |
(0.7) |
691 |
(0.6) |
Ceuta & Melilla) |
Total |
3794 |
(0.9) |
2732 |
(0.7) |
2765 |
(0.7) |
2166 |
(0.5) |
1836 |
(0.5) |
United Arab |
FCNR(B) |
6855 |
(11.2) |
4133 |
(6.8) |
4007 |
(6.4) |
4915 |
(7.6) |
5358 |
(8.2) |
Emirates |
Borrowings |
99 |
(0.2) |
63 |
(0.1) |
341 |
(0.4) |
191 |
(0.2) |
2 |
(0.0) |
| |
NRE Deposits |
17407 |
(15.9) |
17896 |
(16.1) |
20532 |
(18.0) |
18402 |
(15.8) |
22007 |
(18.5) |
| |
Total |
27497 |
(6.8) |
24664 |
(6.3) |
27374 |
(7.0) |
26229 |
(6.6) |
31018 |
(7.9) |
United Kingdom@ |
FCNR(B) |
13501 |
(22.1) |
15226 |
(25.2) |
14999 |
(23.9) |
14379 |
(22.2) |
14766 |
(22.6) |
| |
Borrowings |
13299 |
(21.2) |
18453 |
(23.9) |
26972 |
(29.7) |
30151 |
(32.0) |
19663 |
(22.3) |
| |
NRE Deposits |
10247 |
(9.4) |
9010 |
(8.1) |
8283 |
(7.2) |
11076 |
(9.5) |
12920 |
(10.9) |
| |
Total |
54350 |
(13.5) |
56417 |
(14.4) |
64851 |
(16.5) |
67195 |
(16.9) |
57665 |
(14.7) |
United States |
FCNR(B) |
10700 |
(17.5) |
9990 |
(16.6) |
10412 |
(16.6) |
11284 |
(17.4) |
10733 |
(16.4) |
(Incl. Midway Is., |
Borrowings |
16856 |
(26.9) |
21080 |
(27.3) |
20022 |
(22.1) |
18695 |
(19.9) |
21742 |
(24.7) |
Wake Islands) # |
NRE Deposits |
33005 |
(30.2) |
35251 |
(31.7) |
34567 |
(30.2) |
35028 |
(30.1) |
38221 |
(32.1) |
| |
Total |
117783 |
(29.3) |
107453 |
(27.5) |
97205 |
(24.7) |
94012 |
(23.7) |
102571 |
(26.1) |
Total |
FCNR(B) |
61181 |
(100.0) |
60340 |
(100.0) |
62730 |
(100.0) |
64868 |
(100.0) |
65357 |
(100.0) |
| |
Borrowings |
62776 |
(100.0) |
77257 |
(100.0) |
90791 |
(100.0) |
94155 |
(100.0) |
88189 |
(100.0) |
| |
NRE Deposits |
109400 |
(100.0) |
111301 |
(100.0) |
114316 |
(100.0) |
116368 |
(100.0) |
118899 |
(100.0) |
| |
Total |
402297 |
(100.0) |
390857 |
(100.0) |
393832 |
(100.0) |
396717 |
(100.0) |
393263 |
(100.0) |
@ : excluding Guernsey, Isle of Man and Jersey. #: includes Miday Island and Wake Islands. ‘-’ : nil/negligible.
Notes: 1. Figures in brackets represent percentages to total.
2. Totals may not tally due to rounding off .
3. Data have been revised for previous quarters.
4. Q1, Q2, Q3 and Q4 denote quarters ended March, June, September and December, respectively. |
Statement V: Country - wise Breakup of Major Component of International Assets of Banks
(Based on LBS Statements) |
(Rs. crore) |
Country |
Major Components |
Q4: 2007 |
Q1: 2008 |
Q2: 2008 |
Q3: 2008 |
Q4: 2008 |
Bahrain |
Export Bill |
62 |
(0.1) |
65 |
(0.1) |
160 |
(0.3) |
80 |
(0.2) |
55 |
(0.1) |
| |
NOSTRO |
465 |
(1.0) |
580 |
(1.3) |
465 |
(1.2) |
397 |
(1.0) |
668 |
(1.1) |
| |
Total |
988 |
(0.5) |
1141 |
(0.5) |
1091 |
(0.5) |
890 |
(0.4) |
1123 |
(0.5) |
Belgium |
Export Bill |
809 |
(1.8) |
936 |
(1.9) |
961 |
(2.1) |
993 |
(2.1) |
1268 |
(2.9) |
| |
NOSTRO |
502 |
(1.1) |
342 |
(0.7) |
536 |
(1.4) |
419 |
(1.1) |
332 |
(0.6) |
| |
Total |
1729 |
(0.8) |
1765 |
(0.8) |
1798 |
(0.9) |
1705 |
(0.8) |
1871 |
(0.8) |
Canada |
Export Bill |
326 |
(0.7) |
378 |
(0.8) |
339 |
(0.7) |
402 |
(0.8) |
382 |
(0.9) |
| |
NOSTRO |
524 |
(1.1) |
755 |
(1.7) |
468 |
(1.3) |
423 |
(1.1) |
537 |
(0.9) |
| |
Total |
1451 |
(0.7) |
1825 |
(0.8) |
1429 |
(0.7) |
1481 |
(0.7) |
1432 |
(0.6) |
China |
Export Bill |
1314 |
(3.0) |
1149 |
(2.3) |
1244 |
(2.7) |
1098 |
(2.3) |
761 |
(1.7) |
| |
NOSTRO |
1 |
(0.0) |
- |
|
- |
|
- |
|
- |
|
| |
Total |
1398 |
(0.7) |
1347 |
(0.6) |
1464 |
(0.7) |
1410 |
(0.6) |
1444 |
(0.6) |
France |
Export Bill |
626 |
(1.4) |
1032 |
(2.1) |
926 |
(2.0) |
1046 |
(2.2) |
1010 |
(2.3) |
| |
NOSTRO |
305 |
(0.7) |
339 |
(0.7) |
95 |
(0.3) |
445 |
(1.2) |
472 |
(0.8) |
| |
Total |
1253 |
(0.6) |
1548 |
(0.7) |
1190 |
(0.6) |
1662 |
(0.8) |
1640 |
(0.7) |
Germany |
Export Bill |
1562 |
(3.6) |
1657 |
(3.4) |
1384 |
(3.0) |
1373 |
(2.9) |
1269 |
(2.9) |
(includes ECB) |
NOSTRO |
1172 |
(2.5) |
1828 |
(4.0) |
1103 |
(3.0) |
2695 |
(7.0) |
2614 |
(4.4) |
| |
Total |
3424 |
(1.6) |
4160 |
(1.9) |
3261 |
(1.6) |
5157 |
(2.3) |
4517 |
(2.0) |
Hong Kong |
Export Bill |
2795 |
(6.4) |
2927 |
(6.0) |
3127 |
(6.8) |
3010 |
(6.3) |
3478 |
(7.9) |
| |
NOSTRO |
3796 |
(8.1) |
2706 |
(5.9) |
3067 |
(8.2) |
2872 |
(7.4) |
10262 |
(17.4) |
| |
Total |
7444 |
(3.5) |
6784 |
(3.0) |
7305 |
(3.5) |
7057 |
(3.2) |
14915 |
(6.6) |
India |
Export Bill |
- |
|
- |
|
- |
|
- |
|
- |
|
| |
NOSTRO |
- |
|
- |
|
- |
|
- |
|
- |
|
| |
Total |
100572 |
(47.9) |
108614 |
(48.8) |
106894 |
(51.3) |
116711 |
(52.8) |
106062 |
(46.8) |
Italy |
Export Bill |
1304 |
(3.0) |
1464 |
(3.0) |
1294 |
(2.8) |
1248 |
(2.6) |
1128 |
(2.6) |
| |
NOSTRO |
109 |
(0.2) |
103 |
(0.2) |
85 |
(0.2) |
64 |
(0.2) |
68 |
(0.1) |
| |
Total |
1459 |
(0.7) |
1577 |
(0.7) |
1426 |
(0.7) |
1355 |
(0.6) |
1234 |
(0.5) |
Japan |
Export Bill |
458 |
(1.0) |
516 |
(1.1) |
395 |
(0.9) |
310 |
(0.6) |
443 |
(1.0) |
| |
NOSTRO |
792 |
(1.7) |
841 |
(1.8) |
871 |
(2.3) |
1061 |
(2.8) |
1087 |
(1.8) |
| |
Total |
1675 |
(0.8) |
1837 |
(0.8) |
1634 |
(0.8) |
1773 |
(0.8) |
1862 |
(0.8) |
Netherlands |
Export Bill |
452 |
(1.0) |
625 |
(1.3) |
651 |
(1.4) |
694 |
(1.4) |
581 |
(1.3) |
| |
NOSTRO |
611 |
(1.3) |
235 |
(0.5) |
62 |
(0.2) |
98 |
(0.3) |
52 |
(0.1) |
| |
Total |
1071 |
(0.5) |
867 |
(0.4) |
728 |
(0.3) |
806 |
(0.4) |
651 |
(0.3) |
Statement V: Country - wise Breakup of Major Component of International Assets of Banks (Based on LBS Statements) (Concld.) |
(Rs. crore) |
Country |
Major Components |
Q4: 2007 |
Q1: 2008 |
Q2: 2008 |
Q3: 2008 |
Q4: 2008 |
No Specific |
Export Bill |
302 |
(0.7) |
383 |
(0.8) |
667 |
(1.5) |
511 |
(1.1) |
330 |
(0.7) |
Country(country |
NOSTRO |
265 |
(0.6) |
167 |
(0.4) |
107 |
(0.3) |
0 |
(0.0) |
0 |
(0.0) |
Unknown) |
Total |
1859 |
(0.9) |
1814 |
(0.8) |
1648 |
(0.8) |
1333 |
(0.6) |
1127 |
(0.5) |
Singapore |
Export Bill |
1429 |
(3.3) |
1431 |
(2.9) |
1243 |
(2.7) |
1401 |
(2.9) |
1118 |
(2.5) |
| |
NOSTRO |
3142 |
(6.7) |
2746 |
(6.0) |
2052 |
(5.5) |
1796 |
(4.7) |
1672 |
(2.8) |
| |
Total |
6055 |
(2.9) |
5689 |
(2.6) |
4785 |
(2.3) |
4647 |
(2.1) |
4179 |
(1.8) |
Sri Lanka |
Export Bill |
629 |
(1.4) |
604 |
(1.2) |
521 |
(1.1) |
584 |
(1.2) |
348 |
(0.8) |
| |
NOSTRO |
364 |
(0.8) |
190 |
(0.4) |
59 |
(0.2) |
46 |
(0.1) |
76 |
(0.1) |
| |
Total |
1309 |
(0.6) |
1124 |
(0.5) |
990 |
(0.5) |
1047 |
(0.5) |
885 |
(0.4) |
Switzerland |
Export Bill |
433 |
(1.0) |
421 |
(0.9) |
327 |
(0.7) |
374 |
(0.8) |
349 |
(0.8) |
(Includes Bis) |
NOSTRO |
742 |
(1.6) |
648 |
(1.4) |
439 |
(1.2) |
317 |
(0.8) |
563 |
(1.0) |
| |
Total |
1216 |
(0.6) |
1102 |
(0.5) |
796 |
(0.4) |
720 |
(0.3) |
939 |
(0.4) |
United Arab Emirates |
Export Bill |
3965 |
(9.0) |
4535 |
(9.3) |
4057 |
(8.8) |
3667 |
(7.7) |
3412 |
(7.7) |
| |
NOSTRO |
1368 |
(2.9) |
262 |
(0.6) |
64 |
(0.2) |
83 |
(0.2) |
109 |
(0.2) |
| |
Total |
6898 |
(3.3) |
6458 |
(2.9) |
5733 |
(2.7) |
5306 |
(2.4) |
5024 |
(2.2) |
United Kingdom@ |
Export Bill |
3082 |
(7.0) |
2900 |
(5.9) |
3158 |
(6.9) |
2434 |
(5.1) |
2002 |
(4.5) |
| |
NOSTRO |
4749 |
(10.1) |
7105 |
(15.5) |
5472 |
(14.7) |
4049 |
(10.5) |
6938 |
(11.7) |
| |
Total |
10632 |
(5.1) |
12399 |
(5.6) |
10988 |
(5.3) |
8693 |
(3.9) |
11190 |
(4.9) |
United States |
Export Bill |
15563 |
(35.5) |
17459 |
(35.6) |
16289 |
(35.4) |
19618 |
(41.0) |
16637 |
(37.8) |
(Incl. Midway is., |
NOSTRO |
25552 |
(54.5) |
24788 |
(54.2) |
20673 |
(55.5) |
22244 |
(57.7) |
31691 |
(53.6) |
Wake Islands)# |
Total |
45635 |
(21.7) |
46615 |
(20.9) |
41412 |
(19.9) |
45689 |
(20.7) |
52053 |
(23.0) |
Total |
Export Bill |
43899 |
(100.0) |
49011 |
(100.0) |
45951 |
(100.0) |
47872 |
(100.0) |
44041 |
(100.0) |
| |
NOSTRO |
46863 |
(100.0) |
45752 |
(100.0) |
37252 |
(100.0) |
38581 |
(100.0) |
59140 |
(100.0) |
| |
Total |
209937 |
(100.0) |
222711 |
(100.0) |
208516 |
(100.0) |
221246 |
(100.0) |
226530 |
(100.0) |
@ : excluding Guernsey, Isle of Man and Jersey #: includes Miday Island and Wake Islands Notes:
1. Figures in brackets represent percentages to total.
2. Totals may not tally due to rounding off .
3. Data have been revised for previous quarters.
4. Q1, Q2, Q3 and Q4 denote quarters ended March, June, September and December, respectively. |
Statement VI: International Liabilities/Assets of Banks Classified According to Country of Incorporation of Banks (Based on LBS Statements) - Amount Outstanding as at end |
(Rs. crore) |
Country |
International Liabilities |
Total: All Sectors |
Position vis-a-vis Banks |
Q4: 2007 |
Q1: 2008 |
Q2: 2008 |
Q3: 2008 |
Q4: 2008 |
Q4: 2007 |
Q1: 2008 |
Q2: 2008 |
Q3: 2008 |
Q4: 2008 |
Bahrain |
222 |
257 |
215 |
322 |
301 |
19 |
19 |
19 |
68 |
59 |
| |
(0.1) |
(0.1) |
(0.1) |
(0.1) |
(0.1) |
(0.0) |
(0.0) |
(0.0) |
(0.1) |
(0.0) |
Bangladesh |
53 |
58 |
60 |
64 |
52 |
52 |
54 |
57 |
62 |
49 |
| |
(0.0) |
(0.0) |
(0.0) |
(0.0) |
(0.0) |
(0.1) |
(0.1) |
(0.0) |
(0.0) |
(0.0) |
Belgium |
591 |
687 |
693 |
993 |
1,023 |
555 |
651 |
651 |
948 |
968 |
| |
(0.1) |
(0.2) |
(0.2) |
(0.3) |
(0.3) |
(0.6) |
(0.6) |
(0.5) |
(0.8) |
(0.8) |
Canada |
2,195 |
2,591 |
3,151 |
3,535 |
3,835 |
2,101 |
2,488 |
2,991 |
3,427 |
3,609 |
| |
(0.5) |
(0.7) |
(0.8) |
(0.9) |
(1.0) |
(2.4) |
(2.4) |
(2.5) |
(2.7) |
(3.0) |
France |
3,779 |
4,330 |
4,642 |
5,546 |
4,821 |
2,672 |
3,242 |
3,647 |
4,437 |
3,831 |
| |
(0.9) |
(1.1) |
(1.2) |
(1.4) |
(1.2) |
(3.0) |
(3.1) |
(3.0) |
(3.5) |
(3.2) |
Germany |
8,823 |
11,100 |
8,751 |
8,492 |
9,461 |
3,182 |
3,816 |
3,764 |
3,637 |
3,541 |
(includes ECB) |
(2.2) |
(2.8) |
(2.2) |
(2.1) |
(2.4) |
(3.6) |
(3.6) |
(3.1) |
(2.9) |
(2.9) |
Hong Kong |
23,785 |
25,257 |
23,817 |
28,620 |
26,822 |
6,057 |
8,917 |
8,421 |
11,734 |
10,920 |
| |
(5.9) |
(6.5) |
(6.0) |
(7.2) |
(6.8) |
(6.8) |
(8.4) |
(6.9) |
(9.3) |
(9.1) |
India |
321,229 |
299,095 |
293,028 |
286,876 |
281,267 |
50,989 |
57,755 |
62,638 |
61,065 |
57,534 |
| |
(79.8) |
(76.5) |
(74.4) |
(72.3) |
(71.5) |
(57.4) |
(54.7) |
(51.4) |
(48.5) |
(47.7) |
Japan |
1,189 |
1,212 |
1,809 |
1,399 |
1,368 |
1,128 |
1,144 |
1,719 |
1,324 |
1,311 |
| |
(0.3) |
(0.3) |
(0.5) |
(0.4) |
(0.3) |
(1.3) |
(1.1) |
(1.4) |
(1.1) |
(1.1) |
Mauritius |
142 |
129 |
120 |
110 |
83 |
110 |
106 |
94 |
83 |
71 |
| |
(0.0) |
(0.0) |
(0.0) |
(0.0) |
(0.0) |
(0.1) |
(0.1) |
(0.1) |
(0.1) |
(0.1) |
Netherlands |
9,760 |
11,573 |
12,582 |
11,286 |
10,691 |
8,534 |
10,295 |
11,263 |
10,008 |
8,499 |
| |
(2.4) |
(3.0) |
(3.2) |
(2.8) |
(2.7) |
(9.6) |
(9.8) |
(9.2) |
(7.9) |
(7.0) |
Oman |
260 |
219 |
407 |
206 |
201 |
35 |
48 |
55 |
33 |
20 |
| |
(0.1) |
(0.1) |
(0.1) |
(0.1) |
(0.1) |
(0.0) |
(0.0) |
(0.0) |
(0.0) |
(0.0) |
Singapore |
1,850 |
2,404 |
3,064 |
3,870 |
3,989 |
1,838 |
2,386 |
3,051 |
3,857 |
3,976 |
| |
(0.5) |
(0.6) |
(0.8) |
(1.0) |
(1.0) |
(2.1) |
(2.3) |
(2.5) |
(3.1) |
(3.3) |
South Korea |
161 |
202 |
296 |
213 |
202 |
159 |
199 |
258 |
206 |
195 |
| |
(0.0) |
(0.1) |
(0.1) |
(0.1) |
(0.1) |
(0.2) |
(0.2) |
(0.2) |
(0.2) |
(0.2) |
Sri Lanka |
77 |
83 |
81 |
90 |
101 |
50 |
49 |
47 |
52 |
46 |
| |
(0.0) |
(0.0) |
(0.0) |
(0.0) |
(0.0) |
(0.1) |
(0.0) |
(0.0) |
(0.0) |
(0.0) |
Taiwan, China |
204 |
123 |
84 |
110 |
110 |
204 |
123 |
79 |
110 |
110 |
| |
(0.1) |
(0.0) |
(0.0) |
(0.0) |
(0.0) |
(0.2) |
(0.1) |
(0.1) |
(0.1) |
(0.1) |
Thailand |
111 |
115 |
119 |
127 |
139 |
36 |
36 |
36 |
36 |
36 |
| |
(0.0) |
(0.0) |
(0.0) |
(0.0) |
(0.0) |
(0.0) |
(0.0) |
(0.0) |
(0.0) |
(0.0) |
United Arab |
443 |
412 |
413 |
416 |
412 |
105 |
108 |
91 |
86 |
88 |
Emirates |
(0.1) |
(0.1) |
(0.1) |
(0.1) |
(0.1) |
(0.1) |
(0.1) |
(0.1) |
(0.1) |
(0.1) |
United Kingdom |
10,068 |
11,923 |
17,388 |
20,290 |
20,986 |
4,963 |
6,361 |
10,808 |
12,724 |
12,050 |
| |
(2.5) |
(3.1) |
(4.4) |
(5.1) |
(5.3) |
(5.6) |
(6.0) |
(8.9) |
(10.1) |
(10.0) |
United States |
|
|
|
|
|
|
|
|
|
|
(Incl. Midway is., |
17,281 |
19,015 |
23,113 |
24,078 |
27,327 |
5,928 |
7,684 |
12,150 |
11,931 |
13,667 |
Wake Islands) |
(4.3) |
(4.9) |
(5.9) |
(6.1) |
(6.9) |
(6.7) |
(7.3) |
(10.0) |
(9.5) |
(11.3) |
Total |
402,297 |
390,857 |
393,832 |
396,717 |
393,263 |
88,790 |
105,554 |
121,839 |
125,901 |
120,653 |
| |
(100.0) |
(100.0) |
(100.0) |
(100.0) |
(100.0) |
(100.0) |
(100.0) |
(100.0) |
(100.0) |
(100.0) |
Statement VI: International Liabilities/Assets of Banks Classified According to Country of Incorporation of Banks (Based on LBS Statements) - Amount Outstanding as at end |
(Rs. crore) |
Country |
International Assets |
Total: All Sectors |
Position vis-a-vis Banks |
Q4: 2007 |
Q1: 2008 |
Q2: 2008 |
Q3: 2008 |
Q4: 2008 |
Q4: 2007 |
Q1: 2008 |
Q2: 2008 |
Q3: 2008 |
Q4: 2008 |
Bahrain |
158 |
309 |
344 |
230 |
327 |
35 |
28 |
14 |
15 |
23 |
| |
(0.1) |
(0.1) |
(0.2) |
(0.1) |
(0.1) |
(0.1) |
(0.0) |
(0.0) |
(0.0) |
(0.0) |
Bangladesh |
14 |
20 |
12 |
16 |
10 |
9 |
12 |
9 |
12 |
8 |
| |
(0.0) |
(0.0) |
(0.0) |
(0.0) |
(0.0) |
(0.0) |
(0.0) |
(0.0) |
(0.0) |
(0.0) |
Belgium |
418 |
472 |
524 |
763 |
810 |
54 |
59 |
78 |
164 |
186 |
| |
(0.2) |
(0.2) |
(0.3) |
(0.3) |
(0.4) |
(0.1) |
(0.1) |
(0.1) |
(0.3) |
(0.2) |
Canada |
2,155 |
2,640 |
2,492 |
3,154 |
1,391 |
7 |
76 |
14 |
49 |
32 |
| |
(1.0) |
(1.2) |
(1.2) |
(1.4) |
(0.6) |
(0.0) |
(0.1) |
(0.0) |
(0.1) |
(0.0) |
France |
629 |
1,038 |
816 |
1,257 |
948 |
262 |
284 |
97 |
340 |
228 |
| |
(0.3) |
(0.5) |
(0.4) |
(0.6) |
(0.4) |
(0.4) |
(0.4) |
(0.2) |
(0.6) |
(0.3) |
Germany |
1,822 |
2,746 |
2,356 |
1,967 |
1,472 |
701 |
1,060 |
791 |
242 |
332 |
(includes ECB) |
(0.9) |
(1.2) |
(1.1) |
(0.9) |
(0.6) |
(1.0) |
(1.6) |
(1.4) |
(0.4) |
(0.4) |
Hong Kong |
7,386 |
8,408 |
7,354 |
6,590 |
11,196 |
2,804 |
2,522 |
1,162 |
7 |
5,735 |
| |
(3.5) |
(3.8) |
(3.5) |
(3.0) |
(4.9) |
(4.2) |
(3.8) |
(2.0) |
(0.0) |
(6.8) |
India |
166,004 |
166,558 |
150,564 |
157,586 |
160,197 |
54,828 |
52,321 |
43,785 |
47,812 |
60,357 |
| |
(79.1) |
(74.8) |
(72.2) |
(71.2) |
(70.7) |
(81.3) |
(79.0) |
(76.0) |
(79.8) |
(71.7) |
Japan |
390 |
570 |
1,273 |
1,572 |
1,573 |
262 |
202 |
322 |
367 |
358 |
| |
(0.2) |
(0.3) |
(0.6) |
(0.7) |
(0.7) |
(0.4) |
(0.3) |
(0.6) |
(0.6) |
(0.4) |
Mauritius |
12 |
22 |
20 |
15 |
10 |
6 |
2 |
2 |
1 |
1 |
| |
(0.0) |
(0.0) |
(0.0) |
(0.0) |
(0.0) |
(0.0) |
(0.0) |
(0.0) |
(0.0) |
(0.0) |
Netherlands |
8,158 |
8,236 |
7,903 |
8,888 |
6,935 |
426 |
319 |
217 |
111 |
116 |
| |
(3.9) |
(3.7) |
(3.8) |
(4.0) |
(3.1) |
(0.6) |
(0.5) |
(0.4) |
(0.2) |
(0.1) |
Oman |
4 |
2 |
0 |
3 |
29 |
4 |
2 |
0 |
2 |
4 |
| |
(0.0) |
(0.0) |
(0.0) |
(0.0) |
(0.0) |
(0.0) |
(0.0) |
0 |
(0.0) |
(0.0) |
Singapore |
4,041 |
4,367 |
4,807 |
5,698 |
4,893 |
2,533 |
2,661 |
2,940 |
3,497 |
2,974 |
| |
(1.9) |
(2.0) |
(2.3) |
(2.6) |
(2.2) |
(3.8) |
(4.0) |
(5.1) |
(5.8) |
(3.5) |
South Korea |
44 |
52 |
77 |
38 |
68 |
32 |
10 |
42 |
23 |
58 |
| |
(0.0) |
(0.0) |
(0.0) |
(0.0) |
(0.0) |
(0.0) |
(0.0) |
(0.1) |
(0.0) |
(0.1) |
Sri Lanka |
7 |
10 |
10 |
13 |
69 |
3 |
4 |
3 |
7 |
7 |
| |
(0.0) |
(0.0) |
(0.0) |
(0.0) |
(0.0) |
(0.0) |
(0.0) |
(0.0) |
(0.0) |
(0.0) |
Taiwan, China |
17 |
7 |
8 |
5 |
2 |
10 |
1 |
4 |
- |
1 |
| |
(0.0) |
(0.0) |
(0.0) |
(0.0) |
(0.0) |
(0.0) |
(0.0) |
(0.0) |
|
(0.0) |
Thailand |
9 |
11 |
11 |
7 |
11 |
9 |
11 |
9 |
7 |
11 |
| |
(0.0) |
(0.0) |
(0.0) |
(0.0) |
(0.0) |
(0.0) |
(0.0) |
(0.0) |
(0.0) |
(0.0) |
United Arab |
52 |
60 |
89 |
138 |
49 |
20 |
18 |
31 |
42 |
28 |
Emirates |
(0.0) |
(0.0) |
(0.0) |
(0.1) |
(0.0) |
(0.0) |
(0.0) |
(0.1) |
(0.1) |
(0.0) |
United |
7,779 |
12,511 |
16,419 |
21,829 |
21,638 |
2,142 |
3,341 |
4,904 |
6,219 |
7,828 |
Kingdom@ |
(3.7) |
(5.6) |
(7.9) |
(9.9) |
(9.6) |
(3.2) |
(5.0) |
(8.5) |
(10.4) |
(9.3) |
United States |
|
|
|
|
|
|
|
|
|
|
(Incl. Midway is., |
10,835 |
14,671 |
13,438 |
11,477 |
14,904 |
3,301 |
3,319 |
3,181 |
1,033 |
5,862 |
Wake Islands) # |
(5.2) |
(6.6) |
(6.4) |
(5.2) |
(6.6) |
(4.9) |
(5.0) |
(5.5) |
(1.7) |
(7.0) |
Total |
209,937 |
222,711 |
208,516 |
221,246 |
226,530 |
67,447 |
66,252 |
57,607 |
59,952 |
84,152 |
| |
(100.0) |
(100.0) |
(100.0) |
(100.0) |
(100.0) |
(100.0) |
(100.0) |
(100.0) |
(100.0) |
(100.0) |
@ : excluding Guernsey, Isle of Man and Jersey. #: includes Miday Island and Wake Islands. ‘-’ : nil/negligible.
Note: 1. Figures in brackets represent percentages to total in the respective group (column).
2.Totals may not tally due to rounding off.
3. Data have been revised for previous quarters.
4. Q1, Q2, Q3 and Q4 denote quarters ended March, June, September and December, respectively. |
Statement VII: Residual Maturity and Sector - wise Classification of Consolidated International Claims of Banks (Based on CBS Statements) - Amount outstanding as at end of Period on Immediate Country Risk Basis |
(Rs. crore) |
Country of Transacting Units |
Period |
Total International Claims |
Residual Maturity |
Sector |
Short-Term |
Long-Term |
Unallocated |
Bank |
Non-Bank Public |
Non-Bank Private |
Total Intl. Claims |
Dec-2007 |
153353 |
105930 |
45722 |
1701 |
58943 |
767 |
93643 |
| |
Mar-2008 |
169481 |
117279 |
50232 |
1970 |
62394 |
748 |
106339 |
| |
Jun-2008 |
171730 |
113983 |
55549 |
2199 |
65021 |
828 |
105881 |
| |
Sep-2008 |
177560 |
112092 |
62370 |
3098 |
64497 |
1509 |
111554 |
| |
Dec-2008 |
191118 |
116029 |
72088 |
3000 |
75135 |
732 |
115251 |
Australia |
Dec-2007 |
2176 |
1039 |
1137 |
- |
1613 |
2 |
560 |
| |
Mar-2008 |
2042 |
982 |
1060 |
- |
1582 |
1 |
460 |
| |
Jun-2008 |
2081 |
957 |
1124 |
- |
1485 |
2 |
594 |
| |
Sep-2008 |
2251 |
729 |
1506 |
17 |
1593 |
2 |
656 |
| |
Dec-2008 |
1999 |
531 |
1469 |
- |
1470 |
- |
529 |
Austria |
Dec-2007 |
850 |
683 |
167 |
- |
721 |
- |
129 |
| |
Mar-2008 |
1123 |
1043 |
80 |
- |
1041 |
- |
82 |
| |
Jun-2008 |
921 |
794 |
126 |
- |
861 |
- |
60 |
| |
Sep-2008 |
1035 |
827 |
209 |
- |
911 |
- |
124 |
| |
Dec-2008 |
900 |
704 |
197 |
- |
856 |
- |
45 |
Bahamas |
Dec-2007 |
904 |
794 |
110 |
- |
87 |
- |
817 |
| |
Mar-2008 |
898 |
799 |
99 |
- |
- |
- |
898 |
| |
Jun-2008 |
886 |
865 |
20 |
- |
64 |
- |
822 |
| |
Sep-2008 |
832 |
812 |
20 |
- |
127 |
- |
705 |
| |
Dec-2008 |
726 |
717 |
9 |
- |
49 |
- |
677 |
Bahrain |
Dec-2007 |
2388 |
1111 |
1278 |
- |
1919 |
- |
470 |
| |
Mar-2008 |
2094 |
849 |
1245 |
- |
1654 |
- |
440 |
| |
Jun-2008 |
2780 |
1325 |
1455 |
- |
2530 |
- |
250 |
| |
Sep-2008 |
3318 |
1519 |
1799 |
- |
2958 |
- |
360 |
| |
Dec-2008 |
3302 |
1557 |
1745 |
- |
2995 |
- |
307 |
Belgium |
Dec-2007 |
3403 |
3125 |
278 |
- |
673 |
- |
2730 |
| |
Mar-2008 |
3886 |
3675 |
210 |
- |
1286 |
- |
2599 |
| |
Jun-2008 |
3361 |
3331 |
29 |
- |
1060 |
- |
2300 |
| |
Sep-2008 |
3649 |
3180 |
469 |
- |
454 |
- |
3195 |
| |
Dec-2008 |
3433 |
3013 |
419 |
- |
463 |
- |
2970 |
Canada |
Dec-2007 |
2597 |
847 |
1015 |
735 |
1859 |
3 |
735 |
| |
Mar-2008 |
4019 |
1361 |
2172 |
486 |
1741 |
2 |
2276 |
| |
Jun-2008 |
5388 |
2221 |
2565 |
602 |
2547 |
1 |
2840 |
| |
Sep-2008 |
5772 |
1805 |
3220 |
747 |
2586 |
76 |
3110 |
| |
Dec-2008 |
5636 |
1443 |
3205 |
989 |
3124 |
1 |
2511 |
Cayman Islands |
Dec-2007 |
717 |
15 |
701 |
- |
58 |
- |
658 |
| |
Mar-2008 |
773 |
47 |
726 |
- |
47 |
69 |
657 |
| |
Jun-2008 |
1148 |
902 |
246 |
- |
83 |
- |
1066 |
| |
Sep-2008 |
1495 |
1042 |
452 |
- |
92 |
- |
1403 |
| |
Dec-2008 |
1660 |
1083 |
577 |
- |
90 |
- |
1570 |
China |
Dec-2007 |
1355 |
1283 |
73 |
- |
27 |
- |
1328 |
| |
Mar-2008 |
1026 |
962 |
65 |
- |
- |
- |
1026 |
| |
Jun-2008 |
1312 |
1133 |
179 |
- |
- |
- |
1311 |
| |
Sep-2008 |
1390 |
1149 |
241 |
- |
122 |
- |
1268 |
| |
Dec-2008 |
1419 |
1275 |
144 |
- |
- |
- |
1419 |
Cyprus |
Dec-2007 |
2161 |
1676 |
485 |
- |
173 |
- |
1989 |
| |
Mar-2008 |
2864 |
1713 |
1151 |
- |
232 |
- |
2632 |
| |
Jun-2008 |
2444 |
1417 |
1027 |
- |
185 |
- |
2259 |
| |
Sep-2008 |
1862 |
924 |
939 |
- |
298 |
- |
1564 |
| |
Dec-2008 |
2565 |
1038 |
1527 |
- |
1027 |
- |
1539 |
Statement VII: Residual Maturity and Sector - wise Classification of Consolidated International Claims of Banks (Based on CBS Statements) - Amount outstanding as at end of Period on Immediate Country Risk Basis (Contd.) |
(Rs. crore) |
Country of Transacting Units |
Period |
Total International Claims |
Residual Maturity |
Sector |
Short-Term |
Long-Term |
Unallocated |
Bank |
Non-Bank Public |
Non-Bank Private |
Denmark |
Dec-2007 |
1001 |
709 |
292 |
- |
870 |
- |
132 |
| |
Mar-2008 |
1660 |
1347 |
313 |
- |
1430 |
- |
229 |
| |
Jun-2008 |
1516 |
1186 |
330 |
- |
1400 |
- |
116 |
| |
Sep-2008 |
1373 |
1042 |
331 |
- |
1263 |
- |
111 |
| |
Dec-2008 |
1305 |
866 |
439 |
- |
1112 |
- |
193 |
France |
Dec-2007 |
2126 |
1675 |
451 |
- |
1094 |
- |
1032 |
| |
Mar-2008 |
2969 |
2074 |
895 |
- |
1535 |
- |
1434 |
| |
Jun-2008 |
3456 |
2377 |
1079 |
- |
2004 |
- |
1452 |
| |
Sep-2008 |
4519 |
3079 |
1440 |
- |
2451 |
554 |
1514 |
| |
Dec-2008 |
4126 |
2675 |
1451 |
- |
2742 |
- |
1383 |
Germany |
Dec-2007 |
6896 |
5212 |
1645 |
40 |
4905 |
57 |
1934 |
(includes ECB) |
Mar-2008 |
10607 |
8572 |
1600 |
435 |
5266 |
43 |
5299 |
| |
Jun-2008 |
10300 |
8481 |
1492 |
327 |
5157 |
144 |
4998 |
| |
Sep-2008 |
9742 |
7778 |
1888 |
76 |
4348 |
459 |
4935 |
| |
Dec-2008 |
9565 |
7838 |
1727 |
- |
4756 |
80 |
4730 |
Hong Kong |
Dec-2007 |
10487 |
9048 |
1438 |
- |
6334 |
- |
4152 |
| |
Mar-2008 |
9792 |
9092 |
700 |
- |
5444 |
- |
4347 |
| |
Jun-2008 |
9978 |
8614 |
1364 |
- |
5299 |
- |
4679 |
| |
Sep-2008 |
10056 |
8868 |
1188 |
- |
5664 |
- |
4392 |
| |
Dec-2008 |
14779 |
13364 |
1414 |
- |
9605 |
- |
5174 |
Indonesia |
Dec-2007 |
985 |
568 |
417 |
- |
16 |
- |
969 |
| |
Mar-2008 |
1057 |
592 |
465 |
- |
17 |
- |
1039 |
| |
Jun-2008 |
1343 |
899 |
444 |
- |
19 |
- |
1325 |
| |
Sep-2008 |
1258 |
826 |
432 |
- |
50 |
- |
1209 |
| |
Dec-2008 |
1416 |
887 |
529 |
- |
22 |
- |
1393 |
Ireland |
Dec-2007 |
615 |
372 |
243 |
- |
347 |
- |
268 |
| |
Mar-2008 |
814 |
451 |
363 |
- |
294 |
- |
520 |
| |
Jun-2008 |
811 |
405 |
406 |
- |
353 |
- |
457 |
| |
Sep-2008 |
1328 |
644 |
684 |
- |
616 |
- |
713 |
| |
Dec-2008 |
1253 |
491 |
762 |
- |
775 |
- |
478 |
Israel |
Dec-2007 |
496 |
459 |
37 |
- |
20 |
- |
476 |
| |
Mar-2008 |
479 |
478 |
1 |
- |
0 |
- |
479 |
| |
Jun-2008 |
604 |
552 |
52 |
- |
0 |
- |
604 |
| |
Sep-2008 |
522 |
470 |
52 |
- |
- |
- |
522 |
| |
Dec-2008 |
873 |
858 |
15 |
- |
- |
- |
873 |
Italy |
Dec-2007 |
2493 |
1688 |
805 |
- |
1176 |
- |
1317 |
| |
Mar-2008 |
2768 |
1866 |
902 |
- |
1359 |
- |
1409 |
| |
Jun-2008 |
2541 |
1510 |
1031 |
- |
1157 |
- |
1384 |
| |
Sep-2008 |
2351 |
1363 |
988 |
- |
1140 |
- |
1211 |
| |
Dec-2008 |
2240 |
1294 |
946 |
- |
1140 |
- |
1100 |
Japan |
Dec-2007 |
1205 |
1003 |
201 |
- |
693 |
1 |
510 |
| |
Mar-2008 |
1232 |
1107 |
125 |
- |
647 |
41 |
544 |
| |
Jun-2008 |
1675 |
1339 |
336 |
- |
1077 |
3 |
596 |
| |
Sep-2008 |
1900 |
1594 |
305 |
- |
1217 |
2 |
681 |
| |
Dec-2008 |
2139 |
1720 |
419 |
- |
1702 |
- |
437 |
Luxembourg |
Dec-2007 |
555 |
244 |
311 |
- |
131 |
- |
425 |
| |
Mar-2008 |
6111 |
3954 |
2157 |
- |
1919 |
- |
4192 |
| |
Jun-2008 |
5641 |
3706 |
1934 |
1 |
1742 |
- |
3899 |
| |
Sep-2008 |
5451 |
3488 |
1963 |
- |
1564 |
- |
3886 |
| |
Dec-2008 |
4383 |
2891 |
1492 |
- |
1340 |
- |
3043 |
Statement VII: Residual Maturity and Sector - wise Classification of Consolidated International Claims of Banks (Based on CBS Statements) - Amount outstanding as at end of Period on Immediate Country Risk Basis (Contd.) |
(Rs. crore) |
Country of Transacting Units |
Period |
Total International Claims |
Residual Maturity |
Sector |
Short-Term |
Long-Term |
Unallocated |
Bank |
Non-Bank Public |
Non-Bank Private |
Maldives |
Dec-2007 |
48 |
47 |
1 |
- |
- |
- |
48 |
| |
Mar-2008 |
597 |
596 |
1 |
- |
0 |
- |
597 |
| |
Jun-2008 |
675 |
674 |
1 |
- |
0 |
- |
675 |
| |
Sep-2008 |
835 |
834 |
1 |
- |
0 |
- |
835 |
| |
Dec-2008 |
1476 |
1476 |
1 |
- |
0 |
- |
1476 |
Mauritius |
Dec-2007 |
688 |
223 |
465 |
- |
46 |
- |
643 |
| |
Mar-2008 |
740 |
230 |
510 |
- |
82 |
- |
658 |
| |
Jun-2008 |
933 |
294 |
639 |
- |
67 |
- |
866 |
| |
Sep-2008 |
1068 |
377 |
690 |
- |
313 |
- |
754 |
| |
Dec-2008 |
1022 |
192 |
831 |
- |
278 |
- |
745 |
Netherlands |
Dec-2007 |
4312 |
2382 |
1930 |
- |
1559 |
- |
2753 |
| |
Mar-2008 |
5266 |
2261 |
3004 |
- |
1264 |
- |
4002 |
| |
Jun-2008 |
5244 |
2162 |
3082 |
- |
1188 |
- |
4056 |
| |
Sep-2008 |
5409 |
1856 |
3554 |
- |
781 |
33 |
4595 |
| |
Dec-2008 |
5073 |
1518 |
3555 |
- |
989 |
32 |
4053 |
No Specific Country |
Dec-2007 |
2334 |
1414 |
920 |
- |
278 |
- |
2056 |
(Country Unknown) |
Mar-2008 |
2350 |
1386 |
964 |
- |
298 |
- |
2052 |
| |
Jun-2008 |
2121 |
1273 |
848 |
- |
139 |
- |
1982 |
| |
Sep-2008 |
2043 |
1233 |
810 |
- |
140 |
- |
1903 |
| |
Dec-2008 |
1430 |
481 |
949 |
- |
447 |
- |
983 |
Norway |
Dec-2007 |
763 |
68 |
695 |
- |
214 |
- |
548 |
| |
Mar-2008 |
961 |
203 |
758 |
- |
247 |
- |
713 |
| |
Jun-2008 |
882 |
111 |
771 |
- |
193 |
- |
689 |
| |
Sep-2008 |
888 |
55 |
833 |
- |
239 |
- |
649 |
| |
Dec-2008 |
908 |
83 |
825 |
- |
267 |
- |
641 |
Russia |
Dec-2007 |
6001 |
3944 |
1959 |
99 |
3433 |
- |
2568 |
| |
Mar-2008 |
6011 |
3950 |
1962 |
99 |
3353 |
- |
2658 |
| |
Jun-2008 |
5573 |
3569 |
1897 |
106 |
3162 |
- |
2411 |
| |
Sep-2008 |
6460 |
3896 |
2447 |
117 |
3800 |
- |
2660 |
| |
Dec-2008 |
6170 |
3763 |
2285 |
122 |
3428 |
- |
2742 |
Saudi Arabia |
Dec-2007 |
664 |
424 |
240 |
- |
9 |
1 |
654 |
| |
Mar-2008 |
586 |
347 |
239 |
- |
11 |
1 |
574 |
| |
Jun-2008 |
660 |
372 |
288 |
- |
7 |
1 |
652 |
| |
Sep-2008 |
781 |
525 |
256 |
- |
11 |
1 |
769 |
| |
Dec-2008 |
904 |
491 |
414 |
- |
136 |
- |
768 |
Singapore |
Dec-2007 |
11749 |
5872 |
5877 |
- |
4046 |
- |
7703 |
| |
Mar-2008 |
11918 |
6194 |
5724 |
- |
4165 |
- |
7753 |
| |
Jun-2008 |
11714 |
6134 |
5580 |
- |
4210 |
1 |
7503 |
| |
Sep-2008 |
12303 |
6148 |
6156 |
- |
4158 |
- |
8145 |
| |
Dec-2008 |
14454 |
6861 |
7261 |
332 |
4656 |
- |
9799 |
South Africa |
Dec-2007 |
827 |
424 |
403 |
- |
269 |
- |
558 |
| |
Mar-2008 |
789 |
417 |
372 |
- |
259 |
- |
530 |
| |
Jun-2008 |
568 |
273 |
296 |
- |
174 |
- |
394 |
| |
Sep-2008 |
609 |
316 |
293 |
- |
275 |
- |
334 |
| |
Dec-2008 |
779 |
309 |
471 |
- |
283 |
- |
496 |
South Korea |
Dec-2007 |
699 |
279 |
420 |
- |
495 |
- |
204 |
| |
Mar-2008 |
963 |
513 |
450 |
- |
705 |
- |
258 |
| |
Jun-2008 |
945 |
500 |
444 |
- |
701 |
- |
244 |
| |
Sep-2008 |
672 |
255 |
417 |
- |
353 |
- |
319 |
| |
Dec-2008 |
730 |
230 |
499 |
- |
429 |
- |
301 |
Statement VII: Residual Maturity and Sector - wise Classification of Consolidated International Claims of Banks (Based on CBS Statements) - Amount outstanding as at end of Period on Immediate Country Risk Basis (Concld.) |
(Rs. crore) |
Country of Transacting Units |
Period |
Total International Claims |
Residual Maturity |
Sector |
Short-Term |
Long-Term |
Unallocated |
Bank |
Non-Bank Public |
Non-Bank Private |
Spain (Incl. Balaric is, |
Dec-2007 |
859 |
757 |
102 |
- |
160 |
- |
699 |
Canary is and Ceuta |
Mar-2008 |
921 |
843 |
79 |
- |
18 |
- |
903 |
& Melilla) |
Jun-2008 |
830 |
744 |
86 |
- |
- |
- |
830 |
| |
Sep-2008 |
794 |
755 |
39 |
- |
- |
- |
794 |
| |
Dec-2008 |
821 |
714 |
107 |
- |
- |
- |
821 |
Sri Lanka |
Dec-2007 |
2114 |
1608 |
506 |
- |
479 |
237 |
1398 |
| |
Mar-2008 |
2434 |
2007 |
427 |
- |
1025 |
192 |
1217 |
| |
Jun-2008 |
2456 |
2021 |
434 |
1 |
989 |
331 |
1136 |
| |
Sep-2008 |
2240 |
1825 |
414 |
- |
652 |
181 |
1407 |
| |
Dec-2008 |
2281 |
1916 |
318 |
47 |
596 |
328 |
1357 |
Sweden |
Dec-2007 |
938 |
904 |
35 |
- |
811 |
- |
127 |
| |
Mar-2008 |
886 |
843 |
43 |
- |
693 |
- |
193 |
| |
Jun-2008 |
934 |
740 |
194 |
- |
784 |
- |
149 |
| |
Sep-2008 |
859 |
686 |
173 |
- |
684 |
- |
175 |
| |
Dec-2008 |
792 |
654 |
137 |
- |
709 |
- |
82 |
Switzerland |
Dec-2007 |
1807 |
1393 |
414 |
- |
792 |
1 |
1013 |
(Includes BIS) |
Mar-2008 |
1746 |
1432 |
314 |
- |
761 |
- |
984 |
| |
Jun-2008 |
1718 |
1302 |
416 |
- |
604 |
3 |
1112 |
| |
Sep-2008 |
1313 |
911 |
403 |
- |
684 |
2 |
628 |
| |
Dec-2008 |
1597 |
812 |
785 |
- |
850 |
- |
746 |
United Arab Emirates |
Dec-2007 |
7467 |
4641 |
2826 |
- |
1448 |
1 |
6018 |
| |
Mar-2008 |
7990 |
5405 |
2585 |
- |
1177 |
- |
6812 |
| |
Jun-2008 |
7977 |
4967 |
3010 |
- |
1047 |
- |
6930 |
| |
Sep-2008 |
8082 |
4977 |
3105 |
- |
1316 |
1 |
6765 |
| |
Dec-2008 |
9660 |
5296 |
4364 |
- |
984 |
- |
8675 |
United Kingdom @ |
Dec-2007 |
24987 |
15922 |
8237 |
828 |
9582 |
15 |
15391 |
| |
Mar-2008 |
21899 |
13161 |
7819 |
920 |
10211 |
17 |
11672 |
| |
Jun-2008 |
22662 |
12184 |
9331 |
1147 |
10084 |
13 |
12565 |
| |
Sep-2008 |
23109 |
11313 |
9851 |
1945 |
10623 |
14 |
12472 |
| |
Dec-2008 |
25246 |
11481 |
12255 |
1510 |
12518 |
6 |
12722 |
United States (Incl. |
Dec-2007 |
33114 |
26405 |
6709 |
- |
10795 |
391 |
21927 |
Midway is., |
Mar-2008 |
35374 |
27741 |
7618 |
16 |
10680 |
323 |
24371 |
Wake Islands) # |
Jun-2008 |
37447 |
27502 |
9930 |
14 |
12970 |
292 |
24185 |
| |
Sep-2008 |
39294 |
27703 |
11410 |
181 |
10857 |
153 |
28283 |
| |
Dec-2008 |
43986 |
28502 |
15484 |
- |
13159 |
268 |
30560 |
@ : excluding Guernsey, Isle of Man and Jersey, # : includes Miday Island and Wake Islands. ‘-’ : nil/negligible.
Notes: 1. Totals may not tally due to rounding off.
2. Residual Maturity “Unallocated” comprises maturity not applicable (e.g., for equities) and maturity information not available.
3.“No Specific Country” means the country information has not been provided by the reporting bank branches.
4. Data have been revised for previous quarters. |
Annex 1. BIS Reporting System of International Banking Statistics
The BIS reporting system of IBS has two sets of statistics, viz., (i) “Locational Banking Statistics (LBS)” and (ii) “Consolidated Banking Statistics (CBS)” both quarterly reviews. The LBS are designed to provide comprehensive and consistent quarterly data on international banking business conducted in the BIS reporting area. The purpose of the CBS is to provide comprehensive and consistent quarterly data on banks’ financial claims on other countries, both on an immediate borrower basis for providing a measure of country transfer risk, and on an ultimate risk basis for assessing country risk exposures of national banking system.
The international banking business is defined as banks’ on balance-sheet liabilities and assets vis-à-vis non-residents in any currency or unit of account plus similar liabilities and assets vis-à-vis residents in foreign currencies or units of account.
2. BIS Reporting Area for International Banking Statistics
2.1 Reporting Area for Locational Banking Statistics:
The aim of the LBS is to provide accurate, comprehensive and up-to-date information on international banking activity. To achieve this goal, data should ideally be collected from banks in each and every country. However, the hub like nature of international banking means that it is sufficient to gather data from only a limited number of key international banking centres. In this way at least one side of most international banking relationships will be captured. This procedure keeps the system manageable and produces accurate and up-to-date data. Additional countries are, therefore, asked to contribute to the LBS when their cross-border banking business becomes substantial. The countries currently making up the reporting area are listed in Box 1.
2.2 Reporting Area for Consolidated Banking Statistics:
The CBS are a hybrid scheme combining features of a worldwide-consolidated reporting system with elements of a territorial, i.e., balance of payments, based reporting system. For this reason, it is not possible to speak of a “reporting area” that is well defined in terms of the location of the banking offices conducting the business in question. The worldwide consolidation of balance sheet positions means that the activities of a great number of banking offices located outside the reporting countries are also covered. The expression “reporting area” is used for reasons of convenience to indicate the countries that submit data to the BIS (see Box 1).
3. Distinction/Relation
between IBS of India vis-à-vis External Debt of India In India, with the growing liberalization of the external sector, close monitoring of the cross border flow of funds assume critical importance. Commercial and cooperative banks in India (including foreign banks having offices in India) provide information on their domestic and international operations to the Reserve Bank of India (RBI) to meet the specific regulatory and policy requirements. Currently, efforts have been made to meet the data standards of BIS by devising a new reporting system for International Banking Statistics (IBS) of India. The IBS is not the same as the external debt statistics, which are separately collected and disseminated (see the Box 2).
Box 1: Countries Reporting IBS data to the BIS |
I. Reporting countries providing Locational Banking Statistics to the BIS: |
Australia (1997) |
Cyprus (2009) |
Italy (1977) |
Portugal (1977) |
Austria (1987) |
Denmark (1977) |
Japan (1977) |
Singapore (1983) |
Bahamas1 (1983) |
Finland (1983) |
Jersey (2001) |
South Korea (2005) |
Bahrain (1983) |
France (1977) |
Luxembourg (1977) |
Spain (1983) |
Belgium (1977) |
Germany (1977) |
Macau SAR (2006) |
Sweden (1977) |
Bermuda (2002) |
Greece (2001) |
Malaysia (2008) |
Switzerland (1977) |
Brazil (2002) |
Guernsey (2001) |
Mexico (2003) |
Turkey (2000) |
Canada (1977) |
Hong Kong SAR (1983) |
Netherlands (1977) |
United Kingdom (1977) |
Cayman Island (1983) |
India (2001) |
Netherlands Antilles (1983) |
United States (1977) |
Chile (2002) |
Ireland (1977) |
Norway (1983) |
|
Chinese Taipei (2000) |
Isle of Man (2001) |
Panama (2002) |
|
II.Reporting countries providing Consolidated Banking Statistics to the BIS: |
Australia (2003) |
Finland (1985) |
Japan (1983) |
Spain (1985) |
Austria (1983) |
France (1983) |
Luxembourg2 (1983) |
Sweden (1983) |
Belgium (1983) |
Germany (1983) |
Mexico2 (2003) |
Switzerland (1983) |
Brazil2 (2002) |
Greece (2003) |
Netherlands (1983) |
Turkey (2000) |
Canada (1983) |
Hong Kong SAR2 (1997) |
Norway (1994) |
United Kingdom (1983) |
Chile (2002) |
India (2001) |
Panama2 (2002) |
United States (1983) |
Chinese Taipei (2000) |
Ireland (1983) |
Portugal (1999) |
|
Denmark2 (1983) |
Italy (1983) |
Singapore (2000) |
|
1: Semiannual Reporting.
2: Provides only consolidated banking statistics on an immediate borrower basis.
Note : Year in bracket indicates first year of data submission to the BIS.
Source: BIS: International Banking Statistics December 2008. |
4. Methodoly of Compilation of LBS and CBS
The LBS provide for the collection of data on the positions of all banking offices located within the reporting area. Such offices report exclusively on their own (unconsolidated) business, which thus includes international transactions with any of their own affiliates (branches, subsidiaries, joint ventures) located either inside or outside the reporting area. The basic organizing principle underlying the reporting system is the residence of the banking office. This conforms to balance of payments and external debt methodology. In addition, data on ownership or nationality basis are also calculated by regrouping according to country of origin. Thus, the LBS cover both international liabilities and assets of offices of domestic and foreign banks operating within the reporting country. The LBS data are classified by currency (domestic and foreign currencies), sector (banks and non-banks) and country of residence of counter party, and by nationality of reporting banks. Box 2: External Debt Statistics vis-à-vis International Banking Statistics of India In India, while the international banking statistics have been developed recently, there has been a closely related reporting system of external debt statistics. Besides, there are other periodic returns through which banks are reporting external assets and liabilities to the Reserve Bank of India. The existing systems are not as much comprehensive as the IBS system for reporting international liabilities and assets of banks in India. The external debt statistics and international banking statistics are different in many respects. First, external debt statistics relates to external debt of the country as a whole comprising banking and other sectors whereas international banking statistics relates to international liabilities as well as international assets in respect of only banks. Second, liabilities of banks in foreign currencies towards residents (like, Exchange Earners’ Foreign Currency (EEFC) A/Cs, Resident Foreign Currency (RFC) A/Cs, Intra-bank foreign currency deposits/borrowing, etc.) are included in International Banking Statistics, whereas the same are not included under external debt statistics. Third, equities of banks held by NRIs, Rupee and ACU Dollar balances in VOSTRO A/Cs+, non-debt credit flows on account of ADRs/GDRs and capital supplied by head offices of foreign banks in India form part of International Banking Statistics. The CBS focus on the assets side of banks’ balance sheet. The data mainly cover financial claims reported by domestic banks’ offices, including the exposures of their foreign affiliates, and are collected on worldwide basis with interoffice transactions being netted out. Unlike the locational banking statistics, the consolidated banking statistics call for maturity details of assets, and they also entail a somewhat finer sectoral breakdown (banks, non-bank public sector and non-bank private sector). The additional information can be used to supplement locational banking data while compiling and evaluating external debt statistics from creditor side, although, unlike the locational statistics, the reporting system underlying the consolidated statistics does not conform to balance of payments and external debt methodology. Thus, in the CBS, banks with head office in the reporting country (e.g., India) provide data on total international assets for their all offices in the reporting country and abroad excluding inter-office transactions, i.e., data are reported on consolidated basis. Affiliates/ branches of foreign banks operating in the reporting country (e.g., India) also report their claims on countries other than the reporting country (e.g., India) including transactions with their offices outside the reporting country.
In the CBS, the reporting banks are classified under three categories, viz., “Domestic Banks” having head offices in India, “Inside Area Foreign Banks” having head offices in another BIS Reporting country and “Outside Area Foreign Banks” having head offices outside BIS– Reporting countries. The following aspects are taken into consideration for reporting/ segregating the international claims for the three categories of banks:
(i) Head offices of banks in the reporting countries (i.e., domestic banks) are required to provide consolidated reports on financial claims of their offices worldwide both on an ultimate risk and an immediate borrower basis; worldwide consolidated reporting entails that, for example, an Indian bank, with a foreign branch in the US, should report – (a) the claims of its domestic branches on all non-residents, (b) the claims of its foreign branch in the US on all non-residents (but other than entities in India), and (c) the claims, of its foreign branch in the US, on residents/entities in the US in currencies other than US dollar. Claims between the Indian head office and its foreign branch in the US should be netted out. Besides, the foreign branches are also required to report their local assets and local liabilities in local currency.
(ii) Banking offices in reporting countries whose head office is located in another reporting country (i.e., inside area foreign banks, such as, Mumbai office of a US bank where US is a BIS reporting country) are required to provide non-consolidated data on claims on entities in their respective home country only (e.g., the branch or subsidiary of a US bank in India should report its claims on the US only to avoid the double counting of its claims on other countries which are reported through its head office to the BIS) and on an immediate borrower basis only. These data should, therefore, include any positions the banks have vis-à-vis their own affiliates or head offices in their home country.
(iii) Banking offices in reporting countries whose head office is outside the reporting countries (i.e., outside area foreign banks, such as, Mumbai office of a Thai bank where Thailand is not a BIS reporting country) are required to provide non-consolidated data on financial claims on non-residents, including their home country, on an immediate borrower basis only.
The three major sub-components of international assets and liabilities are: (i) loans and deposits, (ii) holding of debt securities and own issues of debt securities, and (iii) other assets and liabilities. The “other assets and liabilities” mainly comprise, on the asset side, equity shares (including mutual and investment fund units and holdings of shares in a bank’s own name but on behalf of third parties), participations, and working capital supplied by head offices to their branches abroad and, on the liability side, working capital received by local branches from their head offices abroad.
The BIS revised its guidelines for consolidated banking statistics (CBS) by modifying its reporting format and increasing the coverage of products by including financial instruments such as derivatives, guarantees, etc. The revised system has been implemented from the reporting quarter March 2005, which covers, besides existing items, the claims of domestic reporting banks on ultimate risk basis arising from derivatives, guarantees and credit commitments. 5. Terms Used in International Banking Statistics
Cross border positions |
: |
It refers to the transactions (assets/liabilities) with non-residents in any currency. |
International position |
: |
Banks' on balance sheet assets and liabilities vis-à-vis non-residents in any currency plus similar assets and liabilities vis-à-vis residents in foreign currencies. |
Foreign claims |
: |
It can be disaggregated into cross-border claims and local claims of foreign branches of domestic banks. Alternately, it can also be disaggregated into international claims and local claims denominated in local currencies. |
International Claims |
: |
They are defined as cross border claims plus local claims in foreign currencies. |
Cross-border Claims |
: |
They are the claims on the borrowers resident outside the country in which the office of bank booking the claim is located. |
Local Claims |
: |
It is the claim booked by foreign offices of domestic banks on the resident of the country in which foreign office is located. |
6. Explanation of the Methodology:
(a) Compilation of LBS/CBS and Different Terms Used in IBS with the Help Of an Example
Reporting of IBS Data |
Reporting Bank |
Assets/ Liabilities |
Currency+ |
Assets with/Liabilities towards |
|
|
|
IN |
LK |
US |
XX |
|
|
|
1 |
2 |
3 |
4 |
Domestic(Indian) Banks' |
Asset |
Local |
A |
- |
15 |
25 |
10* |
Branches in India (IN) |
|
Non-Local |
B |
15 |
5 |
30 |
10 |
| |
Liability |
Local |
C |
- |
15 |
20 |
10* |
| |
|
Non-Local |
D |
12 |
15 |
10 |
5 |
Domestic (Indian) Banks' |
Asset |
Local |
E |
25 |
10 |
30 |
5 |
Branches in the US |
|
Non-Local |
F |
20 |
30 |
35 |
10 |
| |
Liability |
Local |
G |
- |
- |
35 |
- |
| |
|
Non-Local |
H |
- |
- |
- |
- |
US based Banks' |
Asset |
Local |
I |
- |
20 |
25 |
15 |
Branches in India (IN) |
|
Non-Local |
J |
10 |
15 |
30 |
5 |
(Inside Area Bank) |
Liability |
Local |
K |
- |
20 |
35 |
10 |
| |
|
Non-Local |
L |
25 |
20 |
40 |
5 |
Sri Lanka based |
Asset |
Local |
M |
- |
20 |
15 |
10 |
Banks' Branches in |
|
Non-Local |
N |
10 |
30 |
20 |
15 |
India(IN) (Outside |
Liability |
Local |
O |
- |
12 |
25 |
10 |
Area Bank) |
|
Non-Local |
P |
20 |
15 |
35 |
10 |
IN - INDIA, LK - SRI LANKA, US - UNITED STATES, XX - NOT A SPECIC COUNTRY.
+ : Local/non-local currency is according to the country of operation of the reporting branches.
* : Asset/Liabilities with/towards own office operating in the country 'XX'.
'—' : Not required under IBS reporting. |
Annex (Concld.) |
Compilation of LBS/CBS |
Locational Banking Statistics (LBS) |
Country |
International Assets |
International Liabilities |
IN |
B1+J1+N1 |
35 |
D1+L1+P1 |
57 |
LK |
A2+B2+I2+J2+M2+N2 |
105 |
C2+D2+K2+L2+02+P2 |
97 |
US |
A3+B3+I3+J3+M3+N3 |
145 |
C3+D3+K3+L3+ 03+P3 |
165 |
XX |
A4+B4+I4+J4+M4+N4 |
65 |
C4+D4+K4+L4+ 04+P4 |
50 |
Consolidated Banking Statistics (CBS) |
Reporting Banks according to Country of Incorporation |
Cross Border Claims(in all curriencies) |
Local Claims in Currency |
International Claims |
Foreign Claims |
Non local |
Local |
| |
1 |
2 |
3 |
4[='1'+'2'] |
5[='3'+'4'] |
Domestic (Indian) Banks |
X |
140 |
35 |
30 |
175 |
205 |
Inside Area Banks |
Y |
55 |
- |
- |
55 |
55 |
Outside Area Banks |
Z |
110 |
- |
- |
110 |
110 |
Note: The claims on home country (i.e., India) is excluded in CBS.
X1=140 (=A2+A3+A4+B2+B3+E2+E4+F2+F4) X2=35 (=F3) X3=30 (=E3)
Y1= 55 (=I3+J3) Z1=110 (=M2+M3+M4+N2+N3+N4)
'—' : Not required under CBS reporting. |
(b) Compilation of Risk Transfer: The procedure for calculating Outward Risk/ Inward Risk/Net Risk transfer is given in the following Table.
Country of Operation of Reporting Banks |
Country of Immediate Risk (Country of Customer/ Borrower) |
Country of Ultimate Risk (Guarantors’ Country) |
Balance |
|
1 |
2 |
3 |
4 |
|
IN |
IN |
IN |
10 |
A |
IN |
IN |
GB |
30 |
B |
US |
GB |
IN |
50 |
C |
US |
GB |
GB |
25 |
D |
IN |
GB |
US |
45 |
E |
JP |
US |
GB |
15 |
F |
Risk Transefer |
Country |
IN |
GB |
US |
Outward Risk (O)* |
_ |
C4+E4 |
F4 |
| |
|
95 |
15 |
Inward Risk (I)# |
- |
B4+F4 |
E4 |
| |
|
45 |
45 |
Net risk (I - O) |
- |
-50 |
30 |
IN - INDIA, US - UNITED STATES, GB - UNITED KINDOM, JP - JAPAN.
‘–’ : Not required under IBS reporting.
* : Exposure against the country which is guaranteed by another country.
# : Exposure against the guaranteeing country which is availed by another country. |
* Prepared in the Banking Statistics Division of the Department of Statistics and Information Management. The previous article on the subject as at end of September 2008 was published in June 2009 issue of the Bulletin. 1 A brief outline of the BIS reporting system of IBS comprising LBS and CBS, purpose of IBS, BIS reporting area for IBS, the distinction / relation between IBS vis-à-vis external debt of India has been provided in the Annex. 2 The methodology of compilation of LBS/CBS and explanation to various terms used in IBS has been provided in the Annex to this article. + These are accounts of non-resident branches of banks with banks in India in ACU Dollar or Indian Rupee. |