International Trade in Banking Services, 2007-08* The survey on International Trade in Banking Services for 2007-08 was conducted in continuation of earlier survey for 2006-07 to obtain the data on international trade in banking services. In this survey 121 overseas branches of 12 Indian banks and 273 branches of 27 foreign banks operating in India were covered. The international trade in banking services is captured based on the explicit and implicit fees or commission charged to the customers for financial auxiliary services rendered by the banks. The services covered in the survey are (i) deposit account management services, (ii) credit related services, (iii) financial leasing services, (iv) trade finance related services, (v) payment and money transmission services, (vi) fund management services, (vii) financial consultancy and advisory services, (viii) underwriting services, (ix) clearing and settlement services, and (x) derivative, stock, securities and foreign exchange trading services. Results of the survey revealed that Indian banks abroad generated major share of fee income by rendering credit related services, whereas foreign banks in India generated major share of fee income by rendering derivative, stock, securities, foreign exchange trading services.
Introduction
In the context of ongoing negotiations for liberalising the financial services sector under the World Trade Organisation (WTO) as a part of General Agreement on Trade in Services (GATS), data on International Trade in Banking Services becomes important. In order to make available the basic information on trade in banking services in India and for the creation of a consistent and comparable database with international standards for policy decisions, first survey on International Trade in Banking Services was launched in January 2008 for the year 2006-07. This article is based on the survey launched in September 2008 and covers data for 2007-08. The main objective of the survey is to collect disaggregated information relating to various banking services rendered by the overseas branches of Indian banks as well as the banking services rendered by the foreign bank branches operating in India. Methodology adopted for conduct of the survey and coverage are presented in Annex-I. A copy of the survey schedule is given in Annex – II.
The article is organised into six sections. The distribution of branches of Indian banks abroad and foreign banks in India is presented in Section I. Section II examines the business growth of Indian banks abroad and foreign banks in India. The trend in profitability of Indian banks and foreign banks is discussed in Section III. Section IV examines the trade in banking services of Indian banks abroad and foreign banks in India. Section V presents a disaggregated activity-wise analysis. A summary of conclusions drawn based on this survey is presented in Section VI. Section I
Distribution of branches of Indian banks operating abroad Out of total 129* branches/offices of Indian banks operating abroad in 29 countries as at end March 2008, banks furnished data for 121 Indian overseas branches operating in 27 countries on International Trade in banking services. Similarly out of 280** foreign bank branches operating in India as at end March 2008, the survey covered 273 branches of foreign banks. Bank of Baroda had the largest overseas presence with 42 branches in 12 countries, followed by State Bank of India (33 branches in 18 countries) and Bank of India (22 branches in 8 countries). The United Kingdom was having the highest number of Indian banks’ branches (23), followed by Hong Kong (12), Singapore (9), Fiji (9), United Arab Emirates (9), Mauritius (8), and Sri Lanka (7).
Employment
The details of number of branches and number of employees of Indian banks operating abroad and foreign banks operating in India are given in Table 1. The foreign banks operating in India employed 99.6 per cent of their employees locally while the Indian banks operating abroad employed 74.5 per cent of employees from local sources, 22.0 per cent from India and remaining 3.5 per cent from other countries.
Table 1: Details of Employees as at end-March 2008 |
Item |
Indian Banks operating abroad |
Foreign Banks operating in India |
1 |
2 |
3 |
Number of Branches |
121 |
273 |
Number of Employees |
4647 |
30159 |
of which; |
|
|
Local |
3461 |
30062 |
Indians |
1023 |
NA |
Others |
163 |
97 |
NA : Not Applicable. |
Section II
Indian banks’ growth in overseas business The growth of assets / liabilities of Indian banks’ branches operating abroad was 9.1 per cent during 2007-08 as against 55.8 per cent in the previous year (Table 2). The credit extended and deposits mobilised by the Indian banks’ branches abroad increased by 36.8 per cent and 9.9 per cent, respectively during 2007-08 compared to 48.8 per cent and 51.3 per cent, respectively in the previous year. Thus, there was distinctive slow down in the banking activity of the overseas branches of the Indian banks in 2007-08 as compared to the previous year. The share of credit extended in total assets of Indian banks branches operating overseas increased by 57.6 per cent as at end March 2008 over the corresponding period of the previous year whereas the share of deposits mobilised in total liabilities of Indian banks increased marginally for the same period. The shares of total business (credit extended and deposits mobilised) in total assets/liabilities of Indian banks, which was at 86.5 per cent as at March end 2007 increased to 98.7 per cent as at March end 2008. Foreign Banks’ share in Indian Banking Business
The share of foreign banks in Indian banking business in terms of credit extended, deposits mobilised and total assets/liabilities are presented in Table 3. The share of foreign banks’ assets in total assets of Scheduled Commercial Banks (SCBs) increased to 8.4 per cent in 2007-08 from 7.9 per cent in 2006-07 whereas their share of credit in total credit of SCBs increased marginally at 6.5 per cent compared to 6.3 per cent in the corresponding period of the previous year. The share of foreign banks’ income in total income of SCBs increased from 8.8 per cent to 9.5 per cent during the period under review, due to increase in share of interest income (from 7.6 per cent to 7.9 per cent) as well non-interest income (from 15.1 per cent to 17.5 per cent).
The total assets / liabilities of foreign banks operating in India grew by 33.4 per cent during 2007-08. The deposit growth was higher at 29.6 per cent than the growth of credit at 24.5 per cent in 2007-08.
Table 2: Balance Sheet Items of Indian Banks' Branches Operating Abroad |
(Rs. crore) |
Item |
As at end-March |
2006 |
2007 |
2008 |
Growth
(%) in
2006-07 |
Growth
(%) in
2007-08 |
Amount |
Per cent
to total
Assets |
Amount |
Per cent
to total
Assets |
Amount |
Per cent
to total
Assets |
1 |
2 |
3 |
4 |
5 |
6 |
7 |
8 |
9 |
Credit extended |
78657 |
47.9 |
117069 |
45.7 |
160185 |
57.6 |
48.8 |
36.8 |
Deposits mobilized |
69078 |
42.0 |
104526 |
40.8 |
114826 |
41.1 |
51.3 |
9.9 |
Total Assets/ Liabilities |
164310 |
|
256018 |
|
279300 |
|
55.8 |
9.1 |
Table 3: Foreign Banks' Share in Indian Banking Business |
(Rs. crore) |
|
All Scheduled Commercial Banks* |
Foreign Banks covered in the survey |
Foreign banks’ share
in Indian banking
Business (%) |
2006-07 |
2007-08 |
2006-07 |
2007-08 |
2006-07 |
2007-08 |
1 |
2 |
3 |
4 |
5 |
6 |
7 |
No. of Reporting Banks |
82 |
79 |
25 |
27 |
25 |
27 |
Assets/Liabilities |
3459946 |
4326469 |
272824 |
364019 |
7.9 |
8.4 |
|
|
|
|
(33.4) |
|
|
Credit |
1981235 |
2477037 |
124512 |
160646 |
6.3 |
6.5 |
|
|
|
|
(24.5) |
|
|
Deposits |
2696934 |
3320052 |
147347 |
191015 |
5.5 |
5.8 |
|
|
|
|
(29.6) |
|
|
Total Income |
274714 |
368884 |
24175 |
349345 |
8.8 |
9.5 |
of which; |
|
|
|
|
|
|
Interest received |
231673 |
309568 |
17672 |
24578 |
7.6 |
7.9 |
Total Expenditure |
208733 |
285212 |
17401 |
24689 |
8.3 |
8.7 |
of which; |
|
|
|
|
|
|
Interest paid |
142418 |
207999 |
7424 |
10769 |
5.2 |
5.2 |
Net Interest Margin |
2.85 |
2.60 |
4.38 |
4.33 |
- |
- |
* Source: Statistical Tables relating to banks in India – : Not applicable. Figures in the bracket indicate annual growth in the respective items. |
Section III
Income and Expenditure he total income of Indian banks’ branches operating abroad amounting to Rs. 16,048 crore, registered a growth of 14.7 per cent in 2007-08 (Table 4) as against 44.5 per cent growth in the income of foreign banks operating in India. The growth of interest income was lower in both Indian banks and foreign banks implying that during 2007-08 the non-interest income increased at a higher rate than interest income. In absolute terms, the non-interest income was only Rs.651 crore for Indian banks’ branches operating overseas compared to Rs. 10,356 crore for foreign banks’ branches in India in 2007-08.
Table 4: Income and Expenditure |
(Rs. crore) |
Item |
Indian Banks' branches Operating Abroad |
Foreign Banks' branches operating in India |
|
2006-07 |
2007-08 |
Growth (%) |
2006-07 |
2007-08 |
Growth (%) |
1 |
2 |
3 |
4 |
5 |
6 |
7 |
Income |
13987 |
16048 |
14.7 |
24175 |
34934 |
44.5 |
of which; |
|
|
|
|
|
|
Interest Income |
13674 |
15397 |
12.6 |
17672 |
24578 |
39.1 |
Expenditure |
11265 |
13264 |
17.8 |
17401 |
24689 |
41.9 |
of which; |
|
|
|
|
|
|
Interest Expenditure |
10909 |
12552 |
15.1 |
7424 |
10769 |
45.1 |
Table 5: Profitability Ratios |
(Per cent) |
Profitability Ratio |
Indian Banks' Branches Operating Abroad |
Foreign Banks' Branches Operating in India |
2006-07 |
2007-08 |
2006-07 |
2007-08 |
1 |
2 |
3 |
4 |
5 |
Income to Total Assets |
5.5 |
5.7 |
8.9 |
9.5 |
Net Profits to Total Income |
19.5 |
17.3 |
28.0 |
29.3 |
Net Profits to Total Assets |
1.1 |
1.0 |
2.5 |
2.8 |
Further, the interest expenses of Indian banks’ overseas branches was higher at Rs.12,552 crore compared to Rs. 10,769 crore of foreign banks operating in India during the same period.
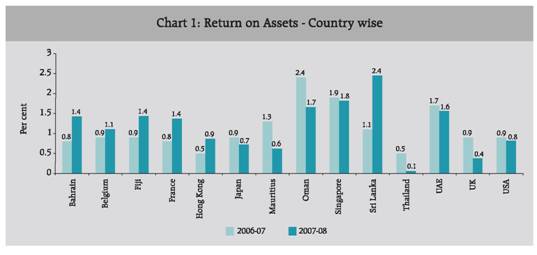
The profitability ratios, viz., income to total assets, net profit to total income and net profit to total assets of the foreign banks operating in India improved during 2007-08 as compared to the previous year (Table 5). In contrast, net profit to total income of Indian banks operating abroad declined from 19.5 per cent in 2006-07 to 17.3 per cent in 2007-08 whereas the income to total assets and net profit to total assets changed marginally. Country-wise Profitability of Indian Banks’ Branches Operating Abroad
Country-wise return, i.e., net profit on total assets of Indian banks operating abroad is presented in Chart 1.
The return on assets of Indian banks operating in Sri Lanka was the highest at 2.4 per cent in 2007-08, followed by Singapore (1.8 per cent) and Oman (1.7 per cent). It was observed that return on assets of Indian banks’ overseas branches improved in 2007-08 over the preceding year in case of Sri Lanka, Bahrain, Belgium, France and Hong Kong and declined in case of Japan, Mauritius, Thailand, the UK and the US.
Section IV
Trade in Banking Services – Indian Banks’ Branches Operating Abroad The trade in banking services extended was captured based on explicit and implicit fees or commission charged to the customers for various services rendered by the Indian banks’ branches operating abroad. In this survey the financial services produced by the banks were classified into eleven major groups. These services include deposit account management services, credit related services, financial leasing services, trade finance related services, payment and money transmission services, fund management services, financial consultancy and advisory services, underwriting services, clearing and settlement services, “derivative, stock, securities, foreign exchange trading services” and other financial services. Further details are explained in Annex-I. Activity-wise Trade in Banking Services – Indian Banks’ Overseas Branches
The activity-wise fee income generated through rendering banking services by the Indian banks’ branches abroad is presented in Table 6. It is observed that the fee income generated by rendering trade in banking services by the Indian banks’ branches operating abroad increased significantly by 83.5 per cent from Rs. 1,890 crore in 2006-07 to Rs. 3,468 crore in 2007-08. Among various banking services, fee income generated by rendering services like credit related services, clearing and settlement services and financial consultancy and advisory services recorded a significant growth in 2007-08 over 2006-07. There was a decline in the income generated by way of payment and transmission services (38.9 per cent), fund management services (99.9 per cent) and underwriting services (99.0 per cent) during 2007-08 compared to the previous year.
Table 6: Composition of Trade in Banking Services - Activity-wise |
(Rs. Lakhs) |
Name of Banking Services |
2006-07 |
2007-08 |
Growth (%) |
1 |
2 |
3 |
4 |
Deposit Account Management Services |
5291 |
6935 |
31.1 |
Credit Related Services |
82751 |
189744 |
129.3 |
Financial Leasing Services |
0 |
0 |
0.0 |
Trade Finance Related Services |
40986 |
48969 |
19.5 |
Payment and Money Transmission Services |
33308 |
20353 |
-38.9 |
Fund Management Services |
6635 |
8 |
-99.9 |
Financial Consultancy and Advisory Services |
2365 |
17349 |
633.5 |
Underwriting Services |
529 |
5 |
-99.0 |
Clearing and Settlement Services |
55 |
2000 |
3550.0 |
Derivative, Stock, Securities, Foreign Exchange trading Services |
15817 |
27375 |
73.1 |
Other Financial Services |
1295 |
34091 |
2533.1 |
Total |
189032 |
346829 |
83.5 |
Further, credit related services, trade finance related services, derivative, stock, securities, foreign exchange trading services and payment & money transmission services were the major banking services rendered by the Indian banks operating abroad. The respective shares were 54.7 per cent, 14.2 per cent, 7.9 per cent and 5.9 per cent, respectively in 2007-08 (see Table 9). The Indian banks operating abroad had hardly generated any income through fund management and underwriting services. None of overseas branches of Indian banks generated any fee income from financial leasing services in 2007-08.
Trade in Banking Services by Indian Banks operating Abroad – Residents and Non-Residents
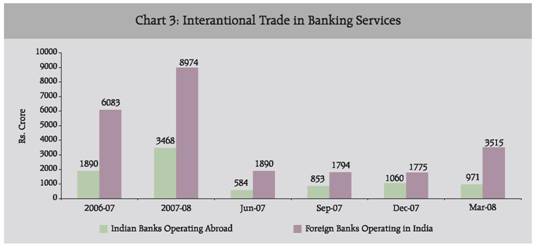
The fee income of the Indian banks operating abroad by rendering banking services to residents increased from Rs. 578 crore in 2006-07 to Rs. 1189 crore in 2007-08 which was almost one third of total fee based income (Table 7). The fee income generated by rendering the banking services to residents grew at a faster rate than to non-residents.
Further, the share of fee income derived from residents increased in 2007-08 (34.3 per cent) as compared to the previous year (30.6 per cent), while the share of fee income from non-residents decreased correspondingly (Chart 2). The fee income from non-residents (in India) constituted 25.8 per cent of total fee income in 2007-08 as compared to 35.9 per cent in the previous year. The fee income generated from extending banking services to non-residents of other countries accounted for 39.9 per cent to total fee based income and had improved over last year (by 33.5 per cent).
Table 7: Trade in Banking Services (Fee Income) by Indian Banks abroad-Residents and Non-Residents |
(Rs. crore) |
Item |
2006-07 |
2007-08 |
Growth(%) |
1 |
2 |
3 |
4 |
Residents |
578 |
1189 |
105.7 |
Non-Residents, |
1312 |
2279 |
73.7 |
of which |
|
|
|
In India |
679 |
895 |
31.8 |
In Other Countries |
633 |
1384 |
118.6 |
Total Trade in Banking Services (Fee Income) |
1890 |
3468 |
83.5 |
Country-wise Trade in Banking Services - Indian Banks’ Branches Operating Abroad
The country-wise trade in banking services by the Indian banks’ branches operating abroad is presented in Table 8. the UK, Singapore, Bahrain, Hong Kong, Sri Lanka, the US, the UAE and Belgium were the major countries not only accounting for the major share (76.7 per cent) in trade in banking services of the Indian banks but had also seen significant growth in trade in banking services in 2007-08 over 2006-07. Among 37 countries, Singapore had the largest share of 25.8 per cent in total fee income generated from trade in banking services, followed by the UK (17.4 per cent), Bahrain (11.8 per cent) and Sri Lanka (8.6 per cent) in 2007-08.
 |
Table 8: Trade in Banking Services - Country-wise |
(Rs. Lakhs) |
Country |
Trade in Banking Services |
Total |
DAM |
CRS |
TFR |
PMT |
DER |
All Services |
2006-07 |
2007-08 |
2006-07 |
2007-08 |
2006-07 |
2007-08 |
2006-07 |
2007-08 |
2006-07 |
2007-08 |
2006-07 |
2007-08 |
1 |
2 |
3 |
4 |
5 |
6 |
7 |
8 |
9 |
10 |
11 |
12 |
13 |
UK |
573 |
489 |
23875 |
45853 |
7509 |
10090 |
22469 |
2017 |
907 |
2043 |
55863 |
60492 |
Singapore |
1029 |
131 |
30056 |
62507 |
6029 |
12981 |
822 |
470 |
3599 |
3965 |
48169 |
89755 |
Bahrain |
11 |
61 |
13085 |
23619 |
307 |
433 |
67 |
56 |
2054 |
4941 |
17890 |
41029 |
Hong Kong |
148 |
311 |
7598 |
6962 |
5281 |
4340 |
817 |
1691 |
2425 |
6040 |
16270 |
19344 |
Sri Lanka |
39 |
868 |
133 |
19891 |
2427 |
409 |
119 |
22 |
134 |
0 |
2858 |
21462 |
USA |
9 |
143 |
1250 |
6550 |
4323 |
4554 |
3022 |
5074 |
379 |
1188 |
8983 |
17510 |
Japan |
29 |
30 |
959 |
733 |
1422 |
1507 |
437 |
338 |
2526 |
0 |
5380 |
4634 |
UAE |
1495 |
2213 |
89 |
1160 |
1870 |
3361 |
444 |
267 |
1359 |
1598 |
5257 |
8599 |
France |
0 |
0 |
487 |
993 |
2478 |
1275 |
708 |
396 |
238 |
0 |
4065 |
2767 |
Germany |
0 |
0 |
320 |
327 |
2031 |
1412 |
1063 |
943 |
120 |
0 |
3534 |
2682 |
Belgium |
28 |
167 |
731 |
4293 |
1963 |
2618 |
614 |
956 |
61 |
0 |
3396 |
8034 |
Other |
|
|
|
|
|
|
|
|
|
|
|
|
Countries |
1929 |
3011 |
4168 |
30079 |
5345 |
16079 |
2726 |
9664 |
2016 |
9643 |
17366 |
97908 |
Total |
5291 |
6934 |
82751 |
189744 |
40986 |
48969 |
33308 |
20353 |
15818 |
27375 |
189032 |
346829 |
DAM : Deposit Account Management Services. CRS : Credit Related Services.
TFR : Trade Finance Related Services. PMT : Payment & Money Transmission Services. DER : Derivative, Stock, Securities, Foreign Exchange Trading services. |
Further, as stated earlier, deposit account management services, credit related services, trade finance related services, payment & money transmission services and “derivative, stock, securities, foreign exchange trading services” were the major trade in banking services rendered by the Indian banks in these countries. Singapore was the only country where Indian banks had also rendered funds management services. Section V
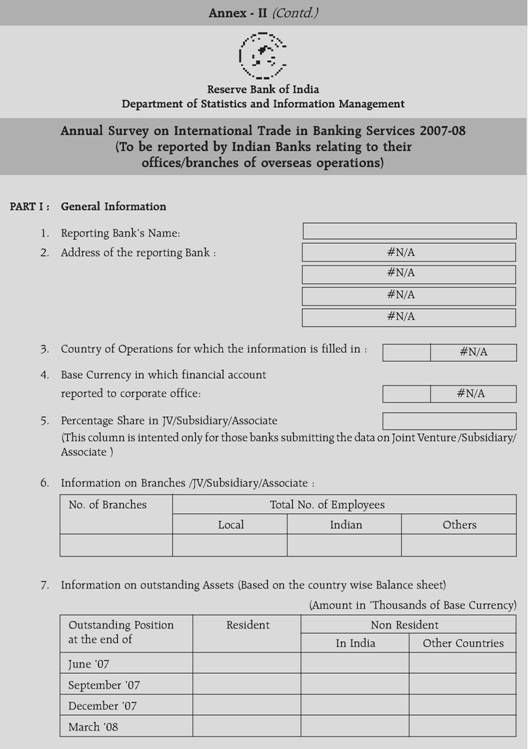
Comparison of Trade in Banking Services – Indian Banks’ Branches Operating Abroad vis-à-vis Foreign Banks’ Branches Operating in India A comparative analysis between the Indian banks’ branches operating abroad and foreign banks’ branches operating in India revealed that the Indian banks were lagging behind in generating income by rendering trade in banking services. The total fee income generated by the foreign banks operating in India was Rs. 8,974 crore whereas Indian banks operating abroad generated only Rs. 3,468 crore in 2007-08 (Chart 3).
Comparison of Trade in Banking Services - Activity-wise
Indian banks operating abroad generated major share of fee income by rendering service activity viz., credit related services, whereas in the case of foreign banks operating in India ‘derivative, stock, securities, foreign exchange trading services’ occupied the major share of total trade in banking services. The other major components of fee income for both Indian banks operating abroad and foreign banks operating in India were trade finance related services and financial consultancy and advisory services. The share of credit related services in total fee income, in case of Indian banks, increased significantly to 54.7 per cent in 2007-08 from 43.8 per cent in 2006-07 (Table 9). In case of foreign banks operating in India, the share of trade finance related services increased from 10.2 per cent to 16.5 per cent during the same period. Further, it was observed from the data that both Indian banks operating abroad as well as foreign banks operating in India had not derived any fee income by rendering financial leasing services during the period under study, i.e., 2006-07 and 2007-08.
Table 9: Composition of Trade in Banking Services |
(Per cent) |
Name of Banking Services |
Indian Banks' Branches Operating Abroad |
Foreign Banks Branches Operating in India |
|
2006-07 |
2007-08 |
2006-07 |
2007-08 |
1 |
2 |
3 |
4 |
5 |
Deposit Account Management Services |
2.8 |
2.0 |
3.0 |
5.0 |
Credit Related Services |
43.8 |
54.7 |
7.6 |
6.7 |
Financial Leasing Services |
0.0 |
0.0 |
0.0 |
0.0 |
Trade Finance Related Services |
21.7 |
14.1 |
10.2 |
16.5 |
Payment and Money Transmission Services |
17.6 |
5.9 |
23.3 |
5.0 |
Fund Management Services |
3.5 |
0.0 |
3.4 |
4.9 |
Financial Consultancy and Advisory Services |
1.3 |
5.0 |
12.5 |
8.8 |
Underwriting Services |
0.3 |
0.0 |
1.0 |
0.6 |
Clearing and Settlement Services |
- |
0.6 |
5.4 |
1.0 |
Derivative, Stock, Securities, Foreign Exchange trading Services |
8.4 |
7.9 |
28.5 |
34.1 |
Other Financial Services |
0.7 |
9.8 |
5.2 |
17.4 |
All activities |
100.0 |
100.0 |
100.0 |
100.0 |
- : negligible. |
Comparison of Trade in Banking Services - Residents and nonResidents
The composition of residents and nonresidents in total trade in banking services of Indian banks operating abroad and foreign banks operating in India is presented in Table 10. A notable contrast of generation of fee income from residents and non-residents was observed between Indian banks operating abroad and foreign banks operating in India.
Indian banks generated major share of fee income by rendering banking services to non-residents at 65.7 percent while foreign banks generated major share of fee income from residents. Foreign banks operating in India generated 95 per cent of fee income by rendering banking services to residents in 2007-08.
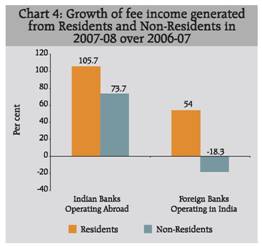
The income generated by catering financial services to residents grew at a faster rate as compared to the non-residents for foreign banks operating in India as well as Indian banks operating abroad (Chart 4). It was observed that fee income generated from banking services attended to nonresidents by foreign banks operating in India recorded a decline.
 |
Comparison of Accrual of Amounts to India and Abroad by Rendering Trade in Banking Services
Table 11 presents the amount accrued to India as well as to other countries due to fee based income generated through trade in banking services.
The amount accrued to India by Indian banks’ operations in various countries was at Rs. 3,289 crore in 2007-08 whereas the amount accrued to other countries (excluding India) by foreign origin banks’ operating in India was much higher at Rs. 8,974 crore during the corresponding period. The amount accrued to India was greater than the amount accrued to foreign countries like Singapore, Bahrain, Bangladesh, etc., during 2007-08, whereas the amount accrued to other countries was greater than amount accrued to India in case of the US, the UK, Hong Kong, Germany, etc.
Table 10: Composition of fee income generated from Trade in Banking Services |
(Per cent) |
Indian Banks |
2006-07 |
2007-08 |
Foreign Banks |
2006-07 |
2007-08 |
1 |
2 |
3 |
4 |
5 |
6 |
Residents |
30.6 |
34.3 |
Residents |
91.1 |
95.1 |
Non-Residents |
69.4 |
65.7 |
Non-Residents |
8.9 |
4.9 |
of which; |
|
|
|
|
|
To India |
35.9 |
25.8 |
|
|
|
To other countries |
33.5 |
39.9 |
|
|
|
Table 11: Accrual of Amounts to India and to Abroad |
(Rs. Lakhs) |
Country |
Foreign Banks' Branches Operating in India
Accruals to Abroad |
Indian Banks' Branches Operating Abroad
Accruals to India |
Number of Branches |
2006-07 |
2007-08 |
Number of Branches |
2006-07 |
2007-08 |
1 |
2 |
3 |
4 |
5 |
6 |
7 |
Afghanistan |
NA |
NA |
NA |
1 |
4.4 |
226.3 |
Australia |
NA |
NA |
NA |
1 |
61.7 |
911.6 |
Bahamas |
NA |
NA |
NA |
2 |
805.8 |
915.9 |
Bahrain |
2 |
322.3 |
291.2 |
4 |
17889.7 |
41028.8 |
Bangladesh |
3 |
262 |
372.6 |
4 |
597.6 |
15505.6 |
Belgium |
1 |
694.7 |
768 |
3 |
3396.5 |
8034.3 |
Canada |
5 |
939.8 |
1791.5 |
NA |
NA |
NA |
Cayman Islands |
NA |
NA |
NA |
1 |
72.4 |
22433.4 |
China |
NA |
NA |
NA |
2 |
255 |
359.8 |
Fiji |
NA |
NA |
NA |
9 |
1131.3 |
1454.9 |
France |
16 |
9291.8 |
16132.1 |
2 |
4065.2 |
2766.9 |
Germany |
10 |
34035.2 |
38802.3 |
1 |
3534.3 |
2681.9 |
Hong Kong |
47 |
142201 |
201518.4 |
12 |
15546.6 |
19344 |
Israel |
NA |
NA |
NA |
1 |
NA |
- |
Japan |
5 |
7538.3 |
5433.8 |
4 |
5380.3 |
4634.1 |
Kenya |
NA |
NA |
NA |
4 |
487.6 |
571.8 |
Maldives |
NA |
NA |
NA |
1 |
3825.8 |
7180.8 |
Mauritius |
3 |
80.5 |
29.7 |
8 |
525.3 |
1729.7 |
Netherlands |
28 |
15958.1 |
66156.5 |
NA |
NA |
NA |
Oman |
2 |
22478.8 |
3.1 |
1 |
403.4 |
256.5 |
Seychelles |
NA |
NA |
NA |
1 |
140.9 |
272.1 |
Singapore |
2 |
5130.3 |
3645.7 |
9 |
48168.7 |
89755.5 |
South Africa |
NA |
NA |
NA |
3 |
651.7 |
617.1 |
South Korea |
2 |
360.8 |
129.4 |
1 |
NA |
- |
Sri Lanka |
1 |
NA |
26951.6 |
7 |
2857.7 |
21462.3 |
Taiwan |
1 |
105.3 |
134 |
NA |
NA |
NA |
Thailand |
1 |
26.6 |
- |
1 |
225.9 |
212 |
UAE |
4 |
76.9 |
84155.4 |
9 |
5257.5 |
8598.9 |
UK |
95 |
85533.4 |
176308 |
23 |
18933.7 |
60491.8 |
USA |
45 |
283276.4 |
274741.6 |
6 |
8316.8 |
17510 |
All Countries |
273 |
608312.1 |
897364.8 |
121 |
142535.7 |
328956.27 |
NA Bank/ Branch is not operating. – Nil. |
Further, it was observed that the fee income generated by 47 branches of Hong Kong originated banks operating in India was Rs. 2,015 crore whereas that by 12 branches of Indian banks operating in Hong Kong was merely Rs. 193 crore in 2007-08. There were 95 branches of UK origin banks operating in India with fee income of Rs.1, 763 crore as compared with only Rs. 605 crore emanating from 23 branches of Indian origin banks operating in the UK. As against 45 branches of US based banks operating in India with a fee income of Rs. 2,747 crore, Indian banks operating in the US through 6 branches could generate Rs. 175 crore in 2007-08. Section VI
Conclusions A survey on international trade in banking services was conducted among foreign banks operating in India and Indian banks having presence abroad. In all, 12 Indian banks operating abroad and 27 foreign banks operating in India had responded to the survey. The coverage of foreign banks operating in India in terms of total assets, credit extended and deposits received was around 99.9 per cent, 99.7 per cent and 99.9 per cent, respectively.
The UK was having the highest number of Indian banks’ branches (23 of 5 Indian banks), followed by Hong Kong (12), Singapore (9), Fiji (9), the UAE (9) Mauritius (8), and Sri Lanka (7). The foreign banks operating in India employed 99.6 per cent of their employees from locally available sources while Indian banks operating abroad recruited 74.5 per cent of employees from local sources.
Further, the fee income generated by the Indian banks operating abroad increased significantly by 83.5 per cent from Rs. 1,890 crore in 2006-07 to Rs. 3,468 crore in 2007-08, of which 82.6 per cent of fee income was by rendering banking services like credit related services, trade finance related services, derivative, stock, securities, foreign exchange trading services and payment & money transmission services.
A comparative analysis between the Indian banks operating abroad and foreign banks operating in India revealed that during 2007-08, the total fee income generated by the foreign banks operating in India by rendering banking services was significantly higher at Rs. 8,974 crore than that of Indian banks operating abroad which generated only Rs. 3,468 crore of fee income. Indian banks generated a major share of fee income by rendering banking services to non-residents while foreign banks generated major share of fee income from residents. Foreign banks operating in India generated 95 per cent of fee income by rendering banking services to residents during 2007-08.
The UK, Singapore, Bahrain, Hong Kong, Sri Lanka, Bangladesh were the major countries having witnessed not only the significant share in trade in banking services by the Indian banks but also had seen significant growth in trade in banking services in 2007-08 over 2006-07.
The amount accrued to India by Indian origin banks’ branches operations in various countries was at Rs. 3,289 crore during 2007-08 whereas the amount accrued to rest of the world by foreign origin banks’ operations in India was significantly higher at Rs. 8,973 crore during the same period. The fee income generated by 47 branches of Hong Kong origin banks operating in India was Rs. 2,015 crore in 2007-08 compared to the fee income at Rs. 193 crore of 12 branches of Indian origin banks operating in Hong Kong. Annex - I Methodology Financial services, particularly banking services, play an important role in promoting global, regional and bilateral economic integration. Banking services include, acceptance of deposits and lending (the core banking services), and the other financial services (Para banking services) like payment services, securities trading, asset management, financial advice, settlement and clearing service, etc. With the improvements in economic integration of financial markets and activities, the international trade in banking services has significantly increased.
The GATS framework envisages that the delivery of any commercial services can be through four different modes viz. Mode 1 – Cross Border Service, Mode 2 – Consumption abroad, Mode 3 – Commercial presence and Mode 4 – movement of natural persons. In Mode 3, the bank has a commercial presence in the territory of the service importing country and the service is delivered therein. The commercial presence can be through various investment vehicles like representative offices, branches, subsidiaries, associates and correspondents.
Banking services covered in this survey include financial auxiliary services such as (i) deposit account management services, (ii) credit related services, (iii) financial leasing services, (iv) trade finance related services, (v) payment and money transmission services, (vi) fund management services, (vii) financial consultancy and advisory services, (viii) underwriting services, (ix) clearing and settlement services, and (x) derivative, stock, securities and foreign exchange trading services. While carrying out the banking business, banks cater to the financial services needs of the residents of the country of operation as well as non-residents of that country. Keeping this in view, the survey also collected the information with bifurcation of financial services rendered to residents and non-residents, separately.
Details of Services Covered are:
• Deposit Account Management services include fees and commissions charged to or received from the deposit account holders, for maintaining deposit accounts such as fee for cheque book, fee for internet banking, commission on draft and other instrument provided, penalty for not maintaining minimum balance, etc. and any other fees charged to deposit account holders.
• Credit related services include fees received for credit-related or lending related services like credit processing fees, late payment or default charges and early redemption charges. Charges for facility and management fees, fees for renegotiating debt terms, mortgage fees, etc. also to be reported here.
• Financial Leasing services include fees or commission received for arranging or entering into financial lease contracts. This also includes fees received directly or deducted from the proceedings.
• Trade Finance related services include commission or fees charged for arranging trade finance like buyers’ and suppliers’ credit, fees for establishing/originating, maintaining or arranging standby letters of credit, letter of indemnity, lines of credit, fees for factoring services, bankers acceptance, issuing financial guaranty, commitment fees, handling charges for trade bills.
• Payment and Money Transmission services include fees or charges for electronic fund transfer services like SWIFT, TT, wire transfer, etc. ATM network Services, annual credit /debit card fees, Interchange charges, fees for point of services, etc. also have to be reported here. Further, Charges on the customer for making remittances abroad or receiving remittances from abroad have to be reported here.
• Fund Management services include fee or income received for managing or administering financial portfolios, all forms of collective investment management, pension fund management, custodial, depository and trust services. Commission or fees for safe custody of shares/equities, transaction fee for custodian account, communication cost or any other fees/charges related to custodian account should also be reported.
• Financial Consultancy and Advisory services include fees for advisory, intermediation and other auxiliary financial services including credit reference and analysis, portfolio research and advice, advice on mergers and acquisitions and on corporate restructuring and strategy. Arrangement/ management fees for Pvt. Placement of share/ equities are also to be included.
• Underwriting services include underwriting fees, earning from buying and reselling an entire or substantial portion of newly issued securities.
•Clearing and Settlement services include settlement and clearance services for financial assets, including securities, derivative products, and other negotiable instruments.
•Derivative, Stock, Securities, Foreign Exchange trading services include commissions, margin fees, etc. received for carrying out financial derivative transactions, placement services, and redemption fees. Earnings received on banks’ own account as well as on behalf of customers for carrying out foreign exchange trading has to be reported under this item. Explicit brokerage fees and commissions for foreign exchange brokerage services are also to be reported. Earnings received on banks’ own account for carrying out trading in derivative, stock, securities etc. should not be reported.
A technical Group on Statistics for International Trade in Banking Services (TG-SITBS) was set up by the Reserve Bank of India including members from Ministry of Finance, Ministry of Commerce and various departments (Department of Economics Analysis and Policy, Department of Banking Operations & Development and Department of Statistics and Information Management) of the Bank.
The TG-SITBS, after examining the different data sources available in the Reserve Bank, recommended collection of activity-wise international trade in services through annual surveys and suggested that initially the data may be collected on banking services from foreign banks operating in India and Indian banks having operations abroad. The TG-SITBS also recommended that a suitable questionnaire with explanatory notes should be prepared/framed in consultation with the banks and suggested for conducting annual survey for the financial year 2006-07 by June 2007. Accordingly, a survey schedule was prepared after detailed discussions with the major foreign banks operating in India and Indian banks functioning abroad.
The first survey on ‘International Trade in Banking Services’ was launched by the Bank in January 2008 and the findings based on the survey published in the monthly bulletin of January 2009.
Coverage
The questionnaire was forwarded to (i) all Indian banks having business abroad and (ii) all foreign bank branches operating in India. In all 12 Indian banks operating abroad and 27 foreign banks operating in India responded to the survey. 4 Indian banks opened their overseas representative offices furnished Nil return. Based on the response, the coverage of foreign banks in India in terms of total assets, credit extended and deposits received was around 99.9 per cent, 99.7 per cent and 99.9 per cent, respectively.
Coverage of the survey as at end-March 2008 |
(Rs. crore) |
Item |
Foreign Banks
operating in India* |
Foreign Banks
covered in the Survey |
Coverage
(%) |
Number of Reporting Banks |
28 |
27 |
|
Total assets |
364099 |
364019 |
99.9 |
Credit extended |
161133 |
160646 |
99.7 |
Deposits received |
191114 |
191015 |
99.9 |
* Source: Statistical Tables Relating to Banks in India. |
7. Information on total Income and Expenditure : (based on the operations of the branches in India):
(Amount in Rs’Thousand) |
During the financial year |
Total Income |
Total Expenditure |
2007-08 |
|
|
8. Information on Interest Income (based on the operations of the branches in India):
(Amount in Rs ‘Thousands) |
During the Period |
Interest received from |
Interest Expended to |
|
Resident |
Non-Resident |
Resident |
Non-Resident |
April-Jun’07 |
|
|
|
|
July-Sept’07 |
|
|
|
|
Oct-Dece’07 |
|
|
|
|
Jan-Mar’08 |
|
|
|
|
PART II: Information on Trade in Banking Services
9. Information on explicit fees and earnings [Please read the instructions before filing this information]
A. Deposit Account management services
(Amount in Rs’Thousand) |
During the Period |
Resident Entities |
Non-Resident |
April-Jun’07 |
|
|
July-Sept’07 |
|
|
Oct-Dece’07 |
|
|
Jan-Mar’08 |
|
|
B. Credit related services
(Amount in Rs’Thousand) |
During the Period |
Resident Entities |
Non-Resident |
April-Jun’07 |
|
|
July-Sept’07 |
|
|
Oct-Dece’07 |
|
|
Jan-Mar’08 |
|
|
C. Financial Leasing services
(Amount in Rs’Thousand) |
During the Period |
Resident Entities |
Non-Resident |
April-Jun’07 |
|
|
July-Sept’07 |
|
|
Oct-Dece’07 |
|
|
Jan-Mar’08 |
|
|
D. Trade finance related services
(Amount in Rs’Thousand) |
During the Period |
Resident Entities |
Non-Resident |
April-Jun’07 |
|
|
July-Sept’07 |
|
|
Oct-Dece’07 |
|
|
Jan-Mar’08 |
|
|
E. Payment and Money Transmission Services
(Amount in Rs’Thousand) |
During the Period |
Resident Entities |
Non-Resident |
April-Jun’07 |
|
|
July-Sept’07 |
|
|
Oct-Dece’07 |
|
|
Jan-Mar’08 |
|
|
F. Fund Management Services
(Amount in Rs’Thousand) |
During the Period |
Resident Entities |
Non-Resident |
April-Jun’07 |
|
|
July-Sept’07 |
|
|
Oct-Dece’07 |
|
|
Jan-Mar’08 |
|
|
G. Financial Consultancy and Advisory services
(Amount in Rs’Thousand) |
During the Period |
Resident Entities |
Non-Resident |
April-Jun’07 |
|
|
July-Sept’07 |
|
|
Oct-Dece’07 |
|
|
Jan-Mar’08 |
|
|
H. Underwriting services
(Amount in Rs’Thousand) |
During the Period |
Resident Entities |
Non-Resident |
April-Jun’07 |
|
|
July-Sept’07 |
|
|
Oct-Dece’07 |
|
|
Jan-Mar’08 |
|
|
I. Clearing and settlement services
(Amount in Rs’Thousand) |
During the Period |
Resident Entities |
Non-Resident |
April-Jun’07 |
|
|
July-Sept’07 |
|
|
Oct-Dece’07 |
|
|
Jan-Mar’08 |
|
|
J. Derivative, Stock, Securities, Foreign Exchange trading services
(Amount in Rs’Thousand) |
During the Period |
Resident Entities |
Non-Resident |
April-Jun’07 |
|
|
July-Sept’07 |
|
|
Oct-Dece’07 |
|
|
Jan-Mar’08 |
|
|
K. Other Financial Services
(Amount in Rs’Thousand) |
During the Period |
Resident Entities |
Non-Resident |
April-Jun’07 |
|
|
July-Sept’07 |
|
|
Oct-Dece’07 |
|
|
Jan-Mar’08 |
|
|
Part III: Comments if any in order to enhance the transparency on the methodology used for estimation on the data items provided in Part II
8. Information on outstanding Liabilities (Based on the country wise Balance sheet)
(Amount in ‘Thousands of Base Currency) |
Outstanding Position at the end of |
Resident |
Non Resident |
India |
Other Countries |
June ‘07 |
|
|
|
September ‘07 |
|
|
|
December ‘07 |
|
|
|
March ‘08 |
|
|
|
9. Information on outstanding Credit extended (Based on the operations of the bank in each country)
(Amount in ‘Thousands of Base Currency) |
Outstanding Position at the end of |
Resident |
Non Resident |
India |
Other Countries |
June ‘07 |
|
|
|
September ‘07 |
|
|
|
December ‘07 |
|
|
|
March ‘08 |
|
|
|
10. Information on outstanding Deposit received (Based on the operations of the bank in each country):
(Amount in ‘Thousands of Base Currency) |
Outstanding Position at the end of |
Resident |
Non Resident |
India |
Other Countries |
June ‘07 |
|
|
|
September ‘07 |
|
|
|
December ‘07 |
|
|
|
March ‘08 |
|
|
|
11. Information on total Income and Expenditure (Based on the country wise Balance sheet)
(Amount in ‘Thousands of Base Currency) |
Period |
Total Income |
Total Expenditure |
2007-08 |
|
|
12. Information on Interest income received (Based on the country wise Balance sheet):
(Amount in ‘Thousands of Base Currency) |
Period |
Resident |
Non Resident |
India |
Other Countries |
April-June ‘07 |
|
|
|
July-September ‘07 |
|
|
|
October-December ‘07 |
|
|
|
January-March ‘08 |
|
|
|
13. Information on Interest paid (Based on the country wise Balance sheet)
(Amount in ‘Thousands of Base Currency) |
Period |
Resident |
Non Resident |
India |
Other Countries |
April-June ‘07 |
|
|
|
July-September ‘07 |
|
|
|
October-December ‘07 |
|
|
|
January-March ‘08 |
|
|
|
Part II : Information on Trade in Banking Services
14. Information on Explicit fees and Income [Please read the instructions before filing this information]
A. Deposit Account management services
(Amount in ‘Thousands of Base Currency) |
Period |
Resident |
Non Resident |
India |
Other Countries |
April-June ‘07 |
|
|
|
July-September ‘07 |
|
|
|
October-December ‘07 |
|
|
|
January-March ‘08 |
|
|
|
B. Credit related services
(Amount in ‘Thousands of Base Currency) |
Period |
Resident |
Non Resident |
|
|
India |
Other Countries |
April-June ‘07 |
|
|
|
July-September ‘07 |
|
|
|
October-December ‘07 |
|
|
|
January-March ‘08 |
|
|
|
C. Financial Leasing services
(Amount in ‘Thousands of Base Currency) |
Period |
Resident |
Non Resident |
|
|
India |
Other Countries |
April-June ‘07 |
|
|
|
July-September ‘07 |
|
|
|
October-December ‘07 |
|
|
|
January-March ‘08 |
|
|
|
D. Trade finance related services
(Amount in ‘Thousands of Base Currency) |
Period |
Resident |
Non Resident |
|
|
India |
Other Countries |
April-June ‘07 |
|
|
|
July-September ‘07 |
|
|
|
October-December ‘07 |
|
|
|
January-March ‘08 |
|
|
|
E. Payment and Money Transmission Services
(Amount in ‘Thousands of Base Currency) |
Period |
Resident |
Non Resident |
|
|
India |
Other Countries |
April-June ‘07 |
|
|
|
July-September ‘07 |
|
|
|
October-December ‘07 |
|
|
|
January-March ‘08 |
|
|
|
F. Fund Management Services
(Amount in ‘Thousands of Base Currency) |
Period |
Resident |
Non Resident |
|
|
India |
Other Countries |
April-June ‘07 |
|
|
|
July-September ‘07 |
|
|
|
October-December ‘07 |
|
|
|
January-March ‘08 |
|
|
|
G. Financial Consultancy and Advisory services
(Amount in ‘Thousands of Base Currency) |
Period |
Resident |
Non Resident |
|
|
India |
Other Countries |
April-June ‘07 |
|
|
|
July-September ‘07 |
|
|
|
October-December ‘07 |
|
|
|
January-March ‘08 |
|
|
|
H. Underwriting services
(Amount in ‘Thousands of Base Currency) |
Period |
Resident |
Non Resident |
|
|
India |
Other Countries |
April-June ‘07 |
|
|
|
July-September ‘07 |
|
|
|
October-December ‘07 |
|
|
|
January-March ‘08 |
|
|
|
I. Clearing and settlement services
(Amount in ‘Thousands of Base Currency) |
Period |
Resident |
Non Resident |
|
|
India |
Other Countries |
April-June ‘07 |
|
|
|
July-September ‘07 |
|
|
|
October-December ‘07 |
|
|
|
January-March ‘08 |
|
|
|
J. Derivative, Stock, Securities, Foreign Exchange trading services
(Amount in ‘Thousands of Base Currency) |
Period |
Resident |
Non Resident |
|
|
India |
Other Countries |
April-June ‘07 |
|
|
|
July-September ‘07 |
|
|
|
October-December ‘07 |
|
|
|
January-March ‘08 |
|
|
|
K. Other Financial Services
(Amount in ‘Thousands of Base Currency) |
Period |
Resident |
Non Resident |
|
|
India |
Other Countries |
April-June ‘07 |
|
|
|
July-September ‘07 |
|
|
|
October-December ‘07 |
|
|
|
January-March ‘08 |
|
|
|
Part III. Comments if any, in order to enhance the transparency on the methodology used for estimation on the data items provided in Part II
* Prepared in the Balance of Payments Statistics Division, Department of Statistics and Information Management. The previous article on the subject for the period 2006-07 was published in January 2009 issue of the Bulletin.
* Table 1.5 of Statistical Table Relating to Banks in India 2007-08
** Table 1.1 of Statistical Table Relating to Banks in India 2007-08 |