
International Trade in Banking Services, 2008-09* - RBI - Reserve Bank of India


International Trade in Banking Services, 2008-09*
International Trade in Banking Services, 2008-09* Highlights The survey on International Trade in Banking Services (ITBS) for 2008-09 was conducted in continuation of earlier surveys for 2006-07 and 2007-08 to obtain the consistent and comparable data on international trade in banking services. The coverage extends to 134 overseas branches, 99 overseas subsidiaries of 14 Indian banks and 289 branches of 29 foreign banks operating in India. The services are captured based on the explicit and implicit fees or commission charged to the customers for financial auxiliaries services rendered by the banks. The services covered in the survey are (i) deposit account management services, (ii) credit related services, (iii) financial leasing services, (iv) trade finance related services, (v) payment and money transmission services, (vi) fund management services, (vii) financial consultancy and advisory services, (viii) underwriting services, (ix) clearing and settlement services and (x) derivative, stock, securities and foreign exchange trading services. Results of the survey revealed that Indian banks’ branches operating overseas were lagging behind in generating income by rendering trade in banking services compared to foreign banks operating in India. It was also observed that Indian banks’ branches operating abroad generated major share of fee income by rendering credit-related services and trade finance-related services, whereas foreign banks in India generated major share of fee income by rendering derivative, stock, securities and foreign exchange trading services. Introduction The ongoing negotiations for liberalising the financial services sector under the World Trade Organisation (WTO) as a part of General Agreement on Trade in Services (GATS), inter alia, necessitated the need of comparable data on International Trade in Banking Services. The survey results make available the basic information on trade in banking services in India. The current survey is an effort in meeting comparable database of international standards for policy decisions in continuation of surveys on International Trade in Banking Services conducted in January 2008 and September 2008 for 2006-07 and 2007-08, respectively. This article is based on the survey launched in November 2009 and covers data for 2008- 09. The primary objective of the survey is to collect disaggregated information relating to various banking services rendered by the overseas branches and subsidiaries of Indian banks as well as the banking services rendered by the foreign bank branches operating in India. According to the Manual on Statistics of International Trade in Services 2010, Foreign Affiliates Statistics (FATS) should cover the services rendered by branches as well as subsidiaries. In the earlier articles on International Trade in Banking Services, published in January 2009 and November 2009, the combined data on International Trade in Banking Services for branches as well as subsidiaries of Indian banks operating outside India were published. In order to provide information at micro-level, the disaggregated data on International Trade in Banking Services for branches as well as subsidiaries of Indian banks operating outside India are presented separately. Methodology adopted for conduct of the survey and coverage are presented in Annex I. A copy of the survey schedule is given in Annex II. The article is organised into six sections. The distribution of branches/subsidiaries/ associates of Indian banks abroad and foreign banks in India is presented in Section I. Section II examines the business growth of Indian banks abroad and foreign banks in India. The trend in profitability of Indian banks and foreign banks is discussed in Section III. Section IV examines the trade in banking services of Indian banks abroad and foreign banks in India. Section V presents a disaggregated activity-wise analysis. A summary of conclusions drawn, based on this survey, is presented in Section VI. Section I Of total 138* branches/offices of Indian banks operating abroad in 29 countries as at end March 2009, banks furnished data for 134 Indian overseas branches operating in 28 countries on International Trade in Banking Services. Of 295** foreign bank branches operating in India as at end March 2009, the survey covered 289 branches of foreign banks. Along with the branches, Indian banks operating abroad also furnished data for their 99 overseas subsidiaries and 73 overseas associates. A subsidiary is a direct investment enterprise over which direct investor is able to exercise control. The control is determined to exist if the investor has more than 50 per cent equity in the enterprise investment. An associate is a direct investment enterprise over which the direct investor is able to exercise a significant degree of influence, but not control. A significance degree of influence is determined to exist if the direct investor owns from 10 to 50 per cent of the equity shares in the investment enterprise. Bank of Baroda had the largest overseas presence with 46 branches in 14 countries, followed by State Bank of India (37 branches in 18 countries) and Bank of India (23 branches in 11 countries). The United Kingdom was having the highest number of Indian banks’ (24), followed by Hong Kong (15), Singapore (12), Fiji (9), United Arab Emirates (9), Mauritius (8) branches and Sri Lanka (7). Employment The details of number of employees employed in various branches, subsidiaries and associates of Indian banks operating abroad and foreign banks operating in India are given in Table 1, 2 and 3, respectively. Employees of foreign banks operating in India contracted by 1.1 per cent in 2008-09 over previous year whereas there was an increase of 11.0 per cent in the number of employees in branches of Indian banks operating outside India in 2008-09. The foreign banks operating in India deployed 99.7 per cent local employees of their total employees from local sources while the Indian banks operating abroad employed 68.7 per cent of employees from local sources, 28.8 per cent from India and remaining 2.5 per cent from other countries in 2008-09. A significant growth was observed in the number of employees in the subsidiaries and the associates of Indian banks operating abroad in 2008-09 compared to 2007-08 mainly due to increase in number of the subsidiaries and the associates. The subsidiaries of Indian banks overseas deployed 78.3 per cent of their total employees from local sources, 20.2 per cent from India and remaining 1.5 per cent from other countries whereas 97.7 per cent employees in associates of Indian banks outside India were local and 2.3 per cent from India in 2008-09. ____________ * Table 1.5 of Statistical Tables Relating to Banks in India 2008-09. Section II The assets/liabilities of Indian banks’ overseas branches increased by 57.8 per cent in 2008-09 as compared to 14.5 per cent in the previous year (Table 4). The credit extended and deposits mobilised recorded a significant growth of 57.5 per cent and 81.4 per cent compared to 41.3 per cent and 22.8 per cent, respectively, in the previous year. The growth in asset/liabilities of subsidiaries of Indian banks outside India was at 25.8 per cent in 2008-09 in contrast to a contraction of 7.1 per cent in the previous year (Table 5). The credit extended and deposits mobilised by the Indian banks’ subsidiaries operating abroad increased substantially by 102.6 per cent and 31.7 per cent in the period under review. This sharp growth in assets/liabilities, credit extended and deposit mobilised of the Indian banks operating abroad might be attributed to two reasons-firstly, depreciation of Indian rupee compared to major currencies in March 2009 as compared to March 2008 and secondly, increase in the number of branches/ subsidiaries of Indian banks operating outside India in 2009. The share of credit in total assets of Indian banks’ branches operating abroad remained at 63.1 per cent compared to 57.6 per cent in case of subsidiaries of Indian banks operating abroad at end-March 2009. However, the share of deposits mobilised in total liabilities of Indian banks’ branches and subsidiaries was at 40.3 per cent and 66.7 per cent respectively, as at end -March 2009. The shares of business (credit extended and deposits mobilised) in total assets/ liabilities of overseas branches of Indian banks which was at 98.2 per cent as at end - March 2008 increased to 103.4 per cent as at end-March 2009. In the case of overseas subsidiaries of Indian banks, the share of business in total assets/liabilities increased to 124.2 per cent as at end-March 2009 from 99.4 per cent a year ago. The total assets/ liabilities of branches and subsidiaries of Indian banks operating outside India increased sharply to `4,21,746 crore as at end -March 2009 from `2,79,300 crore as at end- March 2008 resulting a growth of 51.0 per cent. Their share of credit in total asset and deposit in total liabilities increased marginally by 62.0 per cent and 44.9 per cent respectively, over the previous period. Foreign Banks’ Share in Indian Banking Business The share of foreign banks’ assets in total assets of Scheduled Commercial Banks (SCBs) remained at 8.5 per cent as at end- March 2009.Their share in credit declined to 5.5 per cent as at end-March 2009 as compared to 6.5 per cent as at end-March 2008 and also the deposits to 5.3 per cent from 5.8 per cent in the corresponding period. The share of foreign banks’ income in total income of SCBs increased marginally from 9.5 per cent to 9.8 per cent during the period under review, mainly due to increase in share of non-interest income (from 17.5 per cent to 19.8 per cent). The total assets / liabilities of foreign banks operating in India grew by 22.8 per cent as at end-March 2009. The deposit growth was higher at 12.0 per cent while the credit grew at 3.0 per cent at end-March 2009. Section III The total income of Indian banks’ branches operating abroad amounting to `16,739 crore, registered a growth of 27.7 per cent in 2008-09 (Table 7) as against 29.4 per cent growth in the income of foreign banks operating in India. The total interest income of Indian banks’ branches operating abroad exceeded their total income by `318 crore indicating a loss in non-interest income. The growth of interest income of foreign banks was lower at 23.3 per cent compared to total income (29.4 per cent) in 2008-09 showing that the non-interest income increased at a higher rate. In the case of Indian banks’ branches operating abroad, the non-interest income indicated a loss of `318 crore for Indian banks’ branches operating overseas in contrast to non-interest income of `14,890 crore in case of foreign banks’ branches in India in 2008-09. Further, the interest expenses of Indian banks’ overseas branches was higher at `13,030 crore compared to `12,811 crore of foreign banks operating in India in the same period.
Income and Expenditure of subsidiaries of Indian banks operating outside India grew at 61.2 per cent and 53.6 per cent, respectively, in 2008-09 (Table 8). The growth of interest income/expenses of subsidiaries of Indian banks was comparatively low, reflecting higher growth in their non-interest income as well as noninterest expenses. The total income and total expenditure of Indian banks (branches and subsidiaries) operating outside India increased by 33.8 per cent and 56.7 per cent, respectively, in 2008-09 over previous year. The profitability ratios, viz., income to total assets, net profits to total income and net profits to total assets of the Indian banks’ branches operating outside India declined to 4.8 per cent, 1.3 per cent and 0.1 per cent in 2008-09 from 6.0 per cent, 20.1 per cent and 1.2 per cent, respectively, in the preceding year (Table 9). The total income to total assets of foreign banks operating in India was at 10.1 per cent, net profits to total income at 27.8 per cent and net profits to total assets at 2.8 per cent in 2008-09.
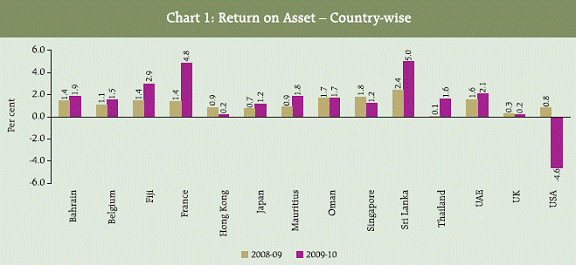
The profitability ratios, viz., income to total assets, net profits to total income and net profits to total assets of subsidiaries of Indian banks operating abroad was at 6.3 per cent, 9.7 per cent and 0.6 per cent, respectively, in 2008-09 (Table10). Country-wise Profitability of Indian Banks’ Branches Operating Abroad Country-wise return on assets, i.e., net profit to total assets of Indian banks operating abroad is presented in Chart 1. The return on assets of Indian banks operating in Sri Lanka was the highest at 5.0 per cent in 2008-09, followed by France (4.8 per cent) and Fiji (2.9 per cent). It was observed that return on assets of Indian banks’ overseas branches improved in 2008-09 over the preceding year in case of Bahrain, Belgium, Fiji, France, Japan, Mauritius, Thailand and UAE and declined in case of Hong Kong, Singapore, the UK and the USA. Due to financial turmoil in the USA, there was a negative return on assets (- 4.6 per cent) in 2008-09 compared to 0.8 per cent return in 2007-08.
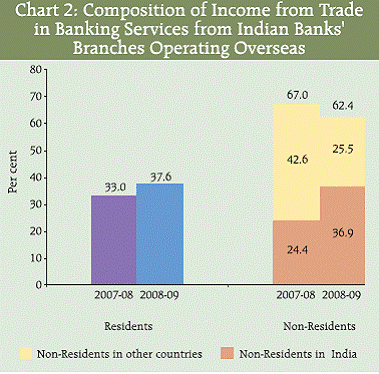
Section IV According to the Manual on Statistics of International Trade in Services 2010, the disaggregated data on services rendered by overseas branches and subsidiaries of Indian banks are presented in this section. The trade in banking services extended was captured based on explicit and implicit fees or commissions charged to the customers for various services rendered by the branches and subsidiaries of Indian banks operating abroad. In this survey, the financial services provided by the banks were classified into eleven major groups. These services cover deposit account management services, credit-related services, financial leasing services, trade finance related services, payment and money transmission services, fund management services, financial consultancy and advisory services, underwriting services, clearing and settlement services, ‘derivative, stock, securities, foreign exchange trading services’ and other financial services. Further details are given in Annex I. Activity-wise Trade in Banking Services Indian Banks’ Overseas Branches The fee income generated by rendering trade in banking services by the Indian banks’ branches operating abroad increased by 2.1 per cent to `3,012 crore in 2008-09 from `2,951 crore in 2007-08. Among various banking services, fee income generated by Deposit account management services, Trade finance related services and Payment and money transmission services recorded significant growth in 2008-09 over 2007-08 (Table 11). There was a decline in the income generated by way of credit related services (22.3 per cent), financial consultancy and advisory services (38.4 per cent), clearing and settlement services (2.6 per cent), derivative, stock, securities, foreign exchange trading services (42.9 per cent) and other financial services (89.1 per cent) in 2008-09 compared to the previous year. None of the overseas branch as of Indian banks generated any fee income from financial leasing services and underwriting services in 2008-09. Indian Banks’ Overseas Subsidiaries Subsidiaries of Indian banks operating abroad registered a remarkable growth of 140.1 per cent in the fee income generated by rendering trade in banking services in 2008-09 over previous year (Table 12). As in the case of Indian banks’ branches, subsidiaries of Indian banks operating abroad also generated most of their fee income by rendering services like credit related services and trade finance related services. In addition, subsidiaries of Indian banks operating abroad also render ‘financial consultancy and advisory services’ and other financial services as a major services. Indian banks (branches and subsidiaries) operating abroad generated major share of their fee income by rendering credit related services, trade finance related services, deposit account management services, ‘payment and money transmission services’ and ‘financial consultancy and advisory services’. The fee income generated by Indian banks (branches and subsidiaries) operating in other countries increased by 22.7 per cent in 2008-09 over 2007-08. Trade in Banking Services by Indian Banks Operating Abroad – Residents and Non-Residents Indian Banks’ Overseas Branches The fee income generated through banking services to residents increased to `1,132 crore in 2008-09 from `975 crore in 2007-08, being one-third of total fee-based income (Table 13). The fee income generated by rendering the banking services to residents grew at higher rate than from the services to non-residents. The share of fee income derived from residents increased marginally in 2008-09 (37.6 per cent) as compared to the previous year (33.0 per cent), while the share of fee income from non-residents decreased correspondingly (Chart 2). However, the share of fee income from non-residents (in India) improved and constituted 36.9 per cent of total fee income in 2008-09 as compared to 24.4 per cent in the previous year. In contrast, the fee income generated from non-residents of other countries declined and accounted for 25.5 per cent to total fee-based income in 2008-09 compared to 42.6 per cent in 2007-08.
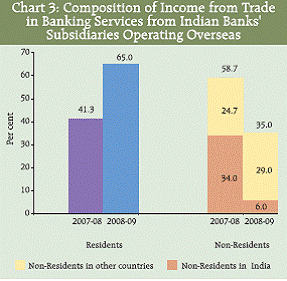
Indian Banks’ Overseas Subsidiaries The subsidiaries of Indian banks operating outside India generated twothirds of their total fee income from residents while Indian banks’ branches operating outside India generated twothirds of their total income by rendering service to non-residents in 2008-09. The fee income of subsidiaries of Indian banks operating outside India from residents recorded four fold increases in 2008-09 over the previous year. Among non-residents, Indian banks subsidiaries generated 29.0 per cent of their fee income by rendering services to non-residents in other countries while branches of Indian banks received 25.5 per cent of their fee income from nonresidents in India (Chart 2 & 3). The Indian banks (branches and subsidiaries) operating abroad, in total, generated 54.4 per cent of their fee income by rendering services to non-residents and remaining 45.6 per cent from residents, in 2008-09.
Country-wise Trade in Banking Services – Indian Banks’ Branches and Subsidiaries Operating Abroad Bahrain, the UK, Singapore, the US, Hong Kong, the UAE, Belgium, Japan and Sri Lanka were the major countries which accounted together for 89.3 per cent to total trade in banking services of the branches of Indian banks operating abroad in 2008-09 (Table 15). Bahrain had the largest share at 19.6 per cent in total fee income generated from trade in banking services, followed by the UK (16.4 per cent), Singapore (14.5 per cent), the US (12.6 per cent) and Hong Kong (11.8 per cent) in 2008-09. The UK, Botswana, Canada and Russia were the major countries which accounted for 94.5 per cent to total trade in banking services of the subsidiaries of the Indian banks operating abroad in 2008-09 (Table 16). Accrual of Amounts to India due to Fee Income Generated through Trade in Banking Services The amount accrued to India by Indian banks’ operations in various countries was at `4,255 crore in 2008-09. Of which, `3,012 crore (70.8 per cent) fee income was generated by 134 branches of Indian banks operating outside India and remaining `1,243 crore (29.2 per cent) by 99 subsidiaries of Indian banks operating abroad.
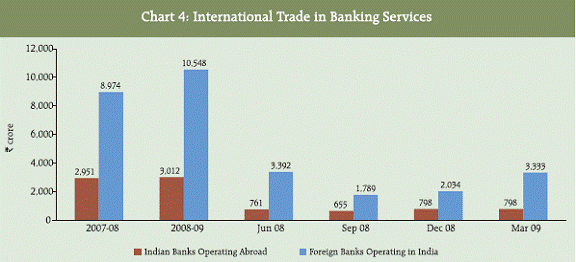
Section V A comparative analysis revealed that foreign banks branches operating in India were ahead of overseas Indian banks branches in generating fee income from providing the services. The total fee income generated by 289 branches of the foreign banks operating in India was `10,548 crore whereas 134 overseas branches of the Indian banks generated only `3,012 crore in 2008-09 (Chart 4). Comparison of Trade in Banking Services - Activity-wise Indian banks operating abroad generated major share of fee income by rendering services activity viz., credit related services, trade finance related services, payment and money transmission services and ‘derivative, stock, securities, foreign exchange trading services’ together accounted for 93.0 per cent of total services whereas in the case of foreign banks operating in India ‘derivative, stock, securities, foreign exchange trading services’, trade finance related services, ‘financial consultancy and advisory Services’ and credit related ser vices together accounted for 70.9 per cent share to total trade in banking services in 2008- 09. The share of payment and money transmission services in total fee income, for Indian banks as well as for foreign banks, increased marginally in 2008-09 (Table 18). In case of Indian banks operating outside India, the share of trade finance related services increased to 40.3 per cent in 2008-09 from 16.4 per cent in previous period whereas their share in credit related services decreased to 39.2 per cent from 51.5 per cent in the corresponding period. Indian banks operating abroad had not derived any fee income by rendering financial leasing services during the period under study, i.e., 2007-08 and 2008-09.
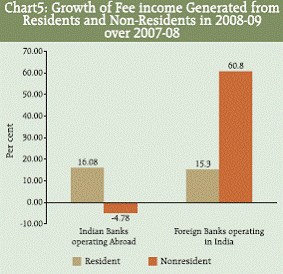
Composition of Trade in Banking Services According to Residents and Non- Residents A notable contrast in generation of fee income from residents and non-residents was observed between Indian banks operating abroad and foreign banks operating in India (Table 19). The overseas branches of Indian banks derived major share of fee income (62.4 per cent) by making available services to nonresidents while foreign banks operating in India generated 6.7 per cent in 2008-09. Foreign banks operating in India generated 93.3 per cent of fee income by rendering banking services to residents compared to 37.6 per cent by Indian banks’ overseas branches in 2008-09.
The reason for contraction of fee income (4.78 per cent) generate by Indian banks’ overseas branches from non-residents is mainly due to negative growth in the services provided to countries other than India in 2008-09. A decline in fee income from non-residents by Indian banks operating outside India may be due to the financial problems in the global market.
Comparison of Accrual of Amounts to India and Abroad by Rendering Trade in Banking Services The amount accrued to India by operations of 134 branches of Indian banks in 28 countries was at `3,012 crore in 2008-09 compared to `10,548 crore to other countries (excluding India) by their banks’ branches operating in India. The amount accrued to India was more than the amount accrued to foreign countries like Bahrain, Bangladesh, Belgium, Japan, Singapore, Sri Lanka, the UAE etc., during 2008-09, whereas the amount accrued to other countries was higher than the amount accrued to India in case of the USA, the UK, Hong Kong, Germany, Oman, France etc. Further, the fee income generated by 47 branches of Hong Kong-based banks operating in India was `2,504 crore whereas 15 branches of Indian banks operating in Hong Kong was just `355 crore in 2008-09. Similarly, there were 95 branches of UK originating banks operating in India with fee income of `2,115 crore as compared with `495 crore emanating from 24 branches of Indian originating banks operating in UK. As compared to 47 branches of the US-based banks operating in India with a fee income of `3,962 crore, Indian banks operating in the US through their 4 branches could generate ` 380 crore in 2008-09.
A survey on international trade in banking services was conducted among foreign banks operating in India and Indian banks having presence abroad. In all, 134 branches and 99 subsidiaries of 14 Indian banks operating abroad and 289 branches of 29 foreign banks operating in India had responded to the survey. The UK was having the highest number of Indian banks’ branches (24 of five Indian banks), followed by Hong Kong (15), Singapore (12), Fiji (9), the UAE (9) Mauritius (8), and Sri Lanka (7). The foreign banks operating in India employed 99.7 per cent of their employees from locally available sources while the Indian banks’ branches operating abroad recruited 68.7 per cent of employees from local sources. The subsidiaries of Indian banks operating outside India employed 78.3 per cent of their employees from local sources. The amount accrued to India by Indian banks’ operations in various countries was at `4,255 crore in 2008-09. Out of `4,255 crore, `3,012 crore (70.8 per cent) fee income was generated by 134 branches of Indian banks operating outside India and remaining `1,243 crore (29.2 per cent) belongs to 99 subsidiaries of Indian banks operating abroad. Further, the fee income generated by the Indian banks’ branches operating abroad increased by 2.1 per cent from `2,950 crore in 2007-08 to `3,012 crore in 2008-09, of which 93.0 per cent of fee income was by rendering banking services like credit related services, trade finance related services, derivative, stock, securities, foreign exchange trading services and payment & money transmission services. In contrast to a small growth of 2.1 per cent by Indian banks branches operating outside India, a sharp growth of 140.1 per cent has been observed in the fee income generated by rendering trade in banking services by subsidiaries of Indian banks operating abroad in 2008-09. A comparative analysis between the branches of Indian banks operating abroad and foreign banks operating in India revealed that during 2008-09, the total fee income generated by the foreign banks operating in India, by rendering banking services was significantly higher at `10,548 crore than that of Indian banks’ branches operating abroad which generated only `3,012 crore of fee income. Indian banks generated major share of fee income by rendering banking services to non-residents while foreign banks generated major share of fee from residents. Foreign banks operating in India generated 93.3 per cent of fee income by rendering banking services to residents during 2008-09. Bahrain, the UK, the USA, Hong Kong, the UAE, Belgium, and Japan were the major countries having witnessed not only the significant share in trade in banking services by the Indian banks but also had seen significant growth in trade in banking services in 2008-09 over 2007-08. The fee income generated by 47 branches of Hong Kong based banks operating in India was `2,503 crore in 2008-09 compared to the fee income at `355 crore of 15 branches of Indian banks operating in Hong Kong. Financial services, particularly banking services, play an important role in promoting global, regional and bilateral economic integration. Banking services includes acceptance of deposits and lending (the core banking services), and the other financial services (para-banking services) like payment services, securities trading, asset management, financial advice, settlement and clearing service, etc. With the improvements in economic integration of financial markets and activities, the international trade in banking services has significantly increased. The GATS framework envisages that the delivery of any commercial services can be through four different modes viz., Mode 1 –cross border service, Mode 2 – Consumption abroad, Mode 3 – commercial presence and Mode 4 – movement of natural persons. In Mode 3, the bank has a commercial presence in the territory of the service-importing country and the service is delivered therein. The commercial presence can be through various investment vehicles like representative offices, branches, subsidiaries, associates and correspondents. Banking services covered in this survey includes financial auxiliary services such as (i) deposit account management services, (ii) credit related services, (iii) financial leasing services, (iv) trade finance related services, (v) payment and money transmission services, (vi) fund management services, (vii) financial consultancy and advisory services, (viii) underwriting services, (ix) clearing and settlement services, and (x) derivative, stock, securities and foreign exchange trading services. While carrying out the banking business, banks cater to the financial services need of the residents of the country of operation as well as non-residents of that country. Keeping this in view, the survey also collected the information with bifurcation of financial services rendered to residents and nonresidents separately. Details of Services Covered are :
A Technical Group on Statistics for International Trade in Banking Services (TGSITBS) was set up by the Reserve Bank of India including members from Ministry of Finance, Ministry of Commerce and various departments (Department of Economics and Policy Reasearch, Department of Banking Operations & Development and Department of Statistics and Information Management) of the Bank. The TG-SITBS, after examining the different data sources available in the Reserve Bank, recommended collection of activity-wise international trade in services through annual surveys and suggested that initially the data may be collected on banking services from foreign banks operating in India and Indian banks having operations abroad. The TG-SITBS also recommended that a suitable questionnaire with explanatory notes should be prepared/ framed in consultation with the banks and suggested for conducting annual survey for the financial year 2006-07 by June 2007. Accordingly, a survey schedule was prepared after detailed discussions with the major foreign banks operating in India and Indian banks functioning abroad. The two surveys on ‘International Trade in Banking Services’ were launched by the Bank in January 2008 and September 2008 and the findings based on these surveys were published in the monthly bulletin of January 2009 and November 2009 respectively. Coverage The questionnaire was forwarded to (i) all Indian banks having business abroad and (ii) all foreign bank branches operating in India. In all, 14 Indian banks operating abroad and 29 foreign banks operating in India responded to the survey. Based on the response, the coverage of foreign banks in India in terms of total assets, credit extended and deposits received was around 99.95 per cent, 99.99 per cent and 99.95 per cent, respectively.
* Prepared in the Balance of Payments Statistics Division, Department of Statistics and Information Management. The previous article on the subject for the period 2007-08 was published in November 2009 issue of the Bulletin. |
||||||||||||||||||||||||||||||||||||||||||||||||||||||||||||||||||||||||||||||||||||||||||||||||||||||||||||||||||||||||||||||||||||||||||||||||||||||||||||||||||||||||||||||||||||||||||||||||||||||||||||||||||||||||||||||||||||||||||||||||||||||||||||||||||||||||||||||||||||||||||||||||||||||||||||||||||||||||||||||||||||||||||||||||||||||||||||||||||||||||||||||||||||||||||||||||||||||||||||||||||||||||||||||||||||||||||||||||||||||||||||||||||||||||||||||||||||||||||||||||||||||||||||||||||||||||||||||||||||||||||||||||||||||||||||||||||||||||||||||||||||||||||||||||||||||||||||||||||||||||||||||||||||||||||||||||||||||||||||||||||||||||||||||||||||||||||||||||||||||||||||||||||||||||||||||||||||||||||||||||||||||||||||||||||||||||||||||||||||||||||||||||||||||||||||||||||||||||||||||||||||||||||||||||||||||||||||||

Share this page:


Install the RBI mobile application and get quick access to the latest news!


