
Notes on Tables - RBI - Reserve Bank of India


Notes on Tables
Table No. 1
Table No. 2 The gold reserves of Issue Department were valued at Rs.84.39 per 10 grams up to October 16, 1990 and from October 17, 1990 they are valued close to international market prices. 1. Includes Government of India one rupee notes issued from July 1940. Table Nos. 3 & 4 The expression ‘Banking System’ or ‘Banks’ means (a) State Bank of India and its associates (b) Nationalised Banks (c) Banking companies as defined in clause ‘C’ of Section 5 of the Banking Regulation Act, 1949 (d) Co-operative banks (as far as scheduled co-operative banks are concerned) (e) Regional Rural Banks and (f) any other financial institution notified by the Central Government in this regard. 1. Excludes borrowings of any scheduled state co-operative bank from the State Government and any Reserve Fund deposit required to be maintained with such bank by any co-operative society within the area of operation of such bank. Table No. 6
Table No. 7 With a view to enable the banks to meet any unanticipated additional demand for liquidity in the context of the century date change, a ‘Special Liquidity Support’ (SLS) facility was made available to all scheduled commercial banks (excluding RRBs) for a temporary period from December 1, 1999 to January 31, 2000. 1. With effect from April 13,1996, banks are provided export credit refinance against their rupee export credit and post-shipment export credit denominated in U.S. Dollars taken together. Table No. 8 (a) The data includes cheque clearing for both i.e. clearing houses managed by Reserve Bank of India and clearing houses managed by other banks. Paper based inter-bank clearing has been discontinued at all the centres, the last June, 2005. The other MICR Centres are Agra, Allahabad, Amritsar, Aurangabad, Baroda, Belgaum, Bhilwara, Coimbatore, Cuttak, Dehradun, Ernakulum, Erode, Gorakhpur, Gwalior, Hubli, Indore ,Jabalpur, Jalandhar, Jamshedpur, Jammu, Jodhpur, Kolhapur, Kozhikode, Kota, Lucknow, Ludhiana, Madurai, Mangalore, Mysore, Nasik, Panaji, Pondicherry, Pune, Raipur, Rajkot, Ranchi, Salem, Sholapur, Surat, Thiruchirapalli, Tirupur, Thrissur, Tirunelveli, Udaipur, Varanasi, Vijayawada and Vishakhapatnam. (b) Graphs: The graphs 3 and 4 on Paper and Electronic payments - the Electronic Payment System data include Retail Electronic Payment Systems, RTGS (customer and inter-bank) and CCIL operated systems. (c) Non MICR Data pertains to the Clearing Houses managed by 10 banks namely SBI (713), SBBJ (69), SB Indore (27), PNB (8), SBT (69), SBP (63), SBH (50), SBM (45), Jammu and Kashmir (1) and United Bank of India (6). (Figures in bracket indicate Non MICR Cheque Clearing Houses managed by the bank.) (d) The other MICR Centres includes 47 centres managed by 13 PSBs namely Andhra Bank, Bank of Baroda, Bank of India, Canara Bank, Central Bank of India, Corporation Bank, Oriental Bank of Commerce, Punjab National Bank, State Bank of India, State Bank of Indore, State Bank of Travancore, State Bank of Hyderabad and Union Bank of India. Table No. 9A The data pertains to retail electronic payment. Table No. 9B The data pertains to Large Value Payment Systems. The figures for CCIL, the operations pertains to selected services, are taken from the CCIL published data. Table No. 10 (a) For details of money stock measures according to the revised series, reference may be made to January 1977 issue of this Bulletin (pages 70-134). 1. Net of return of about Rs.43 crore of Indian notes from Pakistan upto April 1985. Table Nos. 11 & 13 (a) On the establishment of National Bank for Agriculture and Rural Development (NABARD), on July 12, 1982, certain assets and liabilities of the Reserve Bank were transferred to NABARD, necessitating some reclassification of aggregates in the sources of money stock from that date.
Table No. 11A The conceptual basis of the compilation of the Commercial Bank Survey are available in the report of the Working Group on Money Supply: Analytics and Methodology of Compilation (Chairman: Dr. Y.V. Reddy), RBI Bulletin, July 1998, which recommended changes in the reporting system of commercial banks and the article entitled “New Monetary Aggregates: An Introduction”, RBI Bulletin, October 1999.
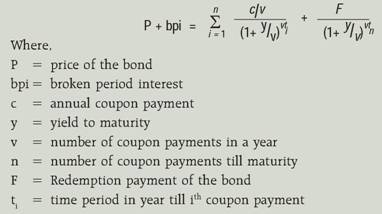
Table No. 11B The conceptual basis of the compilation of new monetary aggregates are available in the report of the Working Group on Money Supply: Analytics and Methodology of Compilation (Chairman: Dr. Y.V. Reddy), RBI Bulletin, July 1998. A link series between the old and present monetary series has been published in the article entitled “New Monetary Aggregates: An Introduction”, RBI Bulletin, October 1999. (1) NM2 and NM3 : Based on the residency concept and hence does not directly reckon non-resident foreign currency repatriable fixed deposits in the form of FCNR(B) deposits, Resurgent India Bonds (RIBs) and India Millennium Deposits (IMDs). (2) NM2 : This includes M and residents’ short-term time deposits (including and up to the contractual maturity of one year) with commercial banks. (3) Domestic Credit : Consistent with the new definition of bank credit which includes investments of banks in non-SLR securities, comprising of commercial paper, shares and bonds issued by the public sector undertakings, private sector and public financial institutions and net lending to primary dealers in the call/term money market. The RBI’s loans and advances to NABARD would be included in the RBI credit to commercial sector. Other components such as credit to Government, investments in other approved securities and conventional bank credit remain unchanged. (4) Net Foreign Assets of The Banking Sector : It comprises the RBI’s net foreign assets and scheduled commercial banks’ net foreign currency assets (refer to note 4 of Table 11A). (5) Capital Account : It consists of paid-up capital and reserves. Table No. 11C The conceptual basis of the compilation of the Reserve Bank Survey is given in the report of the Working Group on Money Supply: Analytics and Methodology of Compilation (Chairman: Dr. Y.V. Reddy), RBI Bulletin, July 1998 and the article “New Monetary Aggregates: An Introduction”, RBI Bulletin, October 1999. The components of reserve money (to be referred as M ) remain unchanged. On the sources side, the RBI’s refinance to the National Bank for Agriculture and Rural Development (NABARD), which was hitherto part of RBI’s claims on banks has been classified as part of RBI credit to commercial sector. The Reserve Bank’s net non-monetary liabilities are classified into capital account (comprising capital and reserves) and other items (net). Table No. 12 Please see item (c) of notes to Table 10. Table No. 26C (a) Month-end yields for different integer valued residual maturities are estimated using interpolation technique on weighted average yields of select indicative securities derived from SGL transactions data on government securities observed during a select month-end day. Yield corresponding to each transaction in a security is calculated from the following Yield to Maturity (YTM) and price relationship.
(b) The weighted average yield corresponding to each traded security on that particular day is calculated from the yields of all transactions on that security using amount (Face Value) traded as the weights. (c) Broken period (number of days) is based on day count convention of 30 days a month and 360 days a year. Table Nos. 28 & 29 Table 28 presents Index Numbers of Industrial Production (Sectoral and Use-based Classification). Due to revision of the indices of the mining sector and also the deletion of four items, viz., radio receivers, photosensitised paper, chassis (assembly) for HCVs (bus, truck) and engines from the item–basket of the manufacturing sector, the IIP data have been revised from 1994-95 onwards. This has also resulted in the change in redistribution of weights in use-based classification of IIP. Table 29 contains data on manufacturing sector at two digit level of 17 groups along with general index and sectoral indices, viz., Mining and Quarrying, Manufacturing and Electricity. Table No. 30 (a) Figures exclude data on private placement and offer for sale but include amounts raised by private financial institutions. Table No. 34 The ban on forward trading in gold and silver, effective November 14, 1962 and January 10, 1963, has been lifted with effect from April 1, 2003. (1) In case Friday is a holiday, prices relate to the preceding working day. Table No. 35 Annual data relate to average of the months April to March.
Table No. 36 Annual data relate to average of the months April to March. The new series of index numbers with base 1984-85=100 was introduced from November 1987. (1) Based on indices relating to 59 centres. Table No. 37 Annual data relate to the average of the months July to June.
Table Nos. 38 The new series of index numbers with base 1993-94=100 was introduced in April 2000. Details regarding the scope and coverage of new series are published in June 2000 issue of the Bulletin. As per the press release dated October 19, 2009 of the Cabinet Committee of Economic Affairs (CCEA), Government of India, the weekly release of WPI will cover only the ‘Primary Articles’ and the ‘Fuel, Power, Light & Lubricants’ groups. Now on, the WPI for ‘All commodities’ and ‘Manufactured Products’ will be released only on a monthly basis. Since the weekly data will no longer be available for ‘All Commodities’ and the ‘Manufactured Products’, final Monthly average data will not be published August 2009 onwards. The monthly data in the Bulletin up to July 2009 are averages of weekly data and August 2009 onwards data are on a monthly basis. Table No. 39 (a) The foreign trade data relate to total sea, air and land trade, on private and government accounts. Exports are on f.o.b. basis and imports are on c.i.f. basis. Exports include re-exports of foreign merchandise previously imported to India and imports relate to foreign merchandise whether intended for home consumption, bonding or re-exportation. Direct transit trade, transshipment trade, passengers baggage, ship’s stores, defence goods and transactions in treasure i.e. gold and current coins and notes, diplomatic goods, “proscribed substances” under Atomic Energy Act, 1962, are excluded from the trade data, while indirect transit trade, transactions in silver (other than current coins) and in notes and coins not yet in circulation or withdrawn from circulation are included. Table Nos. 40 & 41 (1) Data up to 1980-81 are final, subsequent data are preliminary actuals. Explanatory Notes Balance of payments is a statistical statement that systematically summarises, for a specific time period, the economic transactions of an economy with the rest of the world. Merchandise credit relate to export of goods while merchandise debit represent import of goods Travel covers expenditure incurred by non-resident travellers during their stay in the country and expenditure incurred by resident travellers abroad. Transportation covers receipts and payments on account of international transportation services. Insurance comprises receipts and payments relating to all types of insurance services as well as reinsurance. Government not included elsewhere (G.n.i.e.) relates to receipts and payments on government account not included elsewhere as well as receipts and payments on account of maintenance of embassies and diplomatic missions and offices of international institutions. Miscellaneous covers receipts and payments in respect of all other services such as communication services, construction services, software services, technical know-how, royalties etc. Transfers (official, private) represent receipts and payments without a quid pro quo. Investment Income transactions are in the form of interest, dividend, profit and others for servicing of capital transactions. Investment income receipts comprise interest received on loans to non-residents, dividend/profit received by Indians on foreign investment, reinvested earnings of Indian FDI companies abroad, interest received on debentures, floating rate notes (FRNs), Commercial Papers (CPs), fixed deposits and funds held abroad by ADs out of foreign currency loans/export proceeds, payment of taxes by nonresidents/refunds of taxes by foreign governments, interest/discount earnings on RBI investment etc. Investment income payments comprise payment of interest on non-resident deposits, payment of interest on loans from non-residents, payment of dividend/profit to non-resident share holders, reinvested earnings of the FDI companies, payment of interest on debentures, FRNs, CPs, fixed deposits, Government securities, charges on Special Drawing Rights (SDRs) etc. Foreign investment has two components, namely, foreign direct investment and portfolio investment. Foreign direct investment (FDI) to and by India up to 1999-2000 comprise mainly equity capital. In line with international best practices, the coverage of FDI has been expanded since 2000-01 to include, besides equity capital reinvested earnings (retained earnings of FDI companies) and ‘other direct capital’ (intercorporate debt transactions between related entities). Data on equity capital include equity of unincorporated entities (mainly foreign bank branches in India and Indian bank branches operating abroad) besides equity of incorporated bodies. Data on reinvested earnings for the latest year are estimated as average of the previous two years as these data are available with a time lag of one year. In view of the above revision, FDI data are not comparable with similar data for the previous years. In terms of standard practice of BoP compilation, the above revision of FDI data would not affect India’s overall BoP position as the accretion to the foreign exchange reserves would not undergo any change. The composition of BoP, however, would undergo changes. These changes relate to investment income, external commercial borrowings and errors and omissions. In case of reinvested earnings, there would be a contra entry (debit) of equal magnitude under investment income in the current account. ‘Other Capital’ reported as part of FDI inflow has been carved out from the figure reported under external commercial borrowings by the same amount. ‘Other Capital’ by Indian companies abroad and equity capital of unincorporated entities have been adjusted against the errors and omissions for 2000-01 and 2001-02. Portfolio investment mainly includes FIIs’ investment, funds raised through ADRs/GDRs by Indian companies and through offshore funds. Data on investment abroad, hitherto reported, have been split into equity capital and portfolio investment since 2000-01. External assistance by India denotes aid extended by India to other foreign Governments under various agreements and repayment of such loans. External Assistance to India denotes multilateral and bilateral loans received under the agreements between Government of India and other Governments/International institutions and repayments of such loans by India, except loan repayment to erstwhile “Rupee area” countries that are covered under the Rupee Debt Service. Commercial borrowings covers all medium/long term loans. Commercial Borrowings by India denote loans extended by the Export Import Bank of India (EXIM bank) to various countries and repayment of such loans. Commercial Borrowings to India denote drawals/repayment of loans including buyers’ credit, suppliers’ credit, floating rate notes (FRNs), commercial paper (CP), bonds, foreign currency convertible bonds (FCCBs) issued abroad by the Indian corporate etc. It also includes India Development Bonds (IDBs), Resurgent India Bonds (RIBs), India Millennium Deposits (IMDs). Short term loans denotes drawals in respect of loans, utilized and repayments with a maturity of less than one year. Banking capital comprises of three components : a) foreign assets of commercial banks (ADs), b) foreign liabilities of commercial banks (ADs), and c) others. ‘Foreign assets’ of commercial banks consist of (i) foreign currency holdings, and (ii) rupee overdrafts to non-resident banks. ‘Foreign liabilities’ of commercial banks consists of (i) Non-resident deposits, which comprises receipt and redemption of various nonresident deposit schemes, and (ii) liabilities other than non-resident deposits which comprises rupee and foreign currency liabilities to non-resident banks and official and semi-official institutions. ‘Others’ under banking capital include movement in balances of foreign central banks and international institutions like IBRD, IDA, ADB, IFC, IFAD etc. maintained with RBI as well as movement in balances held abroad by the embassies of India in London and Tokyo. Rupee debt service includes principal repayments on account of civilian and non-civilian debt in respect of Rupee Payment Area (RPA) and interest payment thereof. Other capital comprises mainly the leads and lags in export receipts (difference between the custom data and the banking channel data). Besides this, other items included are funds held abroad, India’s subscription to international institutions, quota payments to IMF, remittances towards recouping the losses of branches/subsidiaries and residual item of other capital transactions not included elsewhere. Movement in reserves comprises changes in the foreign currency assets held by the RBI and SDR balances held by the Government of India. These are recorded after excluding changes on account of valuation. Valuation changes arise because foreign currency assets are expressed in US dollar terms and they include the effect of appreciation/depreciation of non-US currencies (such as Euro, Sterling, Yen) held in reserves. Table No. 42
Table No. 49 The 5-country indices of REER/NEER were replaced with new 6-currency indices in December 2005. The RBI Bulletin December 2005 carried a detailed article on the rationale and methodology for the replacement. A revision has now been undertaken in the construction of the 6-currency REER indices. This revision was necessitated by a sudden spurt in Chinese inflation indices during April-May, 2006. It may be mentioned that Chinese inflation indices are not readily available in the public domain. The National Bureau of Statistics provides only point-to-point inflation rates on a monthly basis in the public domain. In view of this, inflation indices were constructed taking into account the inflation rates with 1993-94 as the base year. It may be further mentioned that the period from January 1993 to December 1995 was marked by continuous double digit inflation rates in China. This lent an upward bias to the Chinese inflation indices (base: 1993-94=100) leading to a sharp fall in the value of 6-currency REER in April 2006. In order to remove the distortion in REER on account of sudden spurt in Chinese inflation numbers, a new series of Chinese inflation indices has been constructed taking 1990 as the base year (a year with much less volatility in inflation rates). Subsequently, the base year of the new series of Chinese inflation indices has been changed from 1990 to 1993-94 through splicing to facilitate the construction of the 6-currency REER (base 1993-94=100). |

Share this page:


Install the RBI mobile application and get quick access to the latest news!


