Quarterly Order Books, Inventories and Capacity Utilisation Survey : April-June 2011 (Round 14)* - RBI - Reserve Bank of India
Quarterly Order Books, Inventories and Capacity Utilisation Survey : April-June 2011 (Round 14)*
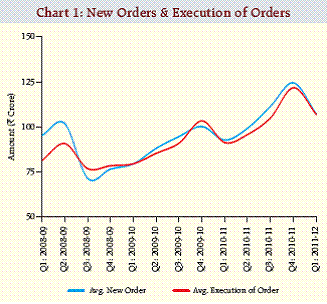
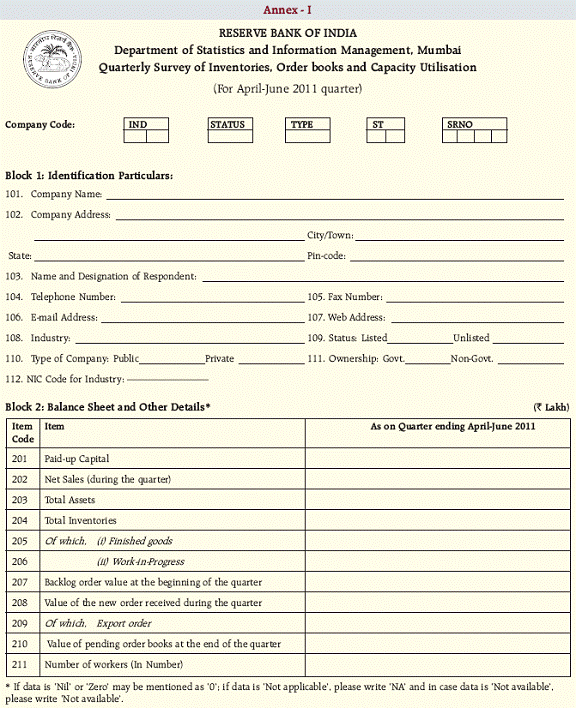
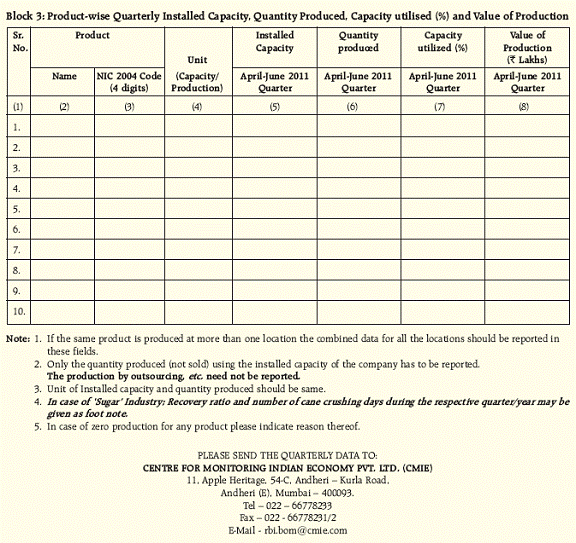
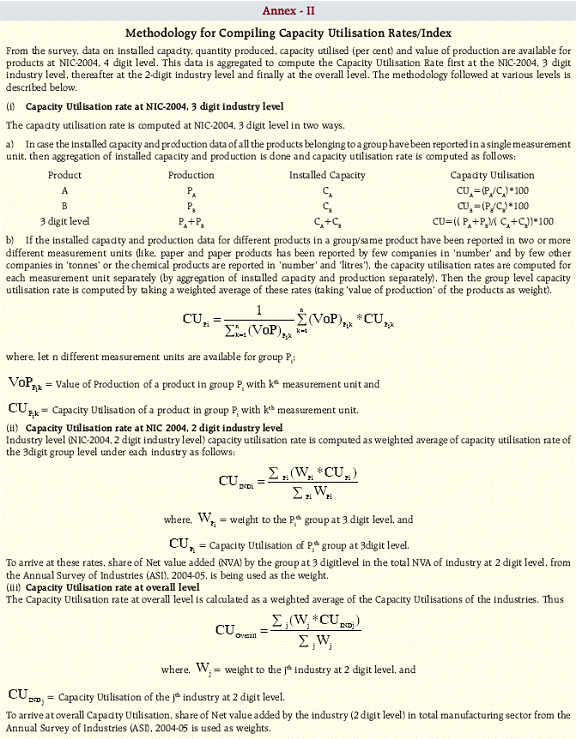
Quarterly Order Books, Inventories and Capacity Utilisation Survey: April-June 2011 (Round 14)* The Reserve Bank of India has been conducting Order Books, Inventories and Capacity Utilisation Survey (OBICUS) on a quarterly basis. The survey captures the quarterly movements in order books, inventories and capacity utilisation which are important indicators of economic activities, inflationary pressures and overall business cycle and as such, are useful for assessing the consumption and investment demand outlook. This article, first in the series, presents the findings of OBICUS conducted for Q1:2011-12, the 14th round in the series. During Q1:2011-12, the new orders of respondent companies dropped significantly by 13.8 per cent as compared to previous quarter, which in turn is reflected in lower capacity utilisation (CU) rate that could be partly due to seasonal factors. There has also been an increase in finished goods inventory. I. Introduction The Reserve Bank of India has been conducting Order Books, Inventories and Capacity Utilisation Survey (OBICUS) on a quarterly basis. The survey captures the movements in order books, inventories and capacity utilisation which are important indicators of economic activities, inflationary pressures and overall business cycle and, as such, are useful for assessing the consumption and investment demand outlook. The survey captures quantitative data on new orders received during the reference quarter, backlog orders at the beginning of the quarter, pending orders at the end of the quarter, total inventories with break up of work-in-progress and finished goods inventories at the end of the quarter and item-wise production in terms of quantity and values during the quarter vis-à-vis the installed capacity from a targeted group of manufacturing companies. The survey schedule is given in Annex I. The capacity utilisation is being derived from the data provided by companies as per the methodology placed in Annex II. The survey is canvassed among 2,500 public and private limited companies in the manufacturing sector with a good size/industry representation. Trend analysis is done to study the movements in inventories, order books and capacity utilisation based on a common set of companies in each round to facilitate better comparability of data over the reference quarters. The common set of companies may vary to some extent across the survey rounds depending upon the response received in each survey round. II. Sample Composition and Response to the Present Survey In all, 1,232 companies responded to the survey for the quarter April-June 2011. Of this, 49 are government companies, 311 are non-government private limited and 872 are non-government public limited companies. The analysis is based on the data provided by these companies for the last 13 quarters, i.e., Q1:2008-09 to Q1:2011-12. The data tables are given in Annex III. III. Findings of the Survey III.1 Order Books Average new orders of respondent companies, which had increased every quarter since Q4:2008-09, with the exception of Q1:2010-11, reversed the trend and declined by 13.8 per cent in the current survey quarter. Average executed orders1 has also shown a similar trend and declined by 12.3 per cent (Chart 1, Table 1).
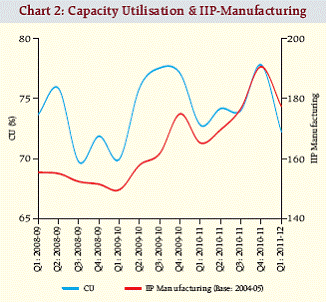
III.2 Capacity Utilisation (CU) In line with lower new orders, CU of respondent companies witnessed a significant decline. CU at overall level dropped to 72.3 per cent in Q1:2011-12 from 77.8 per cent in the previous quarter. Index of Industrial Production (IIP) for manufacturing sector also declined during Q1:2011-12 (Chart 2, Table 2).
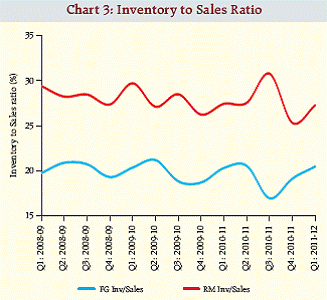
III.3 Inventories During Q1: 2011-12, the average total inventory of respondent companies grew by 4.8 per cent over the previous quarter, whereas the average finished goods (FG) inventory and average raw material (RM) inventory increased by 5.8 per cent and 6.3 per cent, respectively. On the other hand, the work-in-progress (WiP) inventory declined by 2.1 per cent in the latest quarter. Total inventory to sales ratio, FG inventory to sales ratio and RM inventory to sales ratio increased by 3.2, 1.4 and 1.9 percentage points, respectively, in Q1:2011-12 (Chart 3, Table 3).
IV. Conclusion OBICUS survey for the first quarter of 2011-12 indicated decline in new orders and level of capacity utilisation, partly due to seasonal factors, while finished goods inventory increased.
Data Tables
* Prepared in the Division of Enterprise Survey of Department of Statistics and Information Management. 1 Executed orders = backlog order at the beginning of the quarter plus new orders received during the quarter minus pending orders at the end of the quarter. |
||||||||||||||||||||||||||||||||||||||||||||||||||||||||||||||||||||||||||||||||||||||||||||||||||||||||||||||||||||||||||||||||||||||||||||||||||||||||||||||||||||||||||||||||||||||||||||||||


