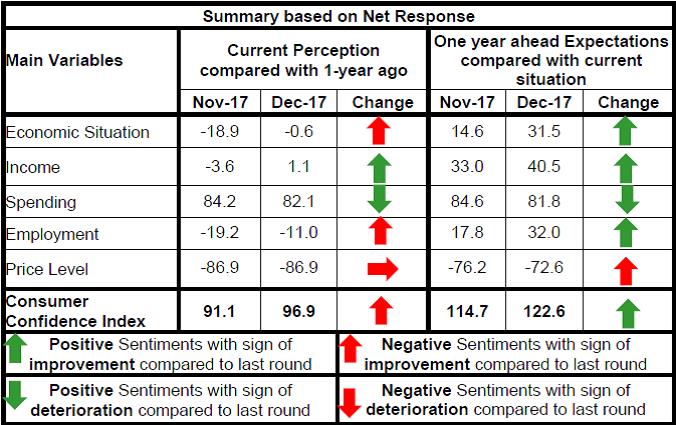
Today, the Reserve Bank released the results of the December 2017 round of the Consumer Confidence Survey (CCS)1. The survey was conducted in six metropolitan cities - Bengaluru; Chennai; Hyderabad; Kolkata; Mumbai; and New Delhi - and obtained 5,035 responses on households’ perceptions and expectations on the general economic situation, the employment scenario, the overall price situation and their own income and spending. Highlights: I. Consumer confidence gained some traction in December 2017 as the current situation index (CSI)2 recorded a significant rise after more than a year, although it remained in the pessimistic zone. In tandem, the future expectations index (FEI) reached a level last seen in May 2017 (Chart 1). II. Households’ current perceptions on the general economic situation improved and edged up towards the neutral level after five quarters of pessimism; their one year ahead outlook improved further within positive terrain (Table 1). III. The employment situation continued to be a major concern, but the current sentiment was less pessimistic than in the two previous rounds while the outlook strengthened (Table 2). IV. Respondents’ current assessment of the price situation and inflation remained similar to the last round, while the outlook improved slightly (Table 3 and 4). V. Sentiments on income entered the optimistic zone after a hiatus of six months; the outlook on income also improved, reflecting improved sentiments on employment (Table 5). VI. While the overwhelming majority of respondents reported increases in current and future spending, this proportion was lower than in the last round (Table 6). VII. In line with overall spending, the net response for both essential and non-essential spending declined slightly for the current period as well as the future (Table 7 and 8). | Table 1: Perceptions and Expectations on General Economic Situation | | (Percentage responses) | | Survey Round | Current Perception | One year ahead Expectation | | Improved | Remained Same | Worsened | Net Response | Will improve | Will remain same | Will worsen | Net Response | | Sep-16 | 44.6 | 30.1 | 25.3 | 19.4 | 57.7 | 24.3 | 18.0 | 39.6 | | Nov-16 | 49.5 | 26.6 | 23.9 | 25.6 | 63.0 | 18.7 | 18.3 | 44.8 | | Dec-16 | 45.7 | 24.1 | 30.3 | 15.4 | 66.3 | 16.6 | 17.1 | 49.2 | | Mar-17 | 35.6 | 24.4 | 40.0 | -4.5 | 52.1 | 21.4 | 26.5 | 25.6 | | May-17 | 36.4 | 25.9 | 37.7 | -1.3 | 52.4 | 23.5 | 24.1 | 28.3 | | Jun-17 | 32.4 | 27.7 | 39.9 | -7.5 | 48.6 | 25.9 | 25.5 | 23.1 | | Sep-17 | 34.6 | 24.7 | 40.7 | -6.2 | 50.8 | 22.8 | 26.3 | 24.5 | | Nov-17 | 28.9 | 23.3 | 47.9 | -18.9 | 45.2 | 24.1 | 30.6 | 14.6 | | Dec-17 | 36.8 | 25.8 | 37.4 | -0.6 | 54.4 | 22.7 | 22.9 | 31.5 |
| Table 2: Perceptions and Expectations on Employment | | (Percentage responses) | | Survey Round | Current Perception | One year ahead Expectation | | Improved | Remained Same | Worsened | Net Response | Will improve | Will remain same | Will worsen | Net Response | | Sept-16 | 31.7 | 36.4 | 31.9 | -0.2 | 50.5 | 30.5 | 19.0 | 31.5 | | Nov-16 | 37.6 | 30.9 | 31.4 | 6.2 | 55.7 | 26.6 | 17.7 | 37.9 | | Dec-16 | 31.0 | 29.8 | 39.2 | -8.3 | 57.3 | 24.1 | 18.6 | 38.7 | | Mar-17 | 32.6 | 28.4 | 39.0 | -6.4 | 52.8 | 24.5 | 22.7 | 30.1 | | May-17 | 32.5 | 28.3 | 39.2 | -6.8 | 52.7 | 26.7 | 20.7 | 32.0 | | Jun-17 | 30.8 | 30.3 | 38.9 | -8.1 | 49.6 | 29.3 | 21.2 | 28.4 | | Sep-17 | 30.1 | 26.3 | 43.7 | -13.6 | 49.9 | 24.0 | 26.1 | 23.8 | | Nov-17 | 27.5 | 25.7 | 46.8 | -19.2 | 45.1 | 27.5 | 27.4 | 17.8 | | Dec-17 | 30.3 | 28.4 | 41.3 | -11.0 | 53.1 | 25.9 | 21.1 | 32.0 |
| Table 3: Perceptions and Expectations on Price Level | | (Percentage responses) | | Survey Round | Current Perception | One year ahead Expectation | | Increased | Remained same | Decreased | Net Response | Will increase | Will remain same | Will decrease | Net Response | | Sep-16 | 78.2 | 17.2 | 4.6 | -73.6 | 77.8 | 15.4 | 6.9 | -70.9 | | Nov-16 | 82.2 | 14.3 | 3.6 | -78.6 | 82.9 | 11.9 | 5.2 | -77.7 | | Dec-16 | 73.9 | 18.3 | 7.7 | -66.2 | 69.5 | 16.0 | 14.5 | -55.0 | | Mar-17 | 85.8 | 9.1 | 5.1 | -80.7 | 81.0 | 10.4 | 8.6 | -72.4 | | May-17 | 83.3 | 11.3 | 5.4 | -78.0 | 79.7 | 11.5 | 8.8 | -70.9 | | Jun-17 | 85.2 | 11.4 | 3.4 | -81.8 | 76.1 | 13.8 | 10.1 | -66.0 | | Sep-17 | 87.7 | 8.7 | 3.6 | -84.1 | 81.0 | 12.5 | 6.5 | -74.5 | | Nov-17 | 89.9 | 7.1 | 3.0 | -86.9 | 82.9 | 10.4 | 6.7 | -76.2 | | Dec-17 | 89.9 | 7.1 | 3.0 | -86.9 | 80.1 | 12.4 | 7.5 | -72.6 |
| Table 4: Perceptions and Expectations on Rate of Change in Price Level (Inflation)* | | (Percentage responses) | | Survey Round | Current Perception | One year ahead Expectation | | Increased | Remained same | Decreased | Net Response | Will increase | Will remain same | Will decrease | Net Response | | Sept-16 | 61.8 | 22.4 | 15.8 | -45.9 | 64.3 | 22.4 | 13.3 | -51.0 | | Nov-16 | 64.5 | 18.2 | 17.3 | -47.2 | 66.8 | 18.6 | 14.6 | -52.1 | | Dec-16 | 57.8 | 18.0 | 24.2 | -33.5 | 62.4 | 17.1 | 20.6 | -41.8 | | Mar-17 | 80.5 | 12.5 | 7.0 | -73.5 | 79.9 | 13.8 | 6.3 | -73.6 | | May-17 | 82.0 | 10.0 | 8.0 | -74.0 | 82.6 | 10.9 | 6.5 | -76.1 | | Jun-17 | 79.9 | 11.5 | 8.5 | -71.4 | 78.7 | 13.5 | 7.9 | -70.8 | | Sep-17 | 80.6 | 10.4 | 9.0 | -71.5 | 78.6 | 14.1 | 7.2 | -71.4 | | Nov-17 | 82.9 | 9.0 | 8.1 | -74.8 | 80.4 | 12.1 | 7.5 | -72.9 | | Dec-17 | 80.4 | 12.8 | 6.8 | -73.6 | 76.9 | 17.0 | 6.1 | -70.8 | | *Applicable only for those respondents who felt price has increased/price will increase. |
| Table 5: Perceptions and Expectations on Income | | (Percentage responses) | | Survey Round | Current Perception | One year ahead Expectation | | Increased | Remained same | Decreased | Net Response | Will increase | Will remain same | Will decrease | Net Response | | Sep-16 | 31.2 | 48.6 | 20.2 | 11.1 | 52.3 | 36.4 | 11.3 | 41.1 | | Nov-16 | 37.3 | 45.5 | 17.2 | 20.1 | 57.1 | 33.4 | 9.4 | 47.7 | | Dec-16 | 27.1 | 47.1 | 25.8 | 1.3 | 54.8 | 33.5 | 11.7 | 43.1 | | Mar-17 | 27.7 | 47.3 | 25.0 | 2.7 | 51.8 | 36.5 | 11.7 | 40.1 | | May-17 | 28.2 | 48.0 | 23.8 | 4.4 | 52.8 | 38.1 | 9.1 | 43.6 | | Jun-17 | 23.8 | 53.8 | 22.4 | 1.4 | 47.1 | 43.5 | 9.4 | 37.7 | | Sep-17 | 26.6 | 46.8 | 26.6 | -0.1 | 48.5 | 39.0 | 12.5 | 36.1 | | Nov-17 | 24.4 | 47.6 | 28.0 | -3.6 | 45.6 | 41.8 | 12.6 | 33.0 | | Dec-17 | 25.2 | 50.7 | 24.1 | 1.1 | 50.7 | 39.1 | 10.3 | 40.5 |
| Table 6: Perceptions and Expectations on Spending | | (Percentage responses) | | Survey Round | Current Perception | One year ahead Expectation | | Increased | Remained same | Decreased | Net Response | Will increase | Will remain same | Will decrease | Net Response | | Sep-16 | 70.3 | 24.1 | 5.7 | 64.6 | 79.1 | 17.0 | 3.9 | 75.2 | | Nov-16 | 73.2 | 23.6 | 3.2 | 70.0 | 77.3 | 20.3 | 2.5 | 74.8 | | Dec-16 | 73.5 | 20.8 | 5.6 | 67.9 | 78.3 | 15.8 | 5.9 | 72.4 | | Mar-17 | 84.4 | 13.4 | 2.1 | 82.3 | 88.5 | 8.3 | 3.1 | 85.4 | | May-17 | 83.4 | 14.9 | 1.6 | 81.8 | 86.0 | 11.9 | 2.0 | 84.0 | | Jun-17 | 81.3 | 17.2 | 1.5 | 79.8 | 83.5 | 13.7 | 2.8 | 80.7 | | Sep-17 | 83.2 | 15.0 | 1.8 | 81.5 | 85.8 | 12.3 | 2.0 | 83.8 | | Nov-17 | 85.6 | 13.1 | 1.3 | 84.2 | 86.8 | 11.0 | 2.3 | 84.6 | | Dec-17 | 83.9 | 14.3 | 1.8 | 82.1 | 84.7 | 12.5 | 2.9 | 81.8 |
| Table 7: Perceptions and Expectations on Spending- Essential Items | | (Percentage responses) | | Survey Round | Current Perception | One year ahead Expectation | | Increased | Remained same | Decreased | Net Response | Will increase | Will remain same | Will decrease | Net Response | | Sep-16 | 79.1 | 16.9 | 4.0 | 75.1 | 82.5 | 12.7 | 4.8 | 77.6 | | Nov-16 | 81.7 | 15.2 | 3.1 | 78.6 | 85.1 | 10.9 | 4.0 | 81.1 | | Dec-16 | 76.9 | 18.4 | 4.7 | 72.2 | 77.5 | 14.9 | 7.7 | 69.8 | | Mar-17 | 85.8 | 11.1 | 3.1 | 82.7 | 87.0 | 9.2 | 3.8 | 83.2 | | May-17 | 85.7 | 11.6 | 2.8 | 82.9 | 86.9 | 9.6 | 3.5 | 83.4 | | Jun-17 | 82.2 | 15.3 | 2.5 | 79.7 | 81.9 | 13.5 | 4.6 | 77.2 | | Sep-17 | 85.0 | 12.6 | 2.4 | 82.6 | 86.1 | 10.9 | 3.0 | 83.1 | | Nov-17 | 86.8 | 11.3 | 1.9 | 85.0 | 86.2 | 10.7 | 3.2 | 83.0 | | Dec-17 | 85.2 | 13.0 | 1.8 | 83.4 | 85.2 | 10.9 | 4.0 | 81.2 |
| Table 8: Perceptions and Expectations on Spending- Non-Essential Items | | (Percentage responses) | | Survey Round | Current Perception | One year ahead Expectation | | Increased | Remained same | Decreased | Net Response | Will increase | Will remain same | Will decrease | Net Response | | Sep-16 | 50.2 | 37.6 | 12.2 | 38.0 | 60.6 | 29.5 | 9.9 | 50.7 | | Nov-16 | 52.2 | 36.8 | 11.1 | 41.1 | 62.7 | 27.6 | 9.7 | 53.0 | | Dec-16 | 37.3 | 44.7 | 18.1 | 19.2 | 49.6 | 35.8 | 14.7 | 34.9 | | Mar-17 | 48.9 | 36.4 | 14.7 | 34.2 | 57.8 | 30.3 | 11.8 | 46.0 | | May-17 | 51.9 | 34.6 | 13.5 | 38.3 | 59.9 | 31.1 | 9.0 | 50.9 | | Jun-17 | 51.6 | 35.5 | 13.0 | 38.6 | 56.3 | 32.6 | 11.1 | 45.2 | | Sep-17 | 54.0 | 34.4 | 11.7 | 42.4 | 60.2 | 30.6 | 9.2 | 50.9 | | Nov-17 | 56.5 | 32.5 | 11.0 | 45.5 | 60.6 | 31.1 | 8.3 | 52.3 | | Dec-17 | 51.1 | 36.6 | 12.3 | 38.8 | 57.3 | 33.6 | 9.1 | 48.2 |
|  IST,
IST,