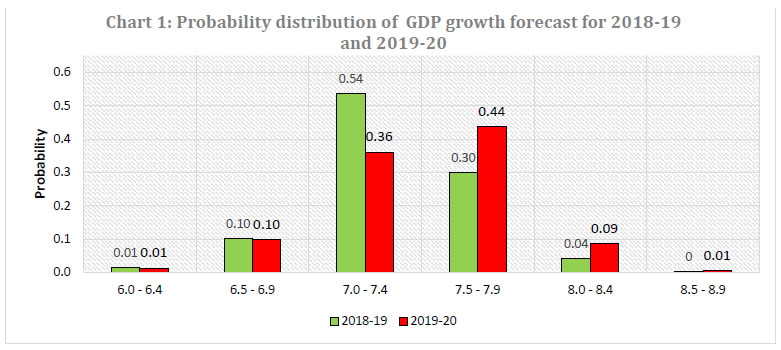
Growth is expected to firm up in 2018-19 and 2019-20 on the back of private consumption. Consumer price inflation is expected to decline in Q3:2018-19 but firm up and remain above 4.0 per cent in the first half of 2019-20. The Reserve Bank has been conducting the Survey of Professional Forecasters (SPF) since September 2007. Twenty-six panellists participated in the 55th round of the survey conducted during November 20182. The survey results are summarised in terms of their median forecasts and consolidated in Annexes 1-7, along with quarterly paths for key variables. Highlights: 1. Output • Real gross domestic product (GDP) is likely to grow at 7.4 per cent in 2018-19 ― up from 6.7 per cent in 2017-18 ― and is expected to accelerate further by 10 basis points (bps) in 2019-20 on the back of support from private consumption (Table 1). • The investment rate, proxied by the ratio of gross fixed capital formation to GDP, is expected to improve in 2018-19 and 2019-20, commensurate with anupturn in the saving rate. • Real gross value added (GVA) is expected to grow by 7.2 per cent in 2018-19 and by 7.3 per cent in 2019-20, supported by activity in the industrial and services sectors. | Table 1: Median Forecast of Growth in Real GDP, GVA and Components | | (in per cent) | | | 2018-19 | 2019-20 | | Real GDP Growth | 7.4
(0.0) | 7.5
(0.0) | Private Final Consumption Expenditure (nominal)
(growth rate in per cent) | 12.5
(+0.1) | 12.1
(-0.3) | Gross Fixed Capital Formation Rate
(per cent of GDP) | 28.7
(-0.1) | 29.0
(-0.1) | | Real GVA Growth | 7.2
(0.0) | 7.3
(0.0) | | a. Agriculture and Allied Activities | 4.1
(+0.2) | 3.7
(+0.1) | | b. Industry | 7.6
(-0.1) | 7.1
(-0.1) | | c. Services | 7.9
(0.0) | 8.3
(-0.1) | Gross Saving Rate
[per cent of gross national deposable income] (GNDI)] | 29.9
(+0.1) | 30.3
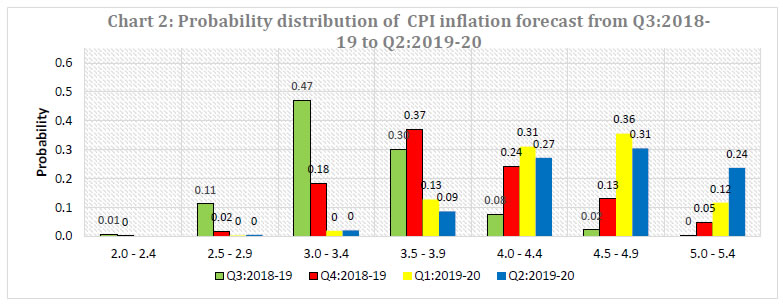
(+0.3) | | Note: In all the tables, the figures in parentheses indicate the extent of revision in median forecasts (percentage points) relative to the previous SPF round. | • Forecasters have assigned the maximum probability to GDP growth being in the range of 7.0-7.4 per cent in 2018-19 and 7.5-7.9 per cent in 2019-20 (Chart 1). 2. Inflation • Headline consumer price index (CPI) inflation is likely to decline to 3.1 per cent in Q3:2018-19 and increase thereafter. Headline inflation is expected at above 4.0 per cent in the first half of 2019-20. • Core inflation (i.e., CPI excluding food and beverages, pan, tobacco and intoxicants, and fuel and light) is likely to remain above 5.5 per cent during the second half of 2018-19 before edging down to 5.4 per cent in Q1:2019-20. | Table 2: Median Forecast of Quarterly Inflation | | (in per cent) | | | Q3:18-19 | Q4:18-19 | Q1:19-20 | Q2:19-20 | | CPI Headline | 3.1
(-1.0) | 4.0
(-0.5) | 4.5
(-0.5) | 4.6
(-0.5) | | CPI excluding food & beverages, pan, tobacco & intoxicants and fuel & light | 6.0
(+0.4) | 5.8
(+0.5) | 5.4
(+0.4) | 5.4
(+0.4) | | WPI All Commodities | 5.0
(+0.8) | 4.6
(+0.6) | 4.5
(+0.8) | 4.4
(+0.8) | | WPI Non-food Manufactured Products | 4.8
(+0.2) | 4.2
(+0.3) | 4.1
(+0.5) | 4.0
(+0.7) | • Forecasters have assigned the highest probability to CPI inflation being in the ranges of 3.0-3.4 per cent in Q3:2018-19, 3.5-3.9 per cent in Q4:2018-19 and 4.5- 4.9 per cent in Q1:2019-20 and Q2:2019-20 (Chart 2). 3. External Sector • The forecast of growth in merchandise exports and merchandise imports during 2018-19 have been revised up to 10.6 per cent and 14.5 per cent, respectively, but some deceleration is expected in 2019-20 (Table 3). • The current account deficit (CAD) is expected at 2.7 per cent and 2.6 per cent of GDP in 2018-19 and 2019-20, respectively. • The Indian rupee is likely to remain around ₹72 per US Dollar till Q2:2019-20 (Annex 3). | Table 3: Median Forecast of Select External Sector Variables | | | 2018-19 | 2019-20 | Merchandise Exports – in US $ terms
(annual growth in per cent) | 10.6
(+0.2) | 8.9
(-0.8) | Merchandise Imports– in US $ terms
(annual growth in per cent) | 14.5
(+0.2) | 10.4
(+2.0) | Current Account Deficit
(Ratio to GDP at current market price, in per cent) | 2.7
(0.0) | 2.6
(+0.1) |
The Reserve Bank thanks the following institutions for their participation in this round of the Survey of Professional Forecasters (SPF): Aditi Nayar (ICRA Limited); Arun Singh (Dun & Bradstreet India); Debopam Chaudhuri (Piramal Enterprises Limited); Devendra Kumar Pant (India Ratings and Research); Indranil Pan (IDFC Bank Ltd.); Nikhil Gupta (Motilal Oswal); PHD Research Bureau; Sameer Narang (Bank of Baroda); Shailesh Kejariwal (B&K Securities India Pvt Ltd); Siddharth V Kothari (Sunidhi Securities & Finance Ltd.); Upasna Bhardwaj (Kotak Mahindra Bank); STCI PD and TAC Economics. The Bank also acknowledges the contribution of thirteen others SPF panellists, who prefer to remain anonymous. |
| Annex 1: Annual Forecasts for 2018-19 | | Key Macroeconomic Indicators | Annual Forecasts for 2018-19 | | Mean | Median | Max | Min | 1st quartile | 3rd quartile | | 1 | GDP at constant (2011-12) prices: Annual Growth (per cent) | 7.4 | 7.4 | 7.8 | 7.0 | 7.3 | 7.5 | | 2 | Private Final Consumption Expenditure (PFCE) at current prices: Annual Growth (per cent) | 12.3 | 12.5 | 13.2 | 11.2 | 11.8 | 12.8 | | 3 | Gross Fixed Capital Formation (GFCF) Rate (per cent of GDP at current market prices) | 28.6 | 28.7 | 29.0 | 27.7 | 28.3 | 29.0 | | 4 | GVA at basic prices at constant (2011-12) prices: Annual Growth rate (per cent) | 7.2 | 7.2 | 7.7 | 6.7 | 7.1 | 7.3 | | a | Agriculture & Allied Activities (growth rate in per cent) | 3.9 | 4.1 | 4.6 | 3.0 | 3.5 | 4.3 | | b | Industry (growth rate in per cent) | 7.6 | 7.6 | 9.8 | 6.0 | 7.0 | 8.0 | | c | Services (growth rate in per cent) | 7.9 | 7.9 | 8.6 | 7.1 | 7.7 | 8.1 | | 5 | Gross Saving Rate (per cent of Gross National Disposable Income) - at current prices | 29.4 | 29.9 | 32.1 | 23.4 | 29.4 | 30.2 | | 6 | Fiscal Deficit of Central Govt. (per cent of GDP at current market prices) | 3.3 | 3.3 | 3.5 | 3.2 | 3.3 | 3.4 | | 7 | Combined Gross Fiscal Deficit (per cent to GDP) | 6.2 | 6.2 | 7.0 | 5.9 | 6.0 | 6.3 | | 8 | Bank Credit - Scheduled commercial banks: Annual Growth (per cent) | 12.1 | 12.5 | 14.2 | 9.5 | 11.3 | 13.0 | | 9 | Yield on 10-Year G-Sec of Central Govt. (end-period) | 7.8 | 7.8 | 8.3 | 7.3 | 7.7 | 7.9 | | 10 | Yield on 91-day T-Bill of Central Govt. (end-period) | 6.9 | 6.9 | 8.1 | 6.2 | 6.7 | 7.2 | | 11 | Merchandise Exports - BoP basis (in US$ terms)- Annual Growth (per cent) | 10.6 | 10.6 | 15.0 | 6.3 | 9.4 | 11.7 | | 12 | Merchandise Imports - BoP basis (in US$ terms)- Annual Growth (per cent) | 14.3 | 14.5 | 20.0 | 11.1 | 12.5 | 15.2 | | 13 | Current Account Balance - Ratio to GDP at current market price (per cent) | -2.7 | -2.7 | -2.2 | -3.0 | -2.8 | -2.6 | | 14 | Overall BoP - In US $ bn. | -16.6 | -16.4 | 46.1 | -65.0 | -30.3 | -6.6 | | 15 | Inflation based on CPI-Combined - Headline | 4.1 | 4.1 | 5.1 | 3.7 | 3.9 | 4.3 | | 16 | Inflation based on CPI-Combined - excluding 'Food & Beverages', 'Pan, Tobacco & Intoxicants' and 'Fuel & Light' | 5.8 | 5.9 | 6.1 | 4.6 | 5.8 | 6.0 | | 17 | Inflation based on WPI - All Commodities | 4.8 | 4.8 | 5.4 | 4.2 | 4.6 | 4.9 | | 18 | Inflation based on WPI -Non-food Manufactured Products | 4.4 | 4.5 | 5.1 | 2.8 | 4.3 | 4.7 |
| Annex 2: Annual Forecasts for 2019-20 | | Key Macroeconomic Indicators | Annual Forecasts for 2019-20 | | Mean | Median | Max | Min | 1st quartile | 3rd quartile | | 1 | GDP at constant (2011-12) prices: Annual Growth (per cent) | 7.5 | 7.5 | 8.1 | 6.4 | 7.3 | 7.6 | | 2 | Private Final Consumption Expenditure (PFCE) at current prices: Annual Growth (per cent) | 12.2 | 12.1 | 13.5 | 11.2 | 11.4 | 13.0 | | 3 | Gross Fixed Capital Formation (GFCF) Rate (per cent of GDP at current market prices) | 28.7 | 29.0 | 29.7 | 26.0 | 28.1 | 29.5 | | 4 | GVA at basic prices at constant (2011-12) prices: Annual Growth rate (per cent) | 7.3 | 7.3 | 7.9 | 6.8 | 7.2 | 7.5 | | a | Agriculture & Allied Activities (growth rate in per cent) | 3.6 | 3.7 | 4.7 | 2.2 | 3.0 | 4.2 | | b | Industry (growth rate in per cent) | 7.3 | 7.1 | 9.9 | 5.8 | 6.8 | 7.9 | | c | Services (growth rate in per cent) | 8.3 | 8.3 | 8.9 | 7.5 | 8.0 | 8.5 | | 5 | Gross Saving Rate (per cent of Gross National Disposable Income) - at current prices | 29.6 | 30.3 | 32.4 | 23.1 | 29.1 | 30.8 | | 6 | Fiscal Deficit of Central Govt. (per cent of GDP at current market prices) | 3.2 | 3.1 | 3.5 | 3.0 | 3.1 | 3.2 | | 7 | Combined Gross Fiscal Deficit (per cent to GDP) | 6.1 | 6.1 | 6.9 | 5.7 | 5.8 | 6.5 | | 8 | Bank Credit - Scheduled commercial banks: Annual Growth (per cent) | 13.0 | 13.0 | 15.9 | 11.6 | 11.8 | 13.5 | | 9 | Yield on 10-Year G-Sec of Central Govt. (end-period) | 7.7 | 7.8 | 8.0 | 7.2 | 7.5 | 7.9 | | 10 | Yield on 91-day T-Bill of Central Govt. (end-period) | 6.8 | 7.1 | 7.3 | 6.1 | 6.5 | 7.1 | | 11 | Merchandise Exports - BoP basis (in US$ terms)- Annual Growth (per cent) | 10.3 | 8.9 | 22.0 | 6.8 | 7.9 | 11.6 | | 12 | Merchandise Imports - BoP basis (in US$ terms)- Annual Growth (per cent) | 11.6 | 10.4 | 30.0 | 5.8 | 7.6 | 13.0 | | 13 | Current Account Balance - Ratio to GDP at current market price (per cent) | -2.6 | -2.6 | -2.0 | -3.0 | -2.8 | -2.4 | | 14 | Overall BoP - In US $ bn. | 3.7 | 5.0 | 49.2 | -48.0 | -3.0 | 11.0 | | 15 | Inflation based on CPI-Combined - Headline | 4.7 | 4.8 | 5.5 | 4.1 | 4.5 | 5.0 | | 16 | Inflation based on CPI-Combined - excluding 'Food & Beverages', 'Pan, Tobacco & Intoxicants' and 'Fuel & Light' | 5.1 | 5.1 | 6.0 | 4.4 | 4.6 | 5.5 | | 17 | Inflation based on WPI - All Commodities | 4.3 | 4.4 | 5.4 | 2.6 | 3.7 | 5.3 | | 18 | Inflation based on WPI -Non-food Manufactured Products | 3.7 | 4.0 | 5.1 | 2.3 | 2.8 | 4.4 |
| Annex 3: Quarterly Forecasts from Q3:2018-19 to Q2:2019-20 | | Key Macroeconomic Indicators | Quarterly Forecasts | | Q3: 2018-19 | Q4: 2018-19 | | Mean | Median | Max | Min | Mean | Median | Max | Min | | 1 | GDP at constant (2011-12) prices: Annual Growth (per cent) | 7 | 7 | 7.6 | 6.4 | 6.9 | 6.9 | 7.7 | 6.2 | | 2 | PFCE at current prices: Y-on-Y Growth (per cent) | 11.7 | 11.8 | 12.7 | 10.3 | 11.7 | 12 | 12.5 | 10.1 | | 3 | GFCF Rate (per cent of GDP at current market prices) | 28.8 | 28.8 | 31.9 | 27.3 | 29.2 | 29.4 | 32 | 27 | | 4 | GVA at constant (2011-12) prices: Annual Growth (per cent) | 6.9 | 6.9 | 7.7 | 6.3 | 6.7 | 6.7 | 7.6 | 6 | | a | Agriculture & Allied Activities (growth rate in per cent) | 3.5 | 3.7 | 5 | 1.7 | 3.4 | 3.1 | 5.1 | 2 | | b | Industry (growth rate in per cent) | 7 | 6.8 | 9.9 | 5 | 6.4 | 6.4 | 8.7 | 5 | | c | Services (growth rate in per cent) | 7.9 | 7.9 | 8.9 | 7.1 | 7.7 | 7.7 | 9.1 | 6.6 | | 5 | IIP (2011-12=100): Quarterly Average Growth (per cent) | 4.9 | 4.5 | 7.2 | 3.7 | 4.5 | 3.9 | 6.5 | 3.2 | | 6 | Merchandise Exports - BoP basis (in US$ bn.) | 84.4 | 84.5 | 90 | 81.1 | 87.3 | 87.1 | 93.5 | 80.8 | | 7 | Merchandise Imports - BoP basis (in US$ bn.) | 136.6 | 135 | 145 | 131.5 | 136.9 | 135.5 | 152.4 | 129 | | 8 | Rupee – US Dollar Exchange rate (RBI reference rate) (end-period) | 72.8 | 72 | 76 | 70.7 | 72.2 | 71.5 | 77 | 70 | | 9 | Crude Oil (Indian basket) price (US $ per barrel) (end-period) | 69.9 | 69.6 | 73 | 67 | 69.9 | 69 | 74 | 65 | | 10 | Repo Rate (end-period) | 6.50 | 6.50 | 6.50 | 6.50 | 6.54 | 6.50 | 6.75 | 6.50 |
| Key Macroeconomic Indicators | Quarterly Forecasts | | Q1: 2019-20 | Q2: 2019-20 | | Mean | Median | Max | Min | Mean | Median | Max | Min | | 1 | GDP at constant (2011-12) prices: Annual Growth (per cent) | 7.2 | 7.2 | 7.8 | 6.5 | 7.5 | 7.4 | 8.1 | 6.7 | | 2 | PFCE at current prices: Y-on-Y Growth (per cent) | 11.9 | 12.2 | 12.9 | 10.5 | 12.2 | 12.1 | 13.6 | 10.8 | | 3 | GFCF Rate (per cent of GDP at current market prices) | 29.1 | 28.8 | 32.2 | 27.8 | 28.8 | 28.7 | 32.4 | 26.0 | | 4 | GVA at constant (2011-12) prices: Annual Growth (per cent) | 7.2 | 7.1 | 7.9 | 6.2 | 7.4 | 7.3 | 8.1 | 6.8 | | a | Agriculture & Allied Activities (growth rate in per cent) | 3.7 | 3.9 | 5.0 | 2.3 | 3.7 | 3.7 | 5.1 | 2.7 | | b | Industry (growth rate in per cent) | 6.9 | 6.9 | 9.1 | 4.8 | 7.3 | 7.3 | 9.6 | 5.4 | | c | Services (growth rate in per cent) | 8.1 | 8.1 | 8.9 | 7.3 | 8.1 | 8.0 | 8.8 | 7.3 | | 5 | IIP (2011-12=100): Quarterly Average Growth (per cent) | 5.5 | 5.7 | 6.5 | 4.0 | 5.5 | 5.4 | 7.1 | 4.0 | | 6 | Merchandise Exports - BoP basis (in US$ bn.) | 88.4 | 88.6 | 93.4 | 85.0 | 90.4 | 90.4 | 94.6 | 86.7 | | 7 | Merchandise Imports - BoP basis (in US$ bn.) | 140.0 | 140.4 | 149.2 | 132.8 | 142.3 | 142.4 | 150.2 | 134.6 | | 8 | Rupee – US Dollar Exchange rate (RBI reference rate) (end-period) | 72.2 | 71.8 | 78.0 | 69.7 | 71.9 | 71.3 | 78.5 | 68.9 | | 9 | Crude Oil (Indian basket) price (US $ per barrel) (end-period) | 69.6 | 69.0 | 75.0 | 63.0 | 68.2 | 68.0 | 75.0 | 60.0 | | 10 | Repo Rate (end-period) | 6.59 | 6.50 | 7.00 | 6.25 | 6.62 | 6.50 | 7.00 | 6.25 |
| Annex 4: Forecasts of CPI-Combined Inflation | | (per cent) | | | CPI Combined Headline | Core CPI Combined (excluding ‘Food & Beverages’, 'Pan, Tobacco & Intoxicants' and ‘Fuel & Light’) | | Mean | Median | Max | Min | Mean | Median | Max | Min | | Q3:2018-19 | 3.4 | 3.1 | 5.0 | 2.7 | 6.1 | 6.0 | 6.7 | 5.6 | | Q4:2018-19 | 4.1 | 4.0 | 5.7 | 3.2 | 5.8 | 5.8 | 6.5 | 5.1 | | Q1:2019-20 | 4.6 | 4.5 | 6.0 | 3.9 | 5.4 | 5.4 | 6.3 | 4.6 | | Q2:2019-20 | 4.7 | 4.6 | 5.5 | 3.9 | 5.4 | 5.4 | 6.4 | 4.5 |
| Annex 5: Forecasts of WPI Inflation | | (per cent) | | | WPI Headline | WPI Non-food Manufactured Products | | Mean | Median | Max | Min | Mean | Median | Max | Min | | Q3:2018-19 | 4.9 | 5.0 | 5.4 | 4.4 | 4.9 | 4.8 | 5.6 | 4.4 | | Q4:2018-19 | 4.9 | 4.6 | 6.5 | 4.0 | 4.2 | 4.2 | 5.2 | 3.2 | | Q1:2019-20 | 4.5 | 4.5 | 5.9 | 3.5 | 3.9 | 4.1 | 4.9 | 2.6 | | Q2:2019-20 | 4.3 | 4.4 | 5.8 | 2.6 | 3.7 | 4.0 | 5.1 | 2.1 |
| Annex 6: Mean probabilities attached to possible outcomes of Real GDP growth | | Growth Range | Forecasts for 2018-19 | Forecasts for 2019-20 | | 10.0 per cent or more | 0.00 | 0.00 | | 9.5 to 9.9 per cent | 0.00 | 0.00 | | 9.0 to 9.4 per cent | 0.00 | 0.00 | | 8.5 to 8.9 per cent | 0.00 | 0.01 | | 8.0 to 8.4 per cent | 0.04 | 0.09 | | 7.5 to 7.9 per cent | 0.30 | 0.44 | | 7.0 to 7.4 per cent | 0.54 | 0.36 | | 6.5 to 6.9 per cent | 0.10 | 0.10 | | 6.0 to 6.4 per cent | 0.01 | 0.01 | | 5.5 to 5.9 per cent | 0.00 | 0.00 | | 5.0 to 5.4 per cent | 0.00 | 0.00 | | 4.5 to 4.9 per cent | 0.00 | 0.00 | | 4.0 to 4.4 per cent | 0.00 | 0.00 | | 3.5 to 3.9 per cent | 0.00 | 0.00 | | 3.0 to 3.4 per cent | 0.00 | 0.00 | | 2.5 to 2.9 per cent | 0.00 | 0.00 | | 2.0 to 2.4 per cent | 0.00 | 0.00 | | Below 2.0 per cent | 0.00 | 0.00 |
| Annex 7: Mean probabilities attached to possible outcomes of CPI (Combined) inflation | | Inflation Range | Forecasts for Q3:2018-19 | Forecasts for Q4:2018-19 | Forecasts for Q1:2019-20 | Forecasts for Q2:2019-20 | | 8.0 per cent or above | 0.00 | 0.00 | 0.00 | 0.00 | | 7.5 to 7.9 per cent | 0.00 | 0.00 | 0.00 | 0.00 | | 7.0 to 7.4 per cent | 0.00 | 0.00 | 0.00 | 0.00 | | 6.5 to 6.9 per cent | 0.00 | 0.00 | 0.00 | 0.00 | | 6.0 to 6.4 per cent | 0.00 | 0.00 | 0.00 | 0.00 | | 5.5 to 5.9 per cent | 0.00 | 0.00 | 0.06 | 0.07 | | 5.0 to 5.4 per cent | 0.00 | 0.05 | 0.12 | 0.24 | | 4.5 to 4.9 per cent | 0.02 | 0.13 | 0.36 | 0.31 | | 4.0 to 4.4 per cent | 0.08 | 0.24 | 0.31 | 0.27 | | 3.5 to 3.9 per cent | 0.30 | 0.37 | 0.13 | 0.09 | | 3.0 to 3.4 per cent | 0.47 | 0.18 | 0.02 | 0.02 | | 2.5 to 2.9 per cent | 0.11 | 0.02 | 0.00 | 0.01 | | 2.0 to 2.4 per cent | 0.01 | 0.00 | 0.00 | 0.00 | | 1.5 to 1.9 per cent | 0.00 | 0.00 | 0.00 | 0.00 | | 1.0 to 1.4 per cent | 0.00 | 0.00 | 0.00 | 0.00 | | 0.5 to 0.9 per cent | 0.00 | 0.00 | 0.00 | 0.00 | | 0 to 0.4 per cent | 0.00 | 0.00 | 0.00 | 0.00 | | Below 0 per cent | 0.00 | 0.00 | 0.00 | 0.00 | | Note: CPI: Consumer Price Index; GDP: Gross Domestic Products; GNDI: Gross National Disposable Income; GVA: Gross Value Added; IIP: Index of Industrial Production; WPI: Wholesale Price Index. |
|  IST,
IST,