 IST,
IST,


Consumer Confidence Survey - Q2: 2014-15 to Q1: 2015-16
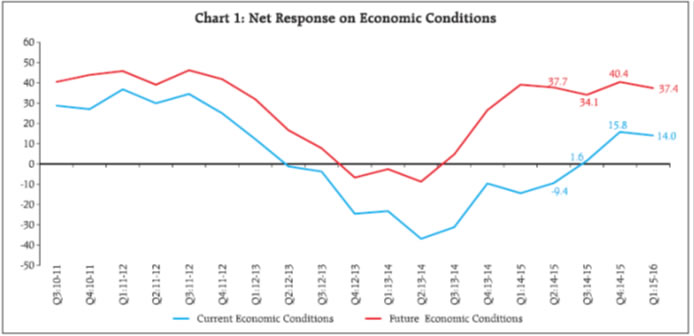
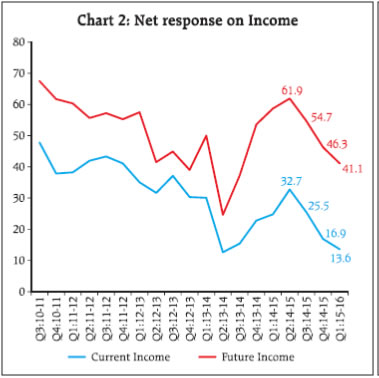
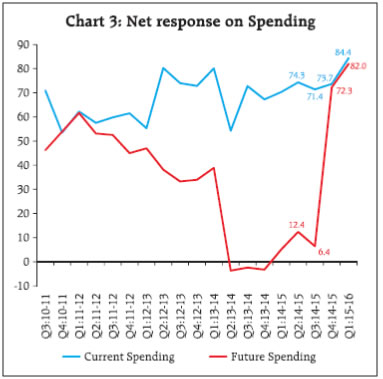
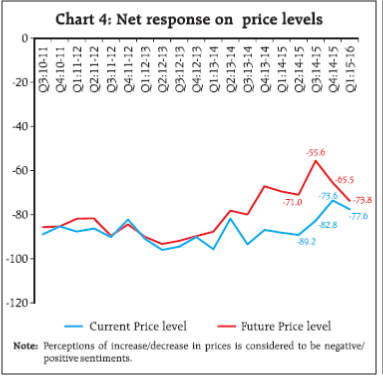
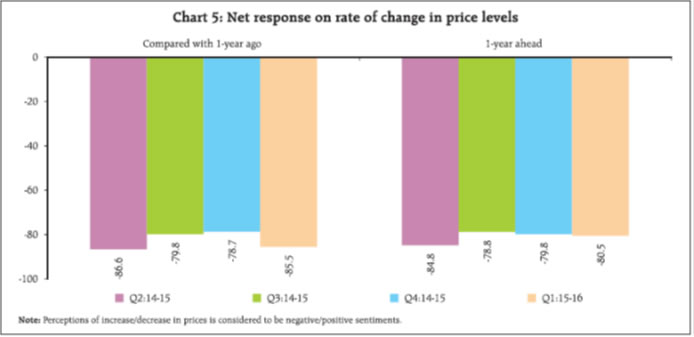
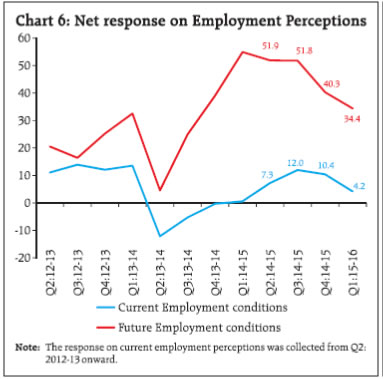
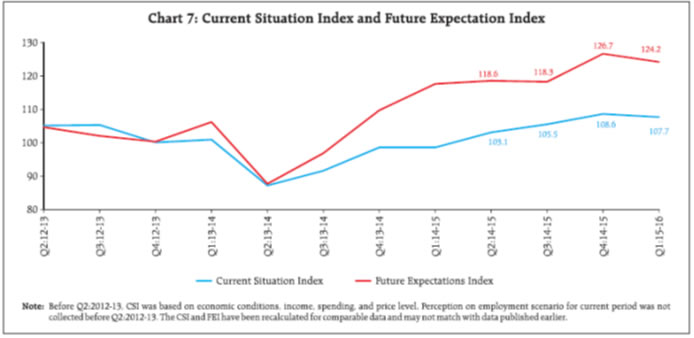
1. Introduction The Reserve Bank has been conducting Consumer Confidence Survey (CCS) of households on a quarterly basis since June 2010. At present, the survey captures qualitative responses on questions pertaining to economic conditions, income, spending, prices, employment prospects, etc. The survey results are based on the views of the respondents and are not necessarily shared by the Reserve Bank of India. The responses are obtained in two parts, viz., current situation as compared with a year ago and expectations for a year ahead. The quarterly survey results of CCS are released regularly on the RBI website. This article presents analysis of survey results covering a longer time period, with particular focus on the last four rounds (Q2:2014-15 to Q1:2015-16) of the survey. 2. Sample Coverage and Survey Questionnaire The survey is conducted in six metropolitan cities, viz., Bengaluru, Chennai, Hyderabad, Kolkata, Mumbai and Delhi. In each round of survey, 5,400 respondents are selected (900 respondents from each city). A two stage sampling design is adopted for the survey. At first stage in a city, the polling booths are selected by systematic sampling scheme after arranging all polling booths according to their constituencies. In order to ensure wide geographical coverage, 45 polling booths spread over the entire city are selected. In second stage, from each selected polling booth area, 20 respondents are selected following the right hand rule. Till Q3:2014-15, the survey schedule was organized into four blocks covering the respondent’s details (Block 1), economic conditions (Block 2), household circumstances and general views on income, spending, etc. (Block 3) and perception on price level (Block 4). Subsequently, the survey questionnaire was rationalized to capture more focused responses, and the modified survey questionnaire was canvased from the March, 2015 (Q4:2014-15) survey round. From Q4:2014-15 onwards, information relating to expenditure on essential and non-essential items, and households’ current financial situation is also being collected, whereas questions on current interest rate, households’ circumstances, outlay for major expenditures viz., motor vehicles, house, consumer durables, etc., were dropped. Qualitative information is obtained on a three point scale i.e., positive/no change/ negative. The revised questionnaire used for survey is available at RBI website1. 3. Survey Results The survey results are analyzed for each factor based on net response (difference between positive and negative perceptions). In the article, current is used for current situation as compared with one year ago and future is used for expectations for one year ahead period. 3.1 Economic Conditions During the last one year, i.e., Q2:2014-15 to Q1:2015-16, the perceptions of respondents on current economic conditions of the country showed signs of improvement. Net response on current economic condition which was negative (-9.4 per cent) in Q2:2014- 15, turned positive thereafter and stood at 15.8 per cent in Q4:2014-15. It however, moderated to 14.0 per cent in Q1:2015-16. The proportion of respondents who reported improvement in current economic conditions increased steadily over the last four quarters (Table 1). During Q3:2014-15 to Q1:2015-16, improvement was also observed in perceptions of respondents on future economic situation of the country. The net response moved up from 34.1 to 37.4 per cent in the above period. The optimism regarding future economic conditions has consistently been higher than that pertaining to the current economic conditions (Chart 1). However, the difference between the net responses on current and future economic conditions has narrowed down over the quarters. 3.2 Income Perceptions on current as well as future income, showed declining trend over the last four quarters. Current income perceptions have remained consistently lower as compared to those on future income; but the gap between the two marginally declined in the Q1:2015-16 (Chart 2). The proportion of respondents, who reported relatively higher income as compared to the last year, decreased consistently from 47.2 per cent in Q2:2014- 15 to 34.9 per cent in Q1:2015-16 though the pace of such reduction has slowed down. The corresponding proportion in respect of future income expectations also showed similar trend but remained above 50 per cent during all the four quarters. About 38-48 per cent respondents reported that their income has remained at the same level as that of last year. The corresponding proportion for future income varied between 28 and 36 per cent (Table 2). 3.3 Spending Majority of the respondents reported higher spending in the current year as compared to the position a year ago, the net response remaining above 70 per cent in first three quarters and rising further to 84 per cent in Q1:2015-16. The net response on future spending remained quite low and declined from 12.4 per cent in Q2:2014-15 to 6.4 per cent in Q3:2014-15 (Table 3). However, the net response on future spending rose sharply in Q4:2014-15 and it further strengthened in Q1:2015-16 and reached its highest ever level (82.0 per cent) (Chart 3). On perceptions relating to spending on essential items, more than 87 per cent respondents reported increase for the current as well as future period in Q1: 2015-16. Further, during Q1:2015-16, proportions of respondents reporting increase in current and future perceptions on non-essential spending, also showed increase as compared to Q4: 2014-15 and stood at around 47 per cent and 52 per cent, respectively. Increase in income, higher expenditure towards consumer durable goods and increase in cost of consumer goods and services were reported to be the major factors which led to higher spending in the current period. 3.4 Perceptions on Price Levels and Inflation Sentiments on price level and inflation improved between Q2:2014-15 and Q4: 2014-15, but reversed in Q1:2015-16. The proportion of respondents reporting rise in prices as compared to one-year ago decreased from 92.1 per cent to 84.3 per cent during the last four rounds, having reached a low of 78.8 per cent in Q4:2014-15. Similarly, proportion of respondents expecting prices to rise in the next one-year decreased from 77.6 per cent in Q2:2014-15 to 73.9 per cent in Q4:2014-15 but rose to 82.3 per cent in Q1:2015-16 (Table 4). Thus, while net responses on current price level remained highly negative, some improvement was observed over the last four quarters (Chart 4). The net response on expectations on prices, however, worsened between Q3:2014-15 and Q1:2015-16. The respondents who reported/expected increase in price levels were further asked as to whether the rate of price rise (i.e., inflation) would be higher (or same or lower) as compared to one-year ago and for one-year ahead period. Net responses on change in price level are presented in Chart 5. More than three fourths of respondents expected inflation to increase over the next one-year (Table 5). 3.5 Employment The respondents had more optimistic outlook regarding employment a year ahead, as compared to current scenario as reflected in the net responses on employment perceptions (Chart 6). However, the sentiment on future employment as well as current employment deteriorated between Q3:2014-15 and Q1:2015-16 (Table 8). 3.6 Income versus Spending and Inflation versus Spending The cross tabulation of responses on income and spending for the last four rounds is presented in Table 6. About 30-40 per cent of respondents who reported increase in current spending were also associated with increase in current income. Interestingly, the proportion of respondents, who reported increase in current spending with their current income remaining either same or lower, showed an increasing trend over the last four quarters, from 38 per cent in Q2:2014-15 to 55.5 per cent in Q1:2015-16. Similarly, while sharp rise in the proportion of respondents who expected higher future spending in the last two quarters was partly associated with increase in future income, the share of these with same or lower future income also were higher. To obtain further insights on spending perceptions, cross tabulation of responses on inflation and spending for the last four rounds are computed (Table 7). The analyses of these responses revealed that about 70-80 per cent of the respondents who reported higher current spending also reported higher current inflation. Association of increase in future spending with increase in expected inflation also rose sharply in the last two quarters and reached 75 per cent in Q1:2015-16 from about 36 per cent in Q2:2014-15. 3.7 Consumer Confidence Index 3.7.1 Current Situation Index (CSI) and Future Expectations Index (FEI) Consumer confidence indices (CSI and FEI) are calculated using net responses on economic conditions, income, spending, employment conditions and price levels (Methodology in Annex 1). The increasing trend in Current Situation Index (CSI) and Future Expectations Index (FEI) continued in the year under reference also. However, after reaching their highest level in last two years (108.6 for CSI and 126.7 for FEI) in Q4:2014-15, the indices declined marginally in Q1:2015-16 (Chart 7 and Table 9). Significant improvement in overall consumer confidence indices exhibited during this period was due to increase in the positive perceptions on some of the selected factors (viz., economic conditions, spending and price level). 3.7.2 Robustness of Estimates In order to examine the quality of estimates, the confidence intervals for CSI and FEI have been estimated using bootstrap methodology. Based on 10,000 re-samples selected through simple random sampling with replacement (SRSWR), the 99 per cent bootstrap confidence intervals for CSI and FEI are given in Table 10. The narrow confidence intervals (varied from 1.9 to 2.6) indicate robustness of the estimates of CSI and FEI. 3.8 Summary The consumer confidence indices, viz., current situation index and future expectation index exhibited improvement during the last one year, although slight moderation was observed in the June 2015 round. However, viewing across different factors used for construction of the indices, there was a mixed trend. Improvements in the positive perceptions on economic conditions, spending and price levels, observed during Q2:2014-15 and Q4:2014-15. However, perceptions on income and employment scenario showed decreasing trend over the same period. The level of optimism in future economic conditions, income and employment scenario, as in the past, have consistently been higher than those relating to current situation. It is also observed that improvement in sentiment on current and future spending is associated with higher inflation perception.
Annex 2: Methodology Current Situation Index & Future Expectations Index In standard opinion surveys, respondents generally have three reply options such as up/same/down; or above-normal/normal/ below-normal; or increase/ remain-same/decrease. Because of the difficulty of interpreting all three percentages, the survey results are normally converted into a single quantitative number. One of the most common way of doing this is to use ‘Net-Responses’ (also called ‘Balances’ or ‘Net Balances’). It is defined as the percentage of the respondents reporting a decrease (negative), subtracted from the percentage reporting an increase (positive). Net Responses can take values from –100 to +100. In this survey, Net Response is used to analyse the Consumer Confidence Survey results. To combine the consumer confidence perceptions on various factors, two indices are worked out. These are Current Situation Index for reflecting current situation as compared to one year ago and Future Expectations Index to reflect the expectations one year ahead. For calculating the index, the following formula has been used. Overall Index = 100 + Average (Net Response of selected factors) Where Net Response = Positive perceptions (%) – Negative perception (%) The average net responses on the current perception on various factors, viz. economic conditions income, spending, price level and employment are used for the calculation of the Current Situation Index. The average net responses on the future perceptions on various factors, viz. economic conditions, income, spending, price level and employment are used for the calculation of the Future Expectations Index. ____________________________ 2 Pre Q2:2012-13 rounds, the CSI was based on the net responses on economic conditions, household circumstances, income, spending and price levels; and FEI was based on the net responses on economic conditions, income, spending, employment conditions and price levels. * Prepared in the Department of Statistics and Information Management, Reserve Bank of India, New Delhi. The latest round (June 2015) of the survey data was released on August 4, 2015 along with Monetary policy statement on the RBI Website. The previous annual article on the subject was published in September 2014 issue of the RBI Bulletin. | |||||||||||||||||||||||||||||||||||||||||||||||||||||||||||||||||||||||||||||||||||||||||||||||||||||||||||||||||||||||||||||||||||||||||||||||||||||||||||||||||||||||||||||||||||||||||||||||||

এই পৃষ্ঠাটো শ্বেয়াৰ কৰক:


ভাৰতীয় ৰিজাৰ্ভ বেংক মোবাইল এপ্পলিকেষ্যন ইনষ্টল কৰক আৰু নৱীনতম বাতৰিৰ প্ৰৱেশাধিকাৰ পাওক!
আমাৰ এপটো ইনষ্টল কৰিবলৈ QR ক’ড স্কেন কৰক


পৃষ্ঠাটো শেহতীয়া আপডেট কৰা তাৰিখ:


