|
आज, रिज़र्व बैंक ने अपने द्विमासिक उपभोक्ता विश्वास सर्वेक्षण (सीसीएस) [1] के नवम्बर 2023 दौर के परिणाम जारी किए। सर्वेक्षण 19 प्रमुख शहरों में सामान्य आर्थिक स्थिति, रोजगार परिदृश्य, समग्र मूल्य स्थिति और स्वयं की आय एवं व्यय पर वर्तमान धारणाएं (एक साल पहले की तुलना में) और एक वर्ष आगे की अपेक्षाएं प्राप्त करता है। सर्वेक्षण का नवीनतम दौर 2-11 नवम्बर, 2023 के दौरान आयोजित किया गया था, जिसमें 6,082 उत्तरदाताओं को शामिल किया गया था। इस सैंपल में महिला उत्तरदाताओं का हिस्सा 52.8 प्रतिशत रहा है।
मुख्य विशेषताएँ:
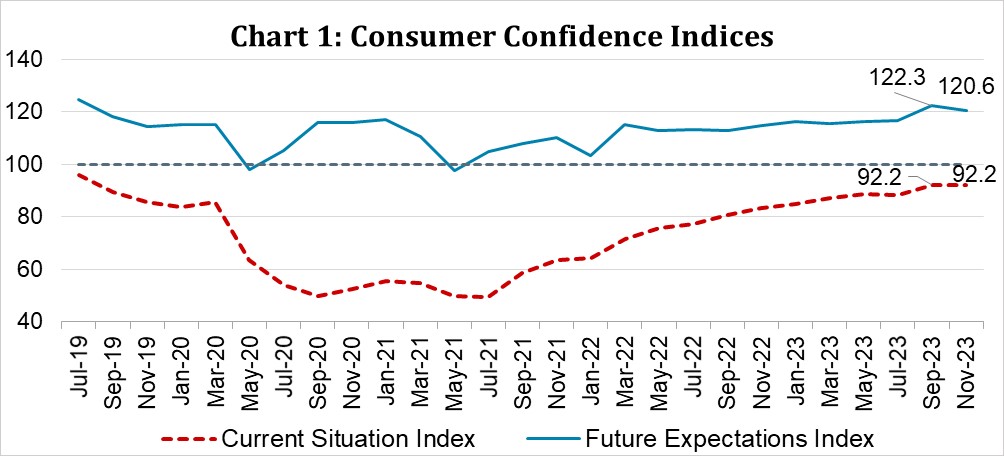
- वर्तमान अवधि के लिए उपभोक्ता विश्वास स्थिर रहा है; वर्तमान स्थिति सूचकांक (सीएसआई)[2] 92.2 पर पिछले दौर से अपरिवर्तित रहा, चूंकि वर्तमान सामान्य आर्थिक स्थिति और रोजगार पर उच्च निराशावाद, वर्तमान आय पर धारणा में सकारात्मक बदलाव से प्रतिसंतुलित रहा (चार्ट 1; टेबल 1, 2 और 5)।
- उत्तरदाता सामान्य आर्थिक स्थिति, रोजगार, आय और व्यय के लिए एक साल आगे की संभावनाओं पर काफी आशावादी बने हुए हैं; हालांकि, पिछले सर्वेक्षण दौर की तुलना में सामान्य आर्थिक और रोजगार की स्थिति पर विश्वास हल्का कम है, जिसके कारण भविष्य की उम्मीद के सूचकांक (एफईआई) में सकारात्मक क्षेत्र के भीतर कमी आई है (चार्ट 1; टेबल 1, 2, 5 और 6)।
- वर्तमान और भविष्य के मूल्यों की स्थिति को लेकर उपभोक्ताओं का नकारात्मक भाव बरकरार है (टेबल 3 और 4)।
- परिवारों की वर्तमान आय का आकलन जुलाई 2019 के बाद से अपने उच्चतम स्तर पर पहुंच गया है और भविष्य की आय की उम्मीदों में भी और सुधार हुआ (टेबल 5)।
|
Summary based on Net Responses[4]
|
|
Main Variables
|
Current Perception
compared with one-year ago
|
One year ahead Expectations compared with current situation
|
|
|
Sep-23
|
Nov-23
|
Change
|
Sep-23
|
Nov-23
|
Change
|
|
Economic Situation
|
-7.9
|
-11.3
|
|
28.6
|
25.7
|
|
|
Employment
|
-10.2
|
-12.4
|
|
29.6
|
26.9
|
|
|
Price Level
|
-90.0
|
-89.9
|
|
-66.8
|
-72.3
|
|
|
Income
|
-0.3
|
4.5
|
|
49.2
|
51.8
|
|
|
Spending
|
69.4
|
70.1
|
|
70.6
|
70.9
|
|
|
Consumer Confidence
Index
|
92.2
|
92.2
|
|
122.3
|
120.6
|
|
|
Positive Sentiments with sign of improvement compared to last round
|
Negative Sentiments with sign of improvement compared to last round
|
|
Positive Sentiments with sign of deterioration compared to last round
|
Negative Sentiments with sign of deterioration compared to last round
|
|
Positive Sentiments with no change compared to last round
|
Negative Sentiments with no change compared to last round
|
Table 1: Perceptions and Expectations on the General Economic Situation
|
(Percentage responses)
|
|
Survey Round
|
Current Perception
|
One year ahead Expectation
|
|
Increased
|
Remained Same
|
Decreased
|
Net Response
|
Will Increase
|
Will Remain Same
|
Will Decrease
|
Net Response
|
|
|
Nov-22
|
28.0
|
16.3
|
55.7
|
-27.8
|
48.0
|
15.6
|
36.4
|
11.6
|
|
|
Jan-23
|
28.3
|
19.6
|
52.1
|
-23.7
|
50.2
|
16.6
|
33.2
|
17.0
|
|
|
Mar-23
|
31.4
|
16.9
|
51.7
|
-20.4
|
49.9
|
15.1
|
35.0
|
15.0
|
|
|
May-23
|
32.1
|
19.0
|
48.9
|
-16.8
|
51.0
|
15.8
|
33.2
|
17.8
|
|
|
Jul-23
|
30.4
|
18.5
|
51.1
|
-20.7
|
51.1
|
15.1
|
33.8
|
17.2
|
|
|
Sep-23
|
36.1
|
19.9
|
44.0
|
-7.9
|
56.8
|
15.1
|
28.1
|
28.6
|
|
|
Nov-23
|
33.1
|
22.5
|
44.4
|
-11.3
|
54.3
|
17.2
|
28.5
|
25.7
|
|
Table 2: Perceptions and Expectations on Employment
|
(Percentage responses)
|
|
Survey Round
|
Current Perception
|
One year ahead Expectation
|
|
Increased
|
Remained Same
|
Decreased
|
Net Response
|
Will Increase
|
Will Remain Same
|
Will Decrease
|
Net Response
|
|
Nov-22
|
31.8
|
18.6
|
49.6
|
-17.8
|
51.5
|
18.3
|
30.3
|
21.2
|
|
Jan-23
|
30.0
|
20.1
|
49.9
|
-19.9
|
51.8
|
18.0
|
30.2
|
21.6
|
|
Mar-23
|
32.2
|
19.9
|
47.9
|
-15.7
|
52.9
|
17.1
|
30.1
|
22.8
|
|
May-23
|
32.1
|
20.2
|
47.7
|
-15.6
|
52.1
|
18.7
|
29.2
|
22.9
|
|
Jul-23
|
30.8
|
21.0
|
48.2
|
-17.5
|
51.4
|
18.3
|
30.3
|
21.1
|
|
Sep-23
|
34.0
|
21.8
|
44.2
|
-10.2
|
55.8
|
18.1
|
26.2
|
29.6
|
|
Nov-23
|
32.3
|
23.0
|
44.7
|
-12.4
|
53.6
|
19.7
|
26.8
|
26.9
|
Table 3: Perceptions and Expectations on Price Level
|
(Percentage responses)
|
|
Survey Round
|
Current Perception
|
One year ahead Expectation
|
|
Increased
|
Remained Same
|
Decreased
|
Net Response
|
Will Increase
|
Will Remain Same
|
Will Decrease
|
Net Response
|
|
Nov-22
|
94.9
|
4.1
|
1.0
|
-93.9
|
82.2
|
9.3
|
8.6
|
-73.6
|
|
Jan-23
|
93.6
|
5.0
|
1.3
|
-92.3
|
83.0
|
10.1
|
7.0
|
-76.1
|
|
Mar-23
|
93.8
|
5.2
|
1.0
|
-92.9
|
84.3
|
9.0
|
6.7
|
-77.5
|
|
May-23
|
92.2
|
6.4
|
1.4
|
-90.8
|
82.7
|
10.0
|
7.3
|
-75.4
|
|
Jul-23
|
92.7
|
6.0
|
1.3
|
-91.4
|
80.9
|
10.2
|
8.9
|
-72.0
|
|
Sep-23
|
91.8
|
6.4
|
1.8
|
-90.0
|
78.4
|
9.9
|
11.7
|
-66.8
|
|
Nov-23
|
91.3
|
7.3
|
1.4
|
-89.9
|
81.0
|
10.2
|
8.8
|
-72.3
|
Table 4: Perceptions and Expectations on Rate of Change in Price Level (Inflation)*
|
(Percentage responses)
|
|
Survey Round
|
Current Perception
|
One year ahead Expectation
|
|
Increased
|
Remained Same
|
Decreased
|
Net Response
|
Will Increase
|
Will Remain Same
|
Will Decrease
|
Net Response
|
|
Nov-22
|
87.5
|
9.2
|
3.3
|
-84.2
|
82.9
|
13.2
|
3.9
|
-79.1
|
|
Jan-23
|
86.5
|
10.5
|
3.0
|
-83.6
|
80.3
|
15.5
|
4.1
|
-76.2
|
|
Mar-23
|
86.5
|
10.0
|
3.5
|
-82.9
|
81.4
|
14.0
|
4.6
|
-76.8
|
|
May-23
|
84.0
|
12.5
|
3.4
|
-80.6
|
81.8
|
14.1
|
4.1
|
-77.8
|
|
Jul-23
|
84.5
|
11.8
|
3.7
|
-80.8
|
80.8
|
14.8
|
4.4
|
-76.4
|
|
Sep-23
|
82.5
|
13.4
|
4.2
|
-78.3
|
79.4
|
15.8
|
4.8
|
-74.6
|
|
Nov-23
|
81.8
|
13.6
|
4.6
|
-77.2
|
80.1
|
14.7
|
5.2
|
-75.0
|
|
*Applicable only for those respondents who felt price has increased/price will increase.
|
Table 5: Perceptions and Expectations on Income
|
(Percentage responses)
|
|
Survey Round
|
Current Perception
|
One year ahead Expectation
|
|
Increased
|
Remained Same
|
Decreased
|
Net Response
|
Will Increase
|
Will Remain Same
|
Will Decrease
|
Net Response
|
|
Nov-22
|
20.9
|
46.1
|
32.9
|
-12.0
|
52.5
|
39.9
|
7.6
|
44.9
|
|
Jan-23
|
21.4
|
49.0
|
29.6
|
-8.3
|
54.5
|
38.7
|
6.9
|
47.6
|
|
Mar-23
|
22.2
|
49.7
|
28.1
|
-5.9
|
54.1
|
38.4
|
7.5
|
46.7
|
|
May-23
|
23.9
|
49.7
|
26.3
|
-2.4
|
53.8
|
39.4
|
6.9
|
46.9
|
|
Jul-23
|
25.4
|
49.9
|
24.8
|
0.6
|
54.7
|
38.6
|
6.7
|
48.0
|
|
Sep-23
|
25.0
|
49.8
|
25.2
|
-0.3
|
55.7
|
37.8
|
6.5
|
49.2
|
|
Nov-23
|
27.2
|
50.1
|
22.7
|
4.5
|
57.9
|
36.0
|
6.1
|
51.8
|
Table 6: Perceptions and Expectations on Spending
|
(Percentage responses)
|
|
Survey Round
|
Current Perception
|
One year ahead Expectation
|
|
Increased
|
Remained Same
|
Decreased
|
Net Response
|
Will Increase
|
Will Remain Same
|
Will Decrease
|
Net Response
|
|
Nov-22
|
74.9
|
19.2
|
5.9
|
69.0
|
75.0
|
20.3
|
4.7
|
70.2
|
|
Jan-23
|
73.9
|
20.6
|
5.5
|
68.4
|
75.5
|
19.8
|
4.7
|
70.8
|
|
Mar-23
|
75.0
|
19.6
|
5.4
|
69.6
|
75.4
|
19.9
|
4.6
|
70.8
|
|
May-23
|
73.4
|
21.3
|
5.3
|
68.1
|
73.8
|
21.7
|
4.6
|
69.2
|
|
Jul-23
|
74.5
|
20.5
|
5.0
|
69.6
|
73.8
|
21.3
|
4.8
|
69.0
|
|
Sep-23
|
74.6
|
20.2
|
5.2
|
69.4
|
75.2
|
20.3
|
4.6
|
70.6
|
|
Nov-23
|
74.8
|
20.6
|
4.6
|
70.1
|
75.0
|
21.0
|
4.1
|
70.9
|
Table 7: Perceptions and Expectations on Spending- Essential Items
|
(Percentage responses)
|
|
Survey Round
|
Current Perception
|
One year ahead Expectation
|
|
Increased
|
Remained Same
|
Decreased
|
Net Response
|
Will Increase
|
Will Remain Same
|
Will Decrease
|
Net Response
|
|
Nov-22
|
84.7
|
11.6
|
3.7
|
81.0
|
81.1
|
15.4
|
3.5
|
77.7
|
|
Jan-23
|
84.1
|
12.3
|
3.6
|
80.5
|
81.3
|
15.2
|
3.5
|
77.8
|
|
Mar-23
|
85.3
|
11.5
|
3.2
|
82.1
|
81.7
|
14.8
|
3.5
|
78.2
|
|
May-23
|
84.0
|
12.8
|
3.2
|
80.8
|
81.3
|
15.2
|
3.5
|
77.8
|
|
Jul-23
|
85.3
|
11.8
|
3.0
|
82.3
|
81.0
|
15.5
|
3.5
|
77.5
|
|
Sep-23
|
84.9
|
11.9
|
3.2
|
81.7
|
82.0
|
14.4
|
3.6
|
78.4
|
|
Nov-23
|
85.7
|
11.4
|
2.9
|
82.7
|
82.3
|
14.4
|
3.4
|
78.9
|
Table 8: Perceptions and Expectations on Spending- Non-Essential Items
|
(Percentage responses)
|
|
Survey Round
|
Current Perception
|
One year ahead Expectation
|
|
Increased
|
Remained Same
|
Decreased
|
Net Response
|
Will Increase
|
Will Remain Same
|
Will Decrease
|
Net Response
|
|
Nov-22
|
22.4
|
33.8
|
43.8
|
-21.4
|
32.8
|
35.1
|
32.2
|
0.6
|
|
Jan-23
|
22.1
|
35.2
|
42.8
|
-20.7
|
31.9
|
38.4
|
29.8
|
2.1
|
|
Mar-23
|
25.2
|
34.8
|
40.0
|
-14.8
|
34.5
|
36.8
|
28.8
|
5.7
|
|
May-23
|
25.8
|
38.2
|
36.1
|
-10.3
|
35.3
|
37.5
|
27.2
|
8.2
|
|
Jul-23
|
26.6
|
36.9
|
36.5
|
-10.0
|
34.8
|
37.6
|
27.6
|
7.3
|
|
Sep-23
|
23.4
|
38.5
|
38.2
|
-14.8
|
33.0
|
38.2
|
28.8
|
4.2
|
|
Nov-23
|
25.2
|
36.6
|
38.2
|
-13.0
|
34.1
|
36.8
|
29.0
|
5.1
|
*****
[1] सर्वेक्षण के परिणाम उत्तरदाताओं के विचारों को दर्शाते हैं, जो जरूरी नहीं कि रिज़र्व बैंक द्वारा साझा किए गए हों। पिछले सर्वेक्षण चक्र के परिणाम बैंक की वेबसाइट पर अक्तूबर 06, 2023 को जारी किए गए थे।
[2] सीएसआई और एफईआई को क्रमशः आर्थिक स्थिति, आय, खर्च, रोजगार और वर्तमान अवधि (एक साल पहले की तुलना में) और एक साल आगे के लिए मूल्य स्तर पर शुद्ध प्रतिक्रियाओं के आधार पर संकलित किया जाता है। सीएसआई और एफईआई = 100 + उपरोक्त मापदंडों की शुद्ध प्रतिक्रियाओं का औसत।
|
 IST,
IST,


