 IST,
IST,
I Overview (Part 1 of 2)
Macroeconomic Developments : 2001-02
Real Sector
Public Finances
Monetary Developments
Macroeconomic Developments : 2001-02
1.1 Macroeconomic prospects for the year 2001-02 remain uncertain with the behaviour of various indicators of economic activity belying the initial expectations of an early upturn. The prevailing uncertainty was reflected in the revisions in growth forecasts for India for the year by various entities ranging widely from 4.5 to over 6.0 per cent.
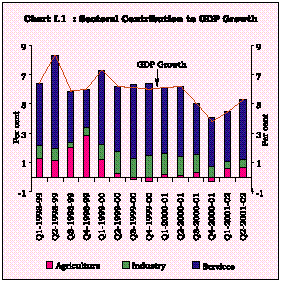
1.2 According to the Quarterly Estimates of Gross Domestic Product (GDP) released by the Central Statistical Organisation (CSO), the growth rate of real GDP at 5.3 per cent in the second quarter of the financial year 2001-02 showed an improvement over 4.4 per cent recorded during the first quarter. However, the growth performance recorded during the first half of the current year remained below the growth rate achieved during the first half of 2000-01. The deceleration during the first half of the current year indicates that the slowdown which began with a decline in the growth rate from 6.6 per cent in 1998-99 to 6.4 per cent in 1999-2000 and then to 5.2 per cent in 2000-01 has continued to persist. The agricultural sector, however, recorded a distinct improvement in performance, supported by a well-distributed monsoon. The kharif foodgrains production touched a new peak in 2001-02. There has been noteworthy improvement in the production of key non-foodgrains such as oilseedsand cotton.The rabi production is also expected to improve over last year's level on account of a favourable North-East monsoon. Procurement operations have raised the stock of foodgrains to the level of 59.1 million tonnes at the end of November, 2001. The ongoing deceleration of growth has mainly reflected the sharp slowdown in the industrial sector. The index of industrial production rose by barely 2.2 per cent during the period April-October, 2001-02 as against 5.9 per cent during the corresponding period of the previous year. The slackening of growth was visible across all major sectors - manufacturing and electricity generation - with mining recording a low growth of 0.5 per cent. Business sentiment remained depressed and the capital markets witnessed subdued investors’ interest. First quarter GDP originating in the service sector posted a growth of 6.4 per cent, reversing five consecutive quarters of deceleration. The improvement in services GDP continued in the second quarter of 2001-02 as it grew by 7.2 per cent. During the second quarter, a moderate improvement in growth was recorded by ‘agriculture and allied activities’, ‘electricity, gas and water supply' and 'financing, insurance, real estate and business services' as compared to their growth in the corresponding quarter of 2000-01. Other sectors witnessed declines in their growth during the same period. The recent sectoral developments have ushered in shifts in the composition of GDP as well as in relative contributions to the overall growth process (Chart I.1).
1.3 The budgetary position of the Centre is experiencing some stress from a cyclical decline of receipts, dampened disinvestments and expansion in expenditure relative to budget estimates. The gross fiscal deficit (GFD) of the Centre is placed at Rs.79,133 crore in April-November, 2001, higher by 23.1 per cent over the level in the first eight months of 2000-01. Inflation conditions turned benign in the absence of demand pressures as well as the supply shocks - revision in fuel prices - which characterised the previous year. Headline inflation fell to a low of 2.2 per cent as on December 22, 2001 as against 8.6 per cent, a year ago; while underlying inflation, reflected in the movement of average wholesale prices also remained lower than the preceding year's level. Reserve money increased by 3.7 per cent during 2001-02 (up to December 28, 2001) as against an increase of 1.7 per cent during the corresponding period of the previous year. The increase in reserve money growth during 2001-02 has been mainly on account of expansion in the net foreign assets of the Reserve Bank. On the other hand, the net domestic assets continued to decline on account of low recourse to refinance and the offsetting of primary monetisation through strategic open market operations. Broad money (M3), during the current fiscal year (up to December 14), grew by 10.4 per cent, marginally higher than the growth of 9.7 per cent (net of India Millennium Deposits (IMDs)) during the comparable period of the previous year. On an annual basis, M3 growth was marginally higher at 15.0 per cent as on December 14, 2001 as against 14.7 per cent (net of IMDs) as on December 15, 2000. Growth in net bank credit to the Government, on a fiscal year basis, remained more or less steady at around 13.0 per cent. Non-food credit, adjusted for scheduled commercial banks' non-SLR investments, decelerated to 11.8 per cent from 18.7 per cent last year, on an annual basis, reflecting the industrial slow down.
1.4 Financial markets reflected the slack in real activity, but remained orderly in view of comfortable liquidity conditions. Call rates were range-bound by the liquidity adjustment facility (LAF) operations. Significant reductions in the Bank Rate and cash reserve requirements in October 2001 drove the call rate down to 3.7 per cent on November 6, 2001 - a low for the year so far - although it has firmed up thereafter. Interest rates on other money market instruments also declined. In the absence of any significant pressure from non-food credit demand, around 98 per cent of the Centre's budgeted gross borrowing programme for 2001-02 was absorbed in the primary segment of the Government securities market by December 28, 2001. The secondary market has been driven by large rallies reflecting surplus liquidity conditions leading to the yield curve shifting downwards and the yield on the benchmark 10-year paper reaching a historic low of 7.8 per cent on December 5, 2001. Subsequently, however, conditions in the gilt market turned volatile with the yields hardening by the end of December 2001. The foreign exchange market was relatively stable during 2001-02 with some fluctuations witnessed during the middle of September after the terrorist attacks in the US; however, stability returned rapidly. Stock prices tended to move generally downward between April-September 2001, with the BSE Sensex touching a 8-year low of 2600 on September 21, 2001 in the wake of market uncertainties. There has been some improvement in the market sentiment in the following months with the BSE Sensex strengthening to 3288 by end-November but thereafter declined to 3262 by end-December following border tensions.
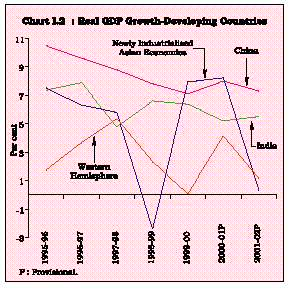
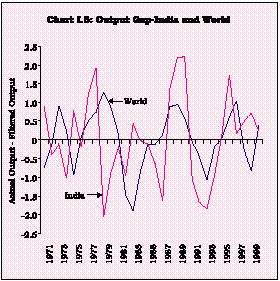
1.5 India's real growth is forecast at 5-6 per cent for the financial year 2001-02 (Reserve Bank of India, October 2001), making it one of the few developing countries which weathered the sharp downturn in global economy (Chart I.2). According to the World Economic Outlook (WEO) of the International Monetary Fund (IMF), global growth for 2001 is now projected at 2.4 per cent and the expectations of an early recovery have also dissipated (December 2001). World trade is expected to grow by 1.0 per cent in 2001 as against 12.4 per cent in the previous year. Reflecting the depressed global demand conditions, India's exports increased only by 0.5 per cent during the first eight months of 2001-02 as against the increase of 21.0 per cent in April-November, last year. POL imports declined by 13.4 per cent while, non-POL imports increased by 8.4 per cent.
1.6 The current account deficit narrowed significantly to US $ 938 million in the first half of 2001-02 as compared with US $ 2,865 million in April-September, 2000 on account of sharp decline in imports. Capital flows during the current year were higher than in the preceding year on account of larger net inflows under foreign direct investment, portfolio investment by foreign institutional investors (FIIs) and external assistance. Reflecting these developments, the foreign exchange reserves rose to US $ 48.1 billion as on December 31, 2001, higher by US $ 5.8 billion over the level of US $ 42.3 billion at end-March 2001 (Table 1.1).
(per cent) | ||||||
Indicator | 2000-01 | 2001-02 | 2000-01 | |||
(fiscal year | (corresponding | |||||
| | | | | | so far) | period last year) |
| 1 | | | 2 | | 3 | 4 |
Real GDP | 5.2 | 5.3 $ | 6.2 $ | |||
Agriculture and Allied Activities | 0.2 | 3.4 $ | 0.5 $ | |||
Industry | 5.3 | 2.4 $ | 5.4 $ | |||
Services | 7.5 | 7.2 $ | 8.5 $ | |||
Index of Industrial Production (IIP) | 5.1 | 2.2 | 5.9 | |||
(up to October) | ||||||
Foodgrains Production (mt) | 196.1 | 105.6 | 103.1 | |||
(kharif) | (kharif) | |||||
Food Stocks (mt) | 45 | 59.1 | 44.5 | |||
(end-November) | (end-November) | |||||
GFD/GDP (ratio) | 5.1 | (RE) | 2.3 | 1.9 | ||
(up to | ||||||
September) | ||||||
Broad Money (M3) | 16.7 | 10.4 | 12.0 | |||
(up to Dec. 14) | ||||||
Net Bank Credit to the Government | 16.1 | 13.0 | 13.1 | |||
(up to | ||||||
December 14) | ||||||
Scheduled Commercial Banks’ | 16.0 | 11.8 | 18.7 | |||
Non-food Credit (Adjusted for non-SLR Investments)# | (as on | |||||
December 14) | ||||||
WPI Inflation (Annual point-to-point) | 4.9 | 2.2 | 8.6 | |||
(as on | (as on | |||||
December 22) | December 23) | |||||
Call Money Borrowing Rate (weighted average) | 9.15 | 7.08 | 8.76 | |||
(December) | (December) | |||||
Yield on 10-Year Government Securities## | 10.23 | 8.0 | 10.94 | |||
(end-March) | (end-December) | (end-December) | ||||
BSE Sensex (Average) | 4269 | 3283 | 4330 | |||
(up to December) | (up to December) | |||||
Exchange Rate (Rupee/US$) | 46.64 | 48.18 | 46.75 | |||
(as on | (as on December | (as on December | ||||
end March) | 31, 2001) | 29, 2000) | ||||
Export Growth Rate (US $ terms) | 21.0 | 0.5 | 21.0 | |||
(up to November) | ||||||
Import Growth Rate (US $ terms) | 1.7 | 1.2 | 7.4 | |||
(up to November) | ||||||
Current Account Deficit (US $ million) | -2,579 | -938 | -2,865 | |||
(up to September) | ||||||
Foreign Investment inflow (US $ million) | 5,099 | 3,294 | 2,314 | |||
(up to October) | ||||||
Non-Resident Deposits inflow (US $ million) | 2,317 | 1,522 | 1,125 | |||
(up to October) | ||||||
Foreign Exchange Reserves* (US $ million) | 42,281 | 48,112 | 40,077 | |||
| | | | | (December 31, 2001) | (December 30,2000) | |
* | : | As at the end of the period. | RE : Revised Estimates | |||
# | : | On a year-on-year basis | mt : Million tonnes. | |||
## | : | On residual maturity basis. | ||||
$ | : | Data pertain to second quarter (July - September) of the respective year. | ||||
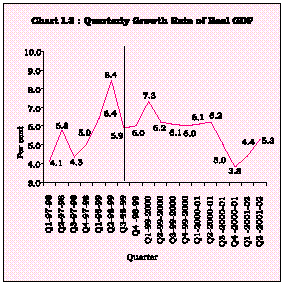
1.7 Real GDP growth in the second quarter of 2001-02 at 5.3 per cent was a moderate improvement over 4.4 per cent recorded in the first quarter of 2001-02 and the trough of 3.8 per cent recorded in the last quarter of 2000-01. However, real GDP growth in the second quarter of 2001-02 was lower at 5.3 per cent as compared with 6.2 per cent in the corresponding quarter of 2000-01. This decline in the growth of GDP is attributed to the declines in the growth rates of both industry and services sectors which have offset the improvement in the growth rate of agriculture. The behaviour of quarterly GDP growth suggests that the current deceleration has taken root since the third quarter of 1998-99 (Chart I.3).
1.8 The decline in GDP growth during the second quarter of the current year has been mainly due to the poor performance of ‘mining and quarrying’, ‘manufacturing’, ‘construction’, ‘trade, hotels, transport and communication’ and ‘community, social and personal services’. On the other hand, ‘agriculture and allied activities’, ‘electricity, gas and water supply’ and ‘financing, insurance, real estate and business services’ experienced some acceleration of growth (Table 1.2).
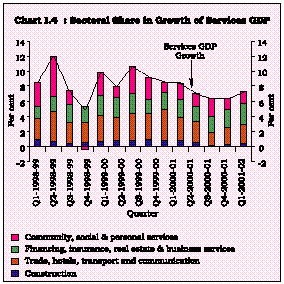
1.9 Intra-sectoral variations in the growth performance of the service sector industries have brought about perceptible shifts in the contribution of each of these industries to the overall output of the services sector (Chart I.4).
Gross Domestic Product | Percentage change | |||||||||
(Rs. crore) | over previous year | |||||||||
1999-2000 | 2000-01 | 2001-02 | 2000-01 | 2001-02 | ||||||
| | Q1 | Q2 | Q1 | Q2 | Q1 | Q2 | Q1 | Q2 | Q1 | Q2 |
1 | 2 | 3 | 4 | 5 | 6 | 7 | 8 | 9 | 10 | 11 |
1. Agriculture, forestry and fishing | 69,715 | 50,200 | 70,167 | 50,428 | 71,813 | 52,121 | 0.6 | 0.5 | 2.3 | 3.4 |
2. Mining and quarrying | 6,162 | 6,242 | 6,473 | 6,481 | 6,473 | 6,519 | 5.0 | 3.8 | 0.0 | 0.6 |
3. Manufacturing | 46,980 | 47,727 | 50,248 | 50,590 | 51,397 | 51,770 | 7.0 | 6.0 | 2.3 | 2.3 |
4. Electricity, gas and | ||||||||||
water supply | 6,882 | 7,086 | 7,271 | 7,299 | 7,510 | 7,650 | 5.7 | 3.0 | 3.3 | 4.8 |
5. Construction | 14,034 | 13,864 | 15,206 | 15,032 | 15,584 | 15,652 | 8.4 | 8.4 | 2.5 | 4.1 |
6. Trade, hotels, transport and | ||||||||||
communication | 58,627 | 58,390 | 64,293 | 62,629 | 67,667 | 66,522 | 9.7 | 7.3 | 5.2 | 6.2 |
7. Financing, insurance, real | ||||||||||
estate and business services | 34,958 | 35,371 | 38,270 | 38,842 | 42,060 | 43,124 | 9.5 | 9.8 | 9.911.0 | |
8. Community, social and | ||||||||||
personal services | 33,255 | 34,726 | 35,240 | 37,938 | 37,437 | 40,240 | 6.0 | 9.3 | 6.2 | 6.1 |
GDP at factor cost | 2,70,613 | 2,53,607 | 2,87,168 | 2,69,241 | 2,99,941 | 2,83,599 | 6.1 | 6.2 | 4.4 | 5.3 |
@ : at 1993-94 prices. | ||||||||||
Note : Q1: April-June and Q2: July-September. | ||||||||||
1.10 There is evidence of increasing co-movement between the variability of real activity in India and the variability of world output indicating that the Indian economy is not completely insulated from the turns and phases of the global business cycle. India's openness to cross-border trade and private capital has increased considerably in the 1990s in response to structural reforms including external financial liberalisation. The impact of globalisation on the economy has been somewhat symmetric with gains accruing from expansion in world activity as well as contraction occurring in tandem with global slowdown (Chart I.5).
Saving and Investment
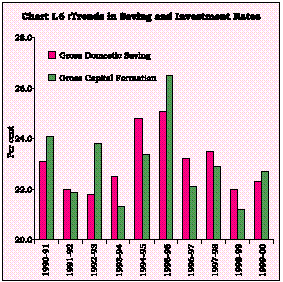
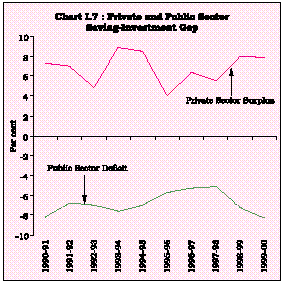
1.11 The saving and gross capital formation rates were estimated higher at 22.3 per cent and 22.7 per cent in 1999-2000, respectively, as compared to 22.0 per cent and 21.2 per cent, respectively, during 1998-99 (Chart 1.6). The process of consolidation of macro-balances continued during the 1990s. The saving-investment (adjusted for errors and omissions) gap narrowed down from 1.5 per cent in 1997-98 to remain at 1.0 per cent in 1998-99 and 1999-2000. Another underlying development is the deterioration in the rate of public saving-investment deficit without commensurate improvement in the rate of private sector surplus (Chart I.7).
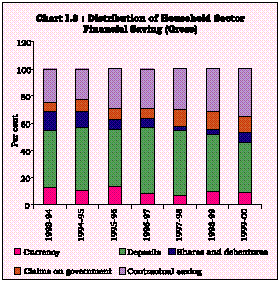
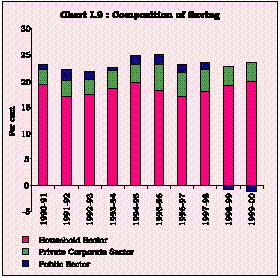
1.12 The household saving, which has a predominant share in domestic saving, has undergone shifts in the pattern of mobilisation with the share of deposits and contractual savings remaining high (Chart I.8). Corporate sector saving has shown a declining trend in the second half of the 1990s. Public sector saving became negative in 1998-99 and has worsened thereafter (Chart I.9).
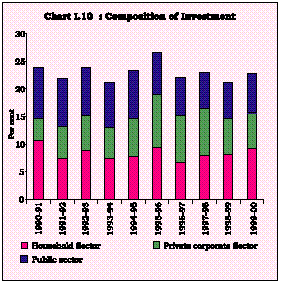
1.13 The investment rate has moved in tandem with the saving rate. All the constituent sectors, except the private corporate sector, recorded increases in the rates of capital formation during 1998-2000 (Chart I.10).
Agriculture
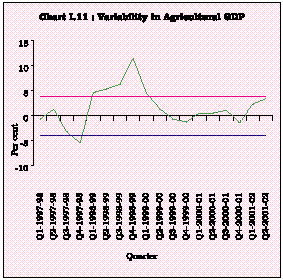
1.14 The GDP growth in 'agriculture and allied activities' improved to 2.3 per cent in the first quarter of 2001-02, as compared with 0.6 per cent in the corresponding quarter of the previous year, reversing the absolute decline which occurred in the last quarter of 2000-01. In the second quarter, the performance of the ‘agriculture and allied activities’ improved further to 3.4 per cent as against 0.5 per cent during the corresponding period of the previous year. In the recent period, there has been some dampening of the variability of GDP growth in agriculture (measured in terms of the deviations from limits set by +/- one standard deviation) although this appears to be associated with the slowing down of growth (Chart I.11).
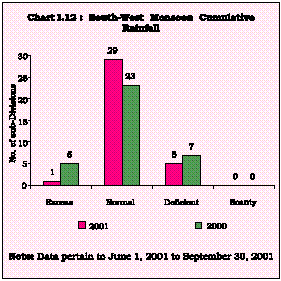
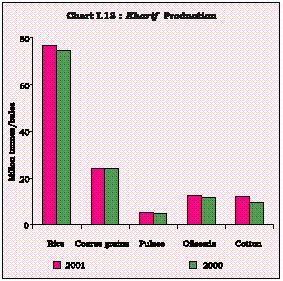
1.15 According to the latest information available from the Union Ministry of Agriculture, the overall kharif foodgrain production for 2001-02 was at a record 105.59 million tonnes. Rice production at 76.4 million tonnes was higher by 2.0 million tonnes than in the previous year, while pulses also recorded a rise in production. The increase in rice production is mainly attributable to the favourable distribution of rainfall during South-West monsoon 2001, which resulted in yield gains, despite a reported fall in acreage. This year's South-West monsoon had a precipitation of 90 per cent of the Long Period Average, but was characterised by better spatio-temporal distribution (Chart I.12). Chattisgarh, Gujarat, Madhya Pradesh and Rajasthan received excess/normal rainfall, thus relieving the water scarcity conditions that were experienced in these States in the previous two years. The output of coarse cereals, however, witnessed a marginal decline to 23.9 million tonnes from the previousyear's level of 24.0 million tonnes, despite an area increase.
The production of kharif oilseeds recovered from the poor performance of the previous two years, especially that of groundnut and soyabean, though the output of castorseed and sunflower declined. The improved performance of groundnut and soyabean took the kharif oilseeds production in 2001-02 to 12.5 million tonnes from the previous year's level of 11.6 million tonnes. Much of the increased production can be attributed to rise in productivity. Output of cotton at 12.3 million bales is also higher than that in the previous year (Chart I.13). The production of sugarcane at 280.0 million tonnes, however, is less than the previous year's record production of 300.3 million tonnes (Table 1.3).
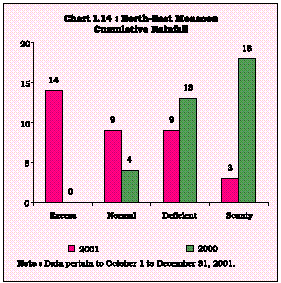
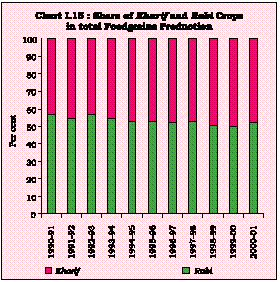
1.16 The North-East monsoon 2001 has also been satisfactory with 23 sub-divisions receiving excess to normal rainfall, with the number of sub-divisions receiving deficient/ scanty rainfall declining from 31 in 2000 to 12 in the current year (up to December 31, 2001) (Chart I.14). In recent years, consistent increase in wheat production has blurred the compositional distinction between kharif and rabi foodgrains output, with the latter accounting for around 50 per cent of the total foodgrains production (Chart I.15).
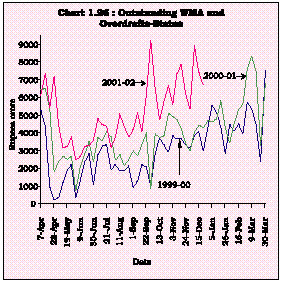
1.33 The information on the fiscal outturn of the State Governments during the current year so far is not available. However, the recourse to WMA from the Reserve Bank in the current fiscal year 2001-02 so far (up to December 21, 2001) generally remained higher than that in the previous year and reveals some pressure on State finances. The outstanding WMA and overdrafts from the Reserve Bank as on December 21, 2001 amounted to Rs. 6,720 crore as against Rs.4,305 crore as on December 22, 2000 (Chart I.26).
1.34 For the fiscal year 2001-02, States were allocated gross and net market borrowings of Rs.14,304 crore and Rs.12,857 crore, respectively. The State Governments have raised an amount of Rs.11,849 crore, constituting 82.84 per cent of the gross market borrowings programme for the full fiscal year (up to December 28, 2001). The amount was raised through pre-announced issues (including taps) as well as through auctions. The interest rate varied in the range of 8.37 per cent to 10.53 per cent in 2001-02 (up to December 28, 2001) as against 10.50 per cent to 12.00 per cent in the previous year (2000-01).
1.35 In April 2001, the monetary and credit policy for 2001-02 was announced against the background of comfortable liquidity conditions and orderly financial markets. In pursuance of the monetary stance of ensuring adequate credit consistent with price stability, the Reserve Bank undertook to continue its policy of active management of liquidity through the liquidity adjustment facility (LAF) supported by strategic open market operations (OMO) and further reductions in the cash reserve ratio (CRR) if warranted. The Reserve Bank also indicated its policy intention of maintaining the current interest rate environment with a preference for softening over the medium-term unless underlying conditions changed dramatically. In April 2001, monetary policy was framed in the context of a real GDP growth forecast at 6-6.5 per cent under the assumptions of an industrial recovery from the second quarter of 2001-02, a reasonable monsoon, and a good performance of exports. Inflation was placed within 5 per cent. Indicative projections for M3 at 14.5 per cent and commercial banks’ non-food credit adjusted for non-SLR investments at 16-17 per cent were made consistent with the macroeconomic forecasts. The LAF, which has emerged as an effective and flexible instrument for influencing liquidity on a day-to-day basis, moved into its second stage in May 2001. Variable rate repos replaced the collateralised lending facility and Level I support to primary dealers (PDs). Standing refinance facilities were rationalised and a back-stop facility was introduced at market-related rates of interest. LAF operating procedures were recast to improve operational flexibility. In the first graduated move towards enabling the call money market to evolve into a pure inter-bank market, lending by non-banks was reduced to 85 per cent of their average daily lendings in the call money market in 2000-01 from May 5, 2001. Other measures such as shortening of the minimum maturity of wholesale deposits from 15 days to 7 days, revision in the daily minimum maintenance of CRR to 50 per cent for the first seven days of the reporting fortnight and 65 per cent for the next seven days and exemption of inter-bank term liabilities from the minimum CRR of 3 per cent on net demand and time liabilities were undertaken to improve the functioning of the money market and thereby, the transmission of monetary policy.
1.36 The mid-term review of the monetary and credit policy in October 2001 took into account the unfavourable performance of the industrial sector relative to initial expectations, the sluggishness in infrastructure industries, the decline in exports amidst a heightening of global uncertainty, and the slack in the off-take of non-food credit to revise the growth forecast for the year to 5-6 per cent. The announced stance of monetary policy was persevered with - to continue active liquidity management with strategic combinations of instruments. In keeping with the indicated preference for a softer interest rate environment, the Bank Rate was reduced by 50 basis points to 6.5 per cent and the CRR by 200 basis points. However, all the exemptions on the liabilities, except inter-bank liabilities, were withdrawn for the computation of net demand and time liabilities for the purpose of CRR. These measures are expected to contribute to money market development and to the conduct of monetary policy, besides the overarching objective of creating conditions for a revival of growth with low inflation. Financial sector reforms were carried forward and the development of the money and government securities segments of the financial market gathered momentum. The projections for monetary and credit growth remained unchanged.
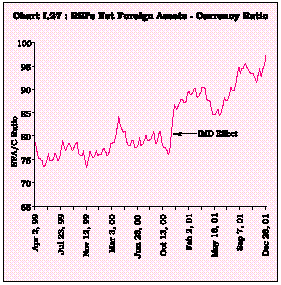
1.37 Reserve money expansion (up to December 28, 2001) was of the order of 3.7 per cent as against 1.7 per cent during the corresponding period of last year, primarily driven by the steady accretion to the Reserve Bank’s foreign currency assets (net of revaluation) which rose by Rs. 26,217 crore during 2001-02 so far as against Rs. 12,900 crore last year. Currency in circulation expanded by 9.6 per cent as against 8.1 per cent last year. The ratio of net foreign assets (NFA) to currency, a leading indicator of the impact of the balance of payments on the domestic economy, has steadily improved during the year to reach 97.1 per cent as on December 28, 2001 (Chart I.27).
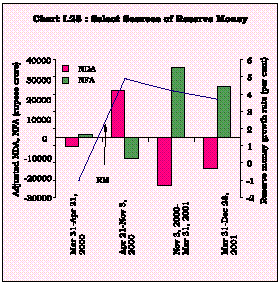
1.38 The net domestic assets (NDA) (adjusted for revaluation) of the Reserve Bank (upto December 28, 2001) underwent a compensating decline of Rs.15,141 crore on top of a decline of Rs.8,036 crore last year (Chart I.28). The net Reserve Bank credit to the Central Government declined by 3.7 per cent as against an increase of 2.2 per cent during the corresponding period of 2000-01. The Reserve Bank's subscription to the Centre's fresh dated securities at Rs.25,679 crore (at face value), was more than offset by net open market sales which amounted to Rs.30,187 crore. Recourse to refinance by commercial banks increased by Rs. 1,944 crore while that by PDs declined by Rs.1,814 crore.
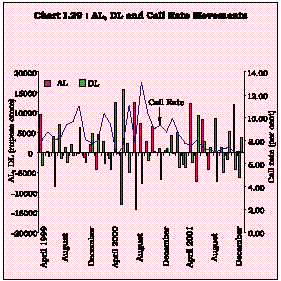
1.39 Since 1999-2000, i.e., with the introduction of the LAF as an interim facility, the Reserve Bank has been modulating market liquidity by strategically counterbalancing autonomous liquidity (AL)1 with discretionary liquidity (DL) in order to ensure stability in the money market conditions (Chart I.29).
1.40 The progressive movement towards indirect instruments of monetary policy in India has impacted upon the behaviour of reserve money, as policy impulses embodied in changes in the Reserve Bank's balance sheet are being transmitted through the market to the balance sheets of commercial banks. Accordingly, the movements in selected elements of reserve money are increasingly reflecting the Reserve Bank's market operations (Table 1.6).
(Rupees crore) | ||||||||
Variable | June | September | December | March | June | September | December | |
30,2000 | 22, 2000 | 29, 2000 | 31, 2001 | 29, 2001 | 21, 2001 | 28, 2001 | ||
Over | Over | Over | Over | Over | Over | Over | ||
March | June | September | December | March | June | September | ||
| | | 31, 2000 | 30, 2000 | 22, 2000 | 29, 2000 | 31, 2001 | 29, 2001 | 21, 2001 |
1 | | 2 | 3 | 4 | 5 | 6 | 7 | 8 |
Net Reserve Bank Credit to the | 14,393 | -6,225 | -5,127 | 3,664 | 19,523 | -20,140 | -4,770 | |
Centre (1+2+3+4-5) | (10.3) | (-4.0) | (-3.5) | (2.6) | (13.3) | (-12.1) | (-3.3) | |
1 | Loans and Advances | 4,316 | -5,298 | 0 | 5,395 | 3,619 | -7,791 | -1,223 |
2 | Treasury Bills held by the | |||||||
Reserve Bank | 5 | 2,001 | -2,375 | -1,019 | -3 | -480 | 0 | |
3 | Reserve Bank’s Holdings of Dated | |||||||
Securities | 7,936 | -2,985 | -2,593 | 1,944 | 13,150 | -11,907 | -3,529 | |
3.1 Central Government Securities | 7,700 | -2,985 | -2,593 | 1,944 | 13,150 | -11,907 | -4,327 | |
4 | Reserve Bank’s Holdings of | |||||||
Rupee Coins | 13 | 58 | -159 | 63 | 39 | 38 | -18 | |
5 | Central Government Deposits | -2,123 | 0 | 0 | 2,719 | -2,718 | 0 | -1 |
Memo Items* | ||||||||
1 | Market Borrowings of Dated | 33,683 | 30,500 | 26,000 | 10,000 | 46,000 | 31,000 | 24,000 |
Securities by the Centre # | ||||||||
2 | Reserve Bank’s Primary | 6,961 | 22,815 | 1,374 | 0 | 21,000 | 679 | 4,000 |
Subscription to Dated Securities | ||||||||
3 | Repos (-) / Reverse Repos (+) (LAF), | 0 | -10,570 | 11,130 | -1,915 | 1,355 | 1,410 | -1,160 |
net position | ||||||||
4 | Net Open Market Sales # | 1,528 | 4,259 | 13,304 | 128 | 10,929 | 13,985 | 5,273 |
5 | Primary Operations | 13,412 | 17,575 | 1,215 | 2,739 | 27,376 | -7,074 | 2,759 |
* | : At face value. | |||||||
# | : Excludes Treasury Bills. | |||||||
Parenthetic figures constitute percentage variations. | ||||||||
2000-01 | 2001-02 (up to | 2000-01 (up to | ||||||
Indicator | | | December 14) | December 15) | ||||
Point to | Monthly | Absolute | Per cent | Absolute | Per cent | |||
Point | Average | (Rupees Crore) | (Rupees Crore) | |||||
(Per cent) | Basis | |||||||
| | | (Per cent) | | | | | ||
1 | 2 | 3 | 4 | 5 | 6 | 7 | ||
Reserve Money * | 8.1 | 7.8 | 11,076 | 3.7 | 4,864 | 1.7 | ||
Broad Money (M3) | 16.7 | 15.8 | 1,35,921 | 10.4 | 1,34,729 | 12.0 | ||
(14.4) | (9.7) | |||||||
Currency with the Public | 10.8 | 9.2 | 24,245 | 11.6 | 18,197 | 9.6 | ||
Aggregate Deposits | 17.8 | 17.3 | 1,12,227 | 10.2 | 1,17,158 | 12.6 | ||
Net Bank Credit to Government | 16.1 | 13.8 | 66,579 | 13.0 | 57,644 | 13.1 | ||
Bank Credit to Commercial Sector | 14.8 | 20.0 | 38,674 | 5.7 | 52,875 | 9.0 | ||
Net Foreign Exchange Assets | 21.5 | 17.9 | 31,816 | 12.7 | 26,870 | 13.1 | ||
of the Banking Sector | | | | | | | ||
* Up to December 28, 2001 and the corresponding period of the previous year. | Data are provisional. | |||||||
Parenthetic figures are net of IMDs. | ||||||||
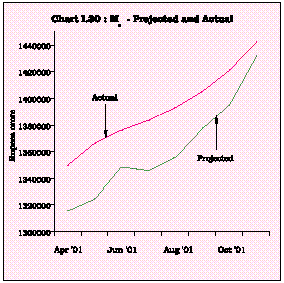
1.41 Broad money (M3) increased by 10.4 per cent during the current fiscal year so far (up to December 14) as against 12.0 per cent (9.7 per cent, net of IMDs) during the comparable period of 2000-01 (Table 1.7). Aggregate deposits increased by 10.2 per cent during the year so far from 12.6 per cent (9.8 per cent net of IMDs) last year. On an annual basis, the rate of growth was 15.0 per cent as on December 14, 2001 in M3 as against 17.1 per cent (14.7 per cent net of IMDs) last year, broadly in alignment with the indicative projections set out in the monetary and credit policy statement for 2001-02 (net (Chart I.30). The average year-on-year M3 of RIBs/IMDs) growth rate decelerated to 15.1 per cent as on December 14, 2001 from 15.8 per cent as on December 15, 2000.
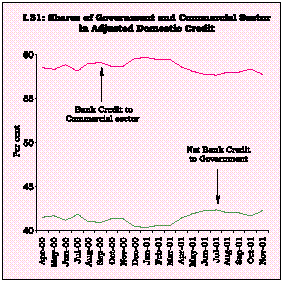
1.42 Domestic credit (inclusive of commercial banks’ non-SLR investments) decelerated to 8.7 per cent during the current fiscal year (up to December 14, 2001) from 10.7 per cent during the corresponding period of the previous year largely on account of lower non-food credit off-take. Net bank credit to the Government, during this period, increased by 13.0 per cent –comparable to 13.1 per cent during the corresponding period of the previous year. Bank credit to the commercial sector decelerated to 5.7 per cent from 9.0 per cent during the comparative period of 2000-01. In the absence of any noticeable pick-up in the demand for bank credit by the commercial sector in the first half of the year, banks predominantly invested in Government paper and accordingly, the share of net bank credit to Government was consistently around 42.0 per cent of adjusted domestic credit (Chart I.31).
1.43 An analysis of the behaviour of the commercial banking indicators during the year 2001-02 (up to December 14) based on the fortnightly returns received from scheduled commercial banks under Section 42(2) of the Reserve Bank of India Act, 1934 brings to the fore several developments which assume relevance in the context of the current deceleration. First, time deposit growth at 12.2 per cent was somewhat higher than the level of the preceding year (11.7 per cent excluding IMDs) despite the decline in interest rates across the spectrum. This could be reflecting safe haven effects in the face of the general uncertainty prevailing in other segments of the financial market. The average fortnightly increase in time deposits works out substantially higher at Rs.5,267 crore during 2001-02 so far, as against Rs.4,216 crore (excluding IMDs) recorded during 2000-01 (up to December 15). Secondly, the average fortnightly increase in non-food credit, on the other hand, was much lower at Rs.1,341 crore than Rs.2,019 crore last year. The growth in non-food credit (adjusted to include the non-SLR investments), at 5.4 per cent during the current financial year was also lower than 9.3 per cent recorded in 2000-01 (up to December 15). Food credit, during this year, showed a lower growth of 29.4 per cent than 43.8 per cent recorded during the corresponding period of 2000-01. The strong deposit accretion without a commensurate credit off-take has resulted in a build up of substantial liquidity with the banks. Thirdly, the investment in government securities was higher at 17.4 per cent during 2001-02 so far as against 16.8 per cent during 2000-01 (up to December 15) (Table 1.8).
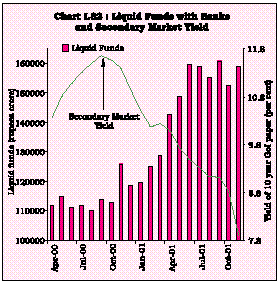
1.44 On an annualised basis, aggregate deposits of scheduled commercial banks showed a steady accretion of 15.3 per cent – comparable to 15.2 per cent (net of IMDs) last year. Non-food credit growth, adjusted for non-SLR investments of scheduled commercial banks, as on December 14, 2001, was lower at 11.8 per cent, as against 18.7 per cent as on December 15, 2000. Scheduled commercial banks' investments in government securities accelerated to 22.8 per cent as on December 14, 2001 from 20.5 per cent as on December 15, 2000. Commercial banks' holding of government securities during the year so far has consistently been around 35.0 per cent of the net demand and time liabilities (NDTL) - much higher than the prescribed Statutory Liquidity Ratio (SLR). The inflow of the excess liquid funds of the commercial banks into the government securities market contributed to reducing the secondary market yields of Government securities over the spectrum (Chart I.32).
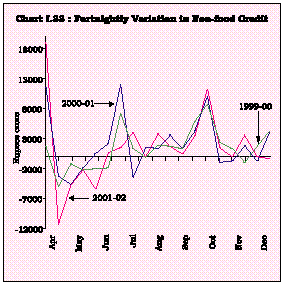
1.45 The low non-food credit off-take reflects, to a large extent, the sluggish performance of the industrial sector as well as the depressed investment climate. However, there has been an increase in non-food credit off-take since the latter half of September 2001 with the major part (Rs.19,830 crore) of the total incremental non-food credit (Rs.25,484 crore) during the current fiscal year so far attributable to the period of September 7 - November 16, 2001. (Chart I.33).
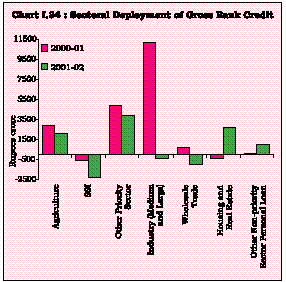
1.46 An analysis of the deployment of non-food gross bank credit of select scheduled commercial banks during 2001-02 so far (up to September) suggests that the priority sector credit off-take decelerated to 2.4 per cent (from 5.4 per during the corresponding period of the previous year) driven by lower credit off-take in agriculture (4.0 per cent as against 6.4 per cent last year) and other priority sectors (8.4 per cent from 14.1 per cent last year). Bank credit to the small-scale industries registered a decline (4.2 per cent on top of a decline of 1.1 per cent during April-September 2000). The credit availed by wholesale trade (other than food procurement) declined by 5.6 per cent (increased by 4.3 per cent last year) while that by the medium- and large-scale industries declined by 0.3 per cent (in contrast to an increase of 7.6 per cent last year).
1.47 A sectoral analysis shows that the slowdown of credit off-take in medium- and large-scale industry had been the principal source of the overall slowdown of credit off-take during the year so far (Table 1.9 and Chart I.34).
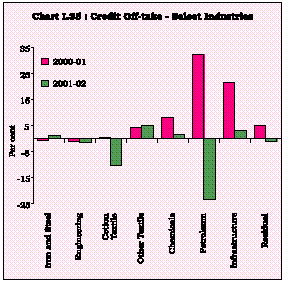
1.48 The industry-wise deployment of gross bank credit shows that most of the industries have exhibited deceleration/decline in terms of credit off-take during the financial year so far. Amongst the principal industries, credit off-take improved only in case of iron and steel (an increase of 1.1 per cent as against a decline of 0.9 per cent last year) and other textile (5.0 per cent as against 4.2 per cent) industries. On the other hand, for industries like infrastructure (3.2 per cent growth as against 21.6 per cent), cotton textiles (a decline of 10.0 per cent as against a growth of 0.5 per cent), chemicals, dyes, paints, etc., (1.7 per cent growth as against 8.0 per cent) and petroleum (a decline of 23.4 per cent as against a growth of 32.5 per cent), credit demand slowed down significantly (Chart I.35).
The Price Situation
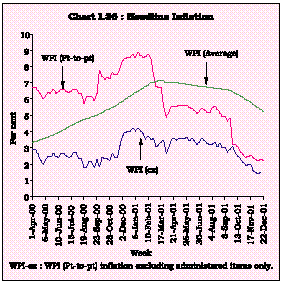
1.49 Inflation in 2001-02 represents a combination of factors - waning of the effect of successive rounds of administered price revisions in 2000-01, the improvement in agricultural production and the continuing slack in manufacturing prices - and the absence of demand pressures - sluggishness in the investment demand, excess capacities in various industries and inventory accumulation - along with a moderate firming up of primary articles prices. The annual point-to-point wholesale price index (WPI) inflation declined from 5.1 per cent at the beginning of the year to a low of 2.2 per cent as on December 22, 2001 as compared with 8.6 per cent as on December 23, 2000. The upward movement in inflation on account of the administered price revisions in 2000-01 imparted a statistical bias, vitiating comparisons of the current year's inflation with that in the preceding year. This is further corroborated by the movement of WPI inflation excluding the effect of administered price hikes on a point-to-point basis (WPI-ex) which remains vertically below the actual inflation for a greater part of the year on account of the wedge caused by the price revisions last year (Chart I.36).
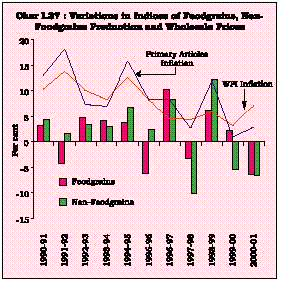
1.50 Average annual WPI inflation, measuring underlying inflation (as against the official measure of headline inflation on the basis of year-on-year WPI movements) has been falling consistently during the year, decelerating to 5.2 per cent as on December 22, 2001 from 6.2 per cent during the corresponding period last year. During the financial year so far up to December 15, 2001, on an average basis, primary articles inflation accelerated to 3.9 per cent from 3.2 per cent during the corresponding period last year, mainly on account of lagged effects of variability in agricultural production in terms of foodgrains and non-foodgrains production (Chart I.37). On the other hand, the fuel inflation dropped significantly to 8.6 per cent as on December 15, 2001 from 25.2 per cent a year ago. Manufacturing inflation also decelerated to 1.9 per cent from 2.6 per cent during the corresponding period of the last year, explained partly by the lower input costs for industrial production (including lower fuel price inflation), improved kharif production and the global decline in the prices of manufactures.
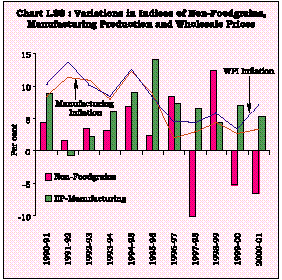
1.51 The fall in inflation during the year is the result of significant deceleration in fuel inflation (on account of base effect correction) and low manufacturing inflation, as apparently industrial prices are leading the current disinflation (Chart I.38). Identifying and understanding the sensitivity of prices to cycles in agricultural and industrial activity will, therefore, help to gauge the prospects of the recovery.
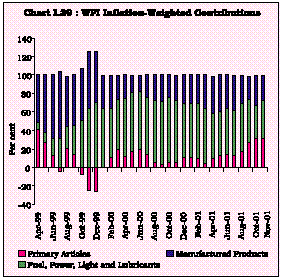
1.52 During the current financial year so far (up to December 15, 2001), on an average basis, the fuel group contributed the maximum to inflation with a share of 45.5 per cent even though it was substantially lower than that of 63.1 per cent during the corresponding period of the last year. This was followed by the manufactured products and primary articles groups' contributions at 30.7 per cent and 24.8 per cent as against 24.9 per cent and 12.2 per cent, respectively, during the comparable period a year ago. On a monthly average basis also the fuel group contributed the maximum to the price rise during the year so far (Chart I.39).
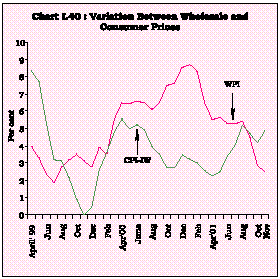
1.53 The inflation rate at the retail level, as measured by the annual variation in consumer price index for industrial workers (CPI-IW) on a point-to-point basis, increased to 4.9 per cent in November 2001 from 2.7 per cent in November 2000 (moving within a range of 2.5-5.5 per cent in 2000-01), reflecting mainly the upward trend in the prices of food items. Thus, in recent years, there is divergent movement between the consumer price inflation and wholesale price inflation (Chart I.40).
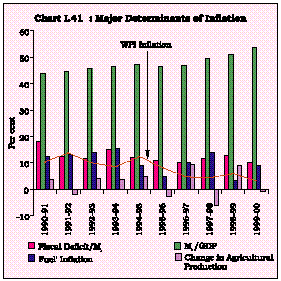
1.54 The new lows reached in India's inflation record during 2001-02 and falling inflation worldwide has opened up the debate on the costs associated with the disinflation. This raises the issue of the effectiveness of monetary policy in a phase of economic slowdown in India. It also brings to the forefront the need to appropriately assess inflationary conditions - partly in view of the divergent movements of different measures of inflation in recent years - with a view to getting a 'fix' on inflationary expectations for setting forward-looking monetary policy (Chart I. 41).
पृष्ठ अंतिम बार अपडेट किया गया:


