 IST,
IST,


II. Fiscal Situation
Combined Government Finances: 2008-09 An overview of the combined finances of the Central and State Governments budgeted for 2008-09 suggests further strengthening of the fiscal consolidation process. The key deficit indicators are budgeted to decline over the revised estimates for 2007-08, both in absolute terms and as percentage of GDP. Primary balance, which turned surplus in 2007-08 (RE), is budgeted to record a higher surplus of 0.8 per cent of GDP in 2008-09 (BE) (Table 16). The improvement in combined finances would primarily reflect the strengthening of the State Governments' finances, the revenue account of which is in surplus, and reduction in the revenue deficit of the Central Government under the rule-based Fiscal Responsibility and Budget Management (FRBM) framework. The buoyant tax receipts are expected to increase the revenue receipts (by 0.4 per cent of GDP in 2008-09), while revenue expenditure as a proportion of GDP would be maintained at the 2007-08 (RE) level. As a result, the combined revenue deficit in 2008-09 is budgeted to decline by 0.4 per cent of GDP. The anticipated improvement in the revenue account is expected to contribute significantly in bringing down the combined gross fiscal deficit (GFD) by 0.7 per cent of GDP in 2008-09.
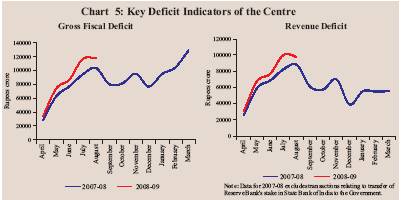
Centre's Fiscal Situation: 2008-09 Available information on Central Government finances for the first five months of 2008-09 (April-August) from the Controller General of Accounts indicates that GFD as well as revenue deficit were higher than a year ago (Chart 5). As proportion to GDP, revenue deficit at 1.8 per cent during 2008-09 (April-August) was higher than that of 1.1 per cent in the corresponding period of the preceding year. Adjusting for transfer of profit on sale of Reserve Bank's stake in the State Bank of India (SBI) to the Central Government (included under non-tax revenue1), however, revenue deficit as per cent of GDP had constituted 2.0 per cent in April-August 2007. GFD at 2.2 per cent of GDP during April-August 2008 was the same as that of April-August 2007. An analysis of the pattern of Central Government finances during April-August 2008 shows that despite buoyant net tax revenue which registered a growth of 26.2 per cent during April-August 2008 over the same period of the preceding year, revenue receipts as a proportion of budget estimates were lower than those of the preceding year. However, adjusting for transfer of profit on sale of Reserve Bank's stake in the SBI to the Central Government in 2007, revenue receipts showed a marginal increase over the preceding year. As proportion of budget estimates, revenue expenditure at 39.4 per cent was marginally higher than in April-August 2007 (39.0 per cent) on account of higher expenditure on food and fertiliser subsidies, pension and rural development than a year ago. Consequently, during April-August 2008, revenue deficit was 177.4 per cent of budget estimates for 2008-09 as compared with 74.9 per cent (122.9 per cent, net of transfer of profit on sale of Reserve Bank’s stake in SBI to the Central Government) a year ago. Aggregate expenditure as per cent of budget estimates (adjusting for acquisition cost of transfer of Reserve Bank's stake in SBI in 2007) was higher in April-August 2008 than in April-August 2007, primarily on account of rise in revenue expenditure. GFD during the same period was 87.7 per cent of the budget estimates as compared with 68.5 per cent in April-August 2007. As against a primary surplus of Rs.57,520 crore budgeted for 2008-09, the Centre recorded a gross primary deficit of Rs.51,049 crore during the first five months of the year (Table 17).
Cash Management and Central Government Market Borrowings During 2008-09 (up to October 14, 2008), the actual issuances of dated securities amounted to Rs.1,06,000 crore. All the issuances were in accordance with the issuance calendar for the first half of the year, except on two occasions. In the auction of July 24, 2008, a 10-year benchmark security was issued in place of a higher maturity security in view of uncertain market conditions. An unscheduled auction of dated securities amounting to Rs.10,000 crore was held on September 26, 2008, keeping in view the emerging requirements of the Government, market conditions and other relevant factors. The issuance calendar for dated securities for the second half of 2008-09 (October-March) was released on September 26, 2008 in consultation with the Central Government to raise Rs.39,000 crore. The auction scheduled for October 10, 2008 for dated securities amounting to Rs.10,000 crore was cancelled in view of the prevailing liquidity conditions and other relevant factors. All auctions during 2008-09 (up to October 14, 2008) were for reissuance of existing securities, barring one new issue of 10-year maturity. There was a devolvement of Rs.2,420 crore on primary dealers (PDs) during 2008-09 (up to October 14, 2008) as compared with no devolvement during the corresponding period of the previous year. The bid-cover ratio ranged between 1.42 and 3.49. Gross and net market borrowings (dated securities and 364-day Treasury Bills) during 2008-09 (up to October 14, 2008) amounted to Rs.1,27,872 crore and Rs.64,808 crore, respectively, accounting for 72.8 per cent and 65.5 per cent of the estimated market borrowings for the year. During the corresponding period of the previous year, gross and net borrowings accounted for 60.7 per cent and 63.0 per cent, respectively. The weighted average maturity of dated securities issued during 2008-09 (up to October 14, 2008) at 15.54 years was higher than 14.25 years during the corresponding period of the previous year. The weighted average yield of dated securities issued during the same period increased to 8.80 per cent from 8.21 per cent (Table 18).
The notified amounts for 91-day, 182-day and 364-day Treasury Bills were kept unchanged in the issuance calendar for 2008-09. However, the notified amounts (excluding issuances under Market Stabilisation Scheme) in respect of all three Treasury Bills were raised during the course of the year to finance the temporary cash mismatch, inter alia, anticipated to arise from the expenditure on farmers' debt waiver scheme. Thus, during 2008-09 (up to October 13, 2008) an additional amount of Rs.51,500 crore (Rs.32,500 crore, net) was raised over and above the notified amount in the calendar. During 2008-09 (up to October 14, 2008), the Central Government took recourse to ways and means advances for 16 days as compared with 91 days during the corresponding period of 2007-08. Commencing the year with a surplus cash balance of Rs.76,686 crore (end-March 2008), the Central Government used up these balances to meet its expenditure needs and resorted to WMA between August 4, 2008 and August 6, 2008. With inflow of indirect taxes and surplus transferred from the Reserve Bank, the cash balances turned into surplus between August 7, 2008 and September 1, 2008. The Central Government again resorted to WMA during September 2-14, 2008 to meet the mismatches in receipts and expenditure. As on October 13, 2008 the Central Government maintained a surplus cash balance of Rs. 35,467 crore with the Reserve Bank. The average daily utilisation of WMA by the Central Government (up to September 30, 2008) was Rs.411 crore as compared with Rs.8,510 crore in the corresponding period of the preceding year. The Centre had also availed of overdraft during the corresponding period of the preceding year, the daily average being placed at Rs.1,297 crore. State Finances: 2008-09 The consolidated fiscal position of the State Governments as revealed in their budgets for 2008-09 indicates further improvement, with the revenue surplus budgeted higher at 0.54 per cent of GDP as compared with 0.48 per cent during the previous year. Accordingly, GFD is budgeted lower at 2.1 per cent of GDP in 2008-09 (BE) as compared with 2.3 per cent in 2007-08 (RE). However, the primary account would remain in deficit of 0.1 per cent of GDP in 2008-09 (BE) as in the previous year (see Table 16). Cash Management and State Government Market Borrowings The provisional net allocation under market borrowing programme of the State Governments for 2008-09 is placed at Rs.44,691 crore. Taking into account repayments of Rs.14,371 crore, the gross market borrowings of the State Governments are estimated at Rs.59,062 crore. During 2008-09 (up to October 14, 2008), 11 State Governments and the Union Territory of Puducherry raised a total amount of Rs.17,896 crore through auctions with cutoff yields in the range 8.39-9.90 per cent as compared with Rs.20,362 crore by 19 State Governments (cut-off yields in the range 8.00-8.90 per cent) during the corresponding period of the previous year. The weighted average interest rate on market loans firmed up to 9.01 per cent during 2008-09 (up to October 14, 2008) from 8.34 per cent during the corresponding period of 2007-08 (Table 19). The spreads on State Government securities over the yields of Central Government securities of corresponding maturity ranged between 30 and 98 basis points as compared with 19 and 90 basis points during the corresponding period of 2007-08.
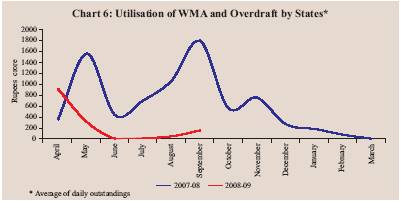
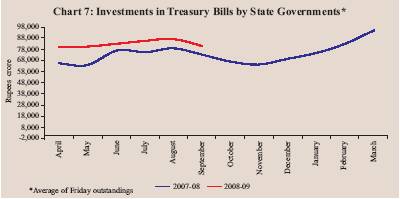
The average daily utilisation of WMA and overdraft (OD) by the States during April-September 2008 was Rs.243 crore as compared with Rs.986 crore during the corresponding period of 2007 (Chart 6). Five States availed of WMA and three States resorted to OD during 2008-09 (up to October 13, 2008) as compared with seven States and three States, respectively, during the corresponding period of the previous year. The WMA position as on October 13, 2008 was Rs.930 crore as compared with Rs.1,208 crore of WMA/OD a year ago. The cash surplus position of the States, as reflected in their average investments in Treasury Bills (14-day Intermediate Treasury Bills and Auction Treasury Bills) remained consistently higher during 2008-09 (up to September 30, 2008) than the corresponding period of the preceding year (Chart 7). The average daily investments by the States in Treasury Bills (14-day Intermediate Treasury Bills and Auction Treasury Bills) during April-September 2008 amounted to Rs.82,382 crore as compared with Rs.72,805 crore during the corresponding period of 2007-08. The cash surplus position as on October 13, 2008 was Rs.69,507 crore as compared with Rs.66,141 crore a year ago. 1 The receipts on account of transactions relating to SBI transfer were shown under non-debt capital receipts from April-September 2007 onwards. |
||||||||||||||||||||||||||||||||||||||||||||||||||||||||||||||||||||||||||||||||||||||||||||||||||||||||||||||||||||||||||||||||||||||||||||||||||||||||||||||||||||||||||||||||||||||||||||||||||||||||||||||||||||||||||||||||||||||||||||||||||||||||||||||||||||||||||||||||||||||||||||||||||||||||||||||||||||||||||||||||||||||||||||||||||||||||||||||||||||||||||||||||||||||||||||||||||||||||||||||||||||||||||||||||||||||||||||||||||||||||||||||||||||||||||||||||||||||||||||||||||||||||||||||||||||||||||||||||||||||||||||||||||||||||||||||||||||||||||||||||||||||||||||||||||||||||||||||||||||||||||||||||||||||||||||||||||||||||||||||||||||||||||||||||||||||||||||||||||||||||||||||||||||||||||||||||||||||||||||||||||||||||||||||||||||||||||||||||||||||||||||||||||||||||||||||||||||||||||||||||||||||||||||||||||||||||||||||||||||||||||||||||||||||||||||||||

इस पेज को शेयर करें:


आरबीआई मोबाइल एप्लीकेशन इंस्टॉल करें और लेटेस्ट न्यूज़ का तुरंत एक्सेस पाएं!
हमारा ऐप इंस्टॉल करने के लिए QR कोड स्कैन करें


पृष्ठ अंतिम बार अपडेट किया गया:


