RbiSearchHeader

Press escape key to go back

पिछली खोज

थीम
थीम
टेक्स्ट का साइज़
टेक्स्ट का साइज़
S3

RbiAnnouncementWeb

RBI Announcements
RBI Announcements

असेट प्रकाशक

110382353

2023-24 की दूसरी तिमाही के लिए विनिर्माण क्षेत्र में आदेश बहियों, माल-सूचियों और क्षमता उपयोग सर्वेक्षण (ओबीआईसीयूएस)

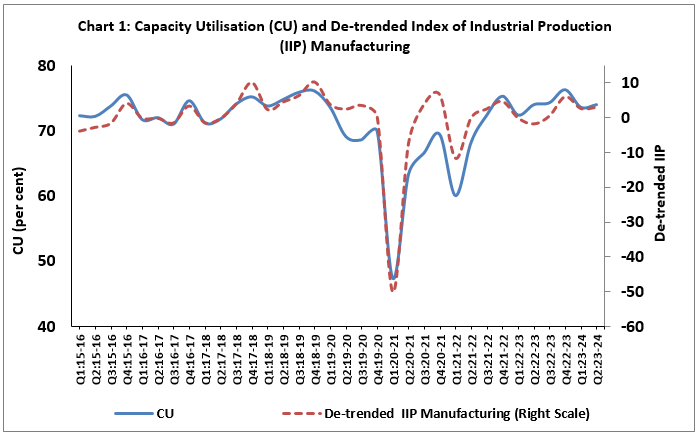
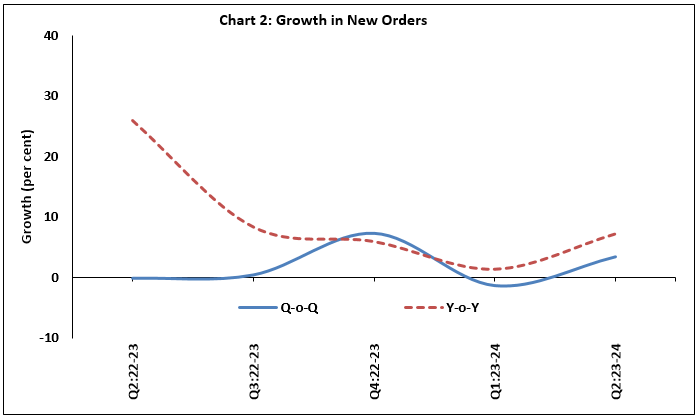
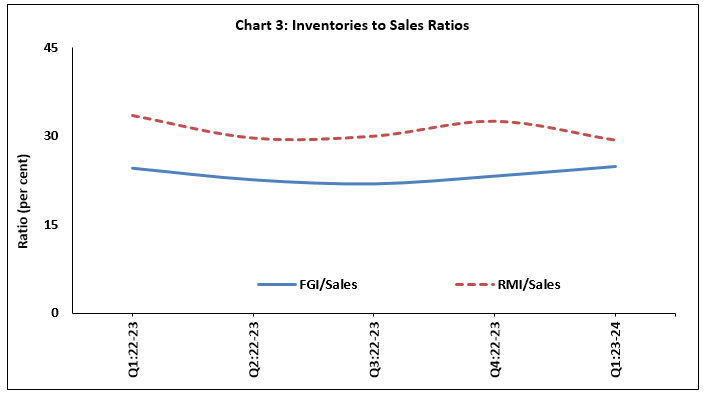
आज रिज़र्व बैंक ने 803 विनिर्माण कंपनियों के आदेश बहियों, माल-सूचियों और क्षमता उपयोग के 63वें दौर के परिणाम जारी किए जिसके आँकड़े 2023-24 की तीसरी तिमाही के दौरान एकत्रित किए गए थे। सर्वेक्षण [1]जुलाई- सितंबर 2023 के दौरान भारत के विनिर्माण क्षेत्र में मांग की स्थिति का एक स्नैपशॉट प्रदान करता है।


विशेष :

  • समग्र स्तर पर विनिर्माण क्षेत्र में क्षमता उपयोग 2023-24 की पहली तिमाही के 73.6 प्रतिशत से बढ़कर 2023-24 की दूसरी तिमाही में 74.0 प्रतिशत दर्ज किया गया (चार्ट 1 और सारणी 1)। मौसमी रूप से समायोजित क्षमता उपयोग 2023-24 की पहली तिमाही के 75.4 प्रतिशत के स्तर से घटकर दूसरी तिमाही में 74.5 प्रतिशत पर दर्ज किया गया।
Chart 1: Capacity Utilisation (CU) and De-trended Index of Industrial Production (IIP) Manufacturing
  • विनिर्माताओं ने 2023-24 की दूसरी तिमाही में पिछली तिमाही के साथ-साथ पिछले वर्ष की इसी तिमाही की तुलना में अधिक नए ऑर्डर की सूचना दी (चार्ट 2 और सारणी 2ए)।

Chart 2: Growth in New Orders
  • 2023-24 की दूसरी तिमाही में कच्चे माल की सूची और बिक्री का अनुपात पिछली तिमाही के स्तर से मामूली बढ़ गया, जबकि तैयार माल की सूची और बिक्री का अनुपात स्थिर रहा (चार्ट 3 और सारणी 3ए)।
Chart 3: Inventories to Sales Ratios

नोट - कृपया समय श्रृंखला डेटा के लिए एक्सेल फ़ाइल देखें।

ANNEX 1: Data Tables


Table 1: IIP*-Manufacturing and Capacity Utilisation

Quarter

Number of responding companies

Capacity Utilisation

IIP-Manufacturing

 (Quarterly Average)

De-trended Quarterly IIP-Manufacturing

Q2:2022-23

745

74.0

133.6

-1.8

Q3:2022-23

727

74.3

137.0

0.5

Q4:2022-23

705

76.3

143.5

6.0

  Q1:2023-24

665

73.6

141.2

2.6

Q2:2023-24

752

74.0

142.6

3.0

*: Index of Industrial Production (Base: 2011-12)


Table 2A: Order Books Growth

Quarter

Number of companies

Q-o-Q Growth # (per cent) **

Y-o-Y Growth # (per cent)

 Backlog Orders

New Order Book

Pending Orders

Backlog Orders

New Order Book

Pending Orders

Q2:2022-23

265

4.6

-0.1

10.8

11.4

25.9

20.1

Q3:2022-23

277

1.8

0.5

3.9

14.7

8.4

18.4

Q4:2022-23

261

3.9

7.4

2.9

15.8

6.0

15.3

Q1:2023-24

244

-5.2

-1.3

-4.5

22.7

1.5

9.3

Q2:2023-24

245

3.1

3.5

5.6

24.1

7.3

15.7

#: Growth rates are calculated using three rounds common set of companies, namely, companies responded in the current quarter, one quarter ago and the same quarter a year ago.

 **: Not seasonally adjusted.


Table 2B: Average Size of Order Books

Quarter

Number of companies

Average Amount (` Crores)

Backlog Orders

 New Order Book

Pending Orders

Q2:2022-23

265

208.8

307.9

232.4

Q3:2022-23

277

205.0

212.2

213.1

Q4:2022-23

261

215.6

225.4

221.9

Q1:2023-24

244

212.0

236.2

201.2

Q2:2023-24

245

227.7

248.6

240.4


Table 3A: Inventory to Sales Ratios

Quarter

Number of Companies

Ratio (per cent) ##

Total Inventory / Sales

Finished Goods Inventory / Sales

Raw Material Inventory / Sales

Q2:2022-23

721

61.8

22.6

29.6

Q3:2022-23

675

60.6

21.9

30.0

Q4:2022-23

658

64.1

23.2

32.5

Q1:2023-24

622

63.0

24.8

29.3

Q2:2023-24

688

65.9

24.6

30.9

##: Weighted average of industry level ratios using GVA as weights

Table 3B: Average Sales and Inventories

Quarter


Number of Companies

Average Amount (` Crores)

Sales

Total Inventory

Finished Goods Inventory

Work in progress Inventory

Raw Material Inventory

Q2:2022-23

721

1285.8

508.2

217.6

73.2

217.4

Q3:2022-23

675

1106.7

519.9

195.5

67.1

257.4

Q4:2022-23

658

1172.2

546.6

225.4

62.7

258.5

Q1:2023-24

622

1163.1

534.3

226.9

62.8

244.5

Q2:2023-24

688

1091.7

608.1

226.7

120.4

261.0


Note: 1. The computations of order book growths and inventory to sales ratios are based on methodology given in the RBI press release dated October 8, 2021 (link: https://rbi.org.in/en/web/rbi/-/publications/obicus-survey-on-the-manufacturing-sector-for-q1-2021-22-20650) and not on the basis of averages given in the above tables.


2. The estimates of inventory of raw materials (including stores and spares, loose tools and stock-in-trade) are arrived at by netting out finished goods inventory and work-in-progress inventory from total inventory. The survey has also started collecting direct data on raw material inventory, which will be included in the regular survey results once the reporting coverage of the new item is satisfactory.


[1] सर्वेक्षण प्रतिक्रियाएँ स्वैच्छिक हैं और परिणाम उत्तरदाताओं के विचारों को प्रतिबिंबित करते हैं, जो आवश्यक रूप से रिज़र्व बैंक द्वारा साझा नहीं किए जाते हैं। पिछले सर्वेक्षण दौर के परिणाम 06 अक्टूबर, 2023 को बैंक की वेबसाइट पर जारी किए गए थे।


RbiTtsCommonUtility

प्ले हो रहा है
सुनें

संबंधित एसेट

आरबीआई-इंस्टॉल-आरबीआई-सामग्री-वैश्विक

RbiSocialMediaUtility

आरबीआई मोबाइल एप्लीकेशन इंस्टॉल करें और लेटेस्ट न्यूज़ का तुरंत एक्सेस पाएं!

Scan Your QR code to Install our app

RbiWasItHelpfulUtility

क्या यह पेज उपयोगी था?