RbiSearchHeader

Press escape key to go back

पिछली खोज

थीम
थीम
टेक्स्ट का साइज़
टेक्स्ट का साइज़
S1

RbiAnnouncementWeb

RBI Announcements
RBI Announcements

असेट प्रकाशक

105993280

2023-24 की तीसरी तिमाही (Q3) के लिए सेवा और आधारभूत संरचना परिदृश्य का सर्वेक्षण

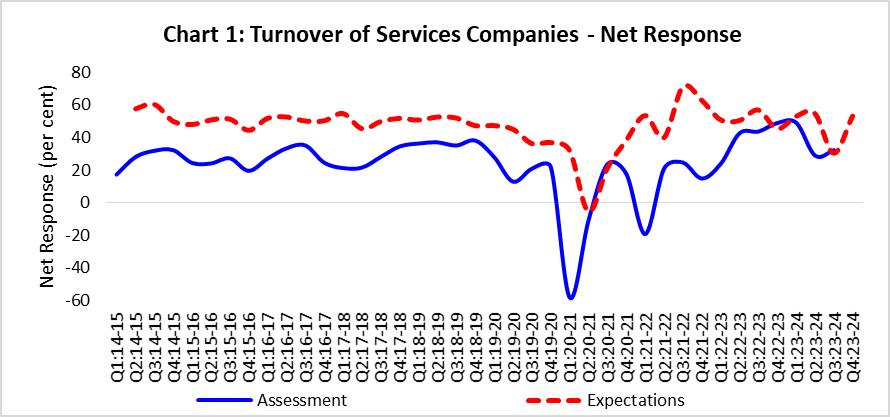
2023-24 की तीसरी तिमाही (Q3) के लिए सेवा और आधारभूत संरचना परिदृश्य का सर्वेक्षण

आज भारतीय रिज़र्व बैंक ने 2023-24 की तीसरी तिमाही के दौरान संचालित सेवा और आधारभूत संरचना परिदृश्य (एसआइओएस) के तिमाही सर्वेक्षण के 39 वें चक्र का परिणाम जारी किया। भविष्योन्मुखी सर्वेक्षण[1] में  सेवा और आधारभूत संरचना क्षेत्रों में कार्यरत भारतीय कंपनियों का गुणात्मक मूल्यांकन और उनकी अपेक्षाओं की कैपचरिंग मांग स्थितियों, मूल्य स्थितियों और अन्य कारोबार की शर्तों  से संबंधित कारोबारी मानदंडों के एक समुह मे किया जाता है। सर्वेक्षण के इस चक्र में  528 कंपनियों ने 2023-24 तीसरी  तिमाही के लिए अपना मूल्यांकन और 2023-24 चौथी तिमाही के लिए अपेक्षाओं के साथ-साथ बाद की दो तिमाहियों के लिए प्रमुख मापदंडों पर अपना दृष्टिकोण प्रदान किया।

विशेष:

A. सेवा क्षेत्र

   2023-24 की तीसरी तिमाही के लिए मूल्यांकन

  • सेवा क्षेत्र के उद्यमों ने 2023-24 की तीसरी तिमाही के दौरान समग्र व्यावसायिक स्थिति, रोजगार की स्थिति, वित्त उपलब्धता और उनके टर्नओवर में सुधार देखा (चार्ट 1 और सारणी ए)।
  • व्यय पक्ष पर, इनपुट कीमतों, वित्त की लागत और कर्मचारियों के खर्चों से उत्पन्न दबाव जारी रहने की उम्मीद थी।
  • लाभ मार्जिन के आकलन में सुधार हुआ, टर्नओवर और बिक्री कीमतों में वृद्धि से लाभ हुआ I


  2023-24 की चौथी तिमाही के लिए अपेक्षाएं

  • व्यवसायिक स्थिति में सुधार के कारण सेवाओं की मांग और बढ़ने की संभावना है; कंपनियां टर्नओवर, वित्त की उपलब्धता और नौकरी परिदृश्य पर अत्यधिक आशावादी रहीं (सारणी) ।
  • 2023-24 की चौथी तिमाही में लागत दबाव बने रहने की संभावना है; पिछले सर्वेक्षण दौर की तुलना में उत्तरदाताओं ने बिक्री मूल्य, लाभ मार्जिन और भौतिक निवेश पर अधिक आशावाद प्रदर्शित किया।

  2024-25 की पहिली तिमाही और 2024-25 दूसरी तिमाही के लिए अपेक्षाएं 

  •  उत्तरदाता लगातार तिमाहियों में क्रमिक सुधार के साथ 2024-25 की पहली छमाही के लिए व्यावसायिक स्थितियों पर आशावादी बने हुए हैं। साथ ही, नौकरी परिदृश्य में भी सुधार होने की उम्मीद है (सारणी सी)
  • इनपुट लागत का दबाव जारी रहने की संभावना है, और कंपनियों को बिक्री कीमतों में वृद्धि की भी उम्मीद है।
  •  
 

Chart 1
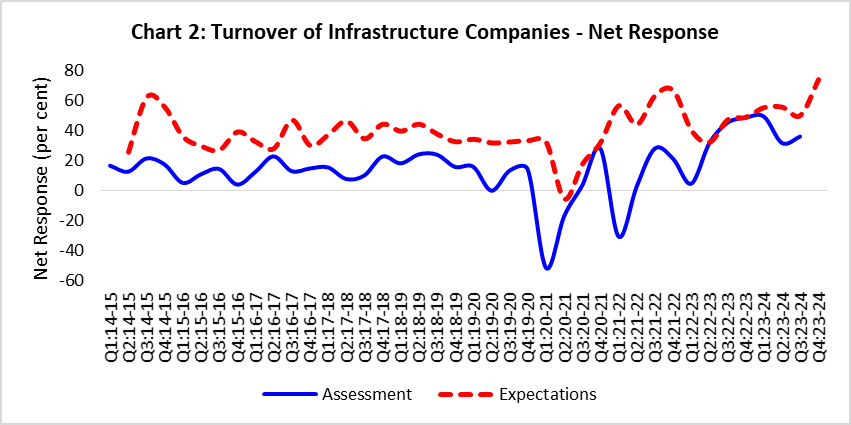
B. आधारभूत संरचना क्षेत्र

   2023-24 की तीसरी तिमाही के लिए मूल्यांकन

  • 2023-24 तीसरी तिमाही के दौरान आधारभूत संरचना कंपनियों ने बेहतर समग्र व्यावसायिक स्थिति के साथ-साथ अपने कारोबार का भी आकलन किया (चार्ट 2 और सारणी बी)
  • उत्तरदाता पूर्णकालिक और अंशकालिक रोजगार दोनों पर सकारात्मक थे।
  • उद्यमों ने 2023-24 की तीसरी तिमाही के दौरान क्षेत्र में बढ़ती लागत के दबाव के चरण में बिक्री मूल्यों में वृद्धि का आकलन किया।

  2023-24 की चौथी तिमाही के लिए अपेक्षाएं

  • आधारभूत संरचना कंपनियां समग्र व्यावसायिक स्थिति, उनके कारोबार और रोजगार की स्थिति के बारे में अत्यधिक आशावादी बनी हुई हैं (सारणी बी(।
  • लागत दबाव और बढ़ने की संभावना है और कंपनियों को उच्च बिक्री मूल्य और लाभ मार्जिन की उम्मीद है।
  • नवीनतम सर्वेक्षण दौर में आधारभूत संरचना क्षेत्र में भौतिक निवेश पर आशावाद बढ़ा है।

  2024-25 की पहिली तिमाही और 2024-25 दूसरी तिमाही के लिए अपेक्षाएं 

  •  2024-25 पहिली छमाही  के दौरान उत्तरदाताओं को मांग और रोजगार की स्थिति में क्रमिक सुधार की उम्मीद है (सारणी डी)।
  • इनपुट लागत और बिक्री मूल्य दोनों 2024-25 की दूसरी तिमाही तक बढ़ने की संभावना है।
Chart 1

Summary of Net Responses[2] on Survey Parameters

Table A: Services Sector

(per cent)

Parameters

Assessment period

Expectations period

Q2:2023-24

Q3:2023-24

Q3:2023-24

Q4:2023-24

Overall Business Situation

34.4

35.6

43.1

54.8

Turnover

28.9

32.3

30.5

53.4

Full-time Employees

17.3

21.4

16.5

28.8

Part-time Employees

6.2

13.2

14.4

23.1

Availability of Finance

18.0

24.9

24.2

37.4

Cost of Finance

-30.1

-32.3

-26.6

-34.4

Salary & Wages

-39.2

-38.4

-29.5

-36.8

Cost of Inputs

-28.1

-37.9

-22.2

-45.7

Selling Price

6.5

15.1

14.2

30.7

Profit Margin

4.3

9.7

13.8

27.5

Inventories

16.5

22.2

22.9

28.3

Technical/Service Capacity

25.3

21

40.0

34.1

Physical Investment

27.6

20.1

22.3

32.2


Table B: Infrastructure Sector

(per cent)

Parameters

Assessment period

Expectations period

Q2:2023-24

Q3:2023-24

Q3:2023-24

Q4:2023-24

Overall Business Situation

29.8

34.2

64.4

68.1

Turnover

31.7

36.1

50.0

73.9

Full-time Employees

16.3

22.2

39.4

60.7

Part-time Employees

31.0

29.2

55.2

68.3

Availability of Finance

26.0

30.8

42.7

61.3

Cost of Finance

-44.8

-31.8

-54.2

-60.7

Salary & Wages

-35.9

-40.7

-39.2

-59.0

Cost of Inputs

-45.1

-47.9

-45.0

-55.7

Selling Price

20.7

28.0

38.0

60.0

Profit Margin

7.8

25.0

31.4

48.7

Inventories

36.8

36.9

57.9

74.3

Technical/Service Capacity

36.2

35.5

66.7

75.0

Physical Investment

34.2

31.6

46.8

75.3


Expectations of Select Parameters for extended period – Net response (in per cent)

Table C: Services Sector

Parameter

Round 38

Round 39

Q3:2023-24

Q4:2023-24

Q1:2024-25

Q2:2024-25

Overall Business Situation

43.1

54.8

57.8

60.6

Turnover

30.5

53.4

60.9

61.8

Full-time Employees

16.5

28.8

44.7

43.6

Part-time Employees

14.4

23.1

33.0

33.1

Cost of Inputs  

-22.2

-45.7

-47.6

-46.7

Selling Price

14.2

30.7

37.8

39.4


Table D: Infrastructure Sector

Parameter

Round 38

Round 39

Q3:2023-24

Q4:2023-24

Q1:2024-25

Q2:2024-25

Overall Business Situation

64.4

68.1

76.3

83.8

Turnover

50.0

73.9

80.5

82.1

Full-time Employees

39.4

60.7

67.8

72.2

Part-time Employees

55.2

68.3

69.3

74.0

Cost of Inputs  

-45.0

-55.7

-73.9

-73.6

Selling Price

38.0

60.0

78.8

77.6


Note: Please see the excel file for time series data

Services Sector

Table S1: Assessment and Expectation for Overall Business Situation

(Percentage responses)@

Quarter

Assessment

Expectation

Better

No Change

Worse

Net response#

Better

No Change

Worse

Net response

Q3:22-23

52.4

43.3

4.3

48.1

57.4

38.1

4.4

53.0

Q4:22-23

59.8

30.0

10.3

49.5

55.0

40.0

5.0

50.1

Q1:23-24

55.0

32.0

13.0

42.0

64.2

27.4

8.4

55.8

Q2:23-24

48.4

37.7

14.0

34.4

62.3

31.3

6.4

56.0

Q3:23-24

47.6

40.4

12.0

35.6

51.0

41.2

7.8

43.1

Q4:23-24


59.4

36.0

4.6

54.8

‘Increase’ in Overall business situation is optimistic.

@: Due to rounding off percentage may not add up to 100.

#: Net Response (NR) is the difference of percentage of the respondents reporting optimism and that reporting pessimism. The range is -100 to 100. Any value greater than zero indicates expansion/ optimism and any value less than zero indicates contraction/ pessimism.


Table S2: Assessment and Expectation for Turnover              

(Percentage responses)

Quarter

Assessment

Expectation

Increase

No Change

Decrease

Net response

Increase

No Change

Decrease

Net response

Q3:22-23

49.2

45.2

5.5

43.7

61.6

34.0

4.4

57.1

Q4:22-23

57.4

34.0

8.5

48.9

51.5

42.5

6.0

45.5

Q1:23-24

59.4

30.2

10.4

49.0

60.0

33.1

6.9

53.1

Q2:23-24

43.8

41.3

14.9

28.9

59.3

36.3

4.4

54.9

Q3:23-24

48.2

35.9

15.9

32.3

40.3

49.9

9.8

30.5

Q4:23-24


59.8

33.8

6.4

53.4

‘Increase’ in Turnover is optimistic. Footnotes @ and # given in Table 1 are applicable here.


Table S3: Assessment and Expectation for Full-time Employees          

(Percentage responses)

Quarter

Assessment

Expectation

Increase

No Change

Decrease

Net response

Increase

No Change

Decrease

Net response

Q3:22-23

42.9

52.5

4.6

38.4

38.4

55.9

5.8

32.6

Q4:22-23

45.1

48.0

7.0

38.1

47.1

48.0

4.8

42.3

Q1:23-24

40.1

47.8

12.1

27.9

47.8

45.9

6.3

41.6

Q2:23-24

34.3

48.7

17.0

17.3

44.7

52.6

2.7

42.0

Q3:23-24

29.9

61.6

8.5

21.4

26.4

63.7

9.9

16.5

Q4:23-24


32.4

64.0

3.6

28.8

‘Increase’ in Full-time Employees is optimistic. Footnotes @ and # given in Table 1 are applicable here.


Table S4: Assessment and Expectation for Part-time Employees          

(Percentage responses)

Quarter

Assessment

Expectation

Increase

No Change

Decrease

Net response

Increase

No Change

Decrease

Net response

Q3:22-23

40.1

54.8

5.1

34.9

27.8

67.3

5.0

22.8

Q4:22-23

36.2

58.5

5.3

30.9

41.8

53.1

5.1

36.7

Q1:23-24

30.9

59.1

9.9

21.0

35.3

60.6

4.2

31.1

Q2:23-24

24.4

57.5

18.1

6.2

36.7

57.9

5.3

31.4

Q3:23-24

21.5

70.3

8.2

13.2

31.0

52.3

16.7

14.4

Q4:23-24


28.8

65.4

5.8

23.1

‘Increase’ in Part-time Employees is optimistic. Footnotes @ and # given in Table 1 are applicable here.


Table S5: Assessment and Expectation for Availability of Finance         

(Percentage responses)

Quarter

Assessment

Expectation

Improve

No Change

Worsen

Net response

Improve

No Change

Worsen

Net response

Q3:22-23

42.1

53.4

4.6

37.5

32.9

61.0

6.2

26.7

Q4:22-23

34.9

61.6

3.6

31.3

42.3

52.4

5.4

36.9

Q1:23-24

29.3

61.2

9.5

19.7

36.0

61.4

2.6

33.4

Q2:23-24

30.6

56.8

12.6

18.0

39.5

57.0

3.5

36.0

Q3:23-24

32.3

60.3

7.4

24.9

31.5

61.1

7.3

24.2

Q4:23-24


40.4

56.7

2.9

37.4

‘Improve’ in Availability of Finance is optimistic. Footnotes @ and # given in Table 1 are applicable here.


Table S6: Assessment and Expectation for Cost of Finance 

(Percentage responses)

Quarter

Assessment

Expectation

Increase

No Change

Decrease

Net response

Increase

No Change

Decrease

Net response

Q3:22-23

40.7

54.7

4.6

-36.1

39.7

57.1

3.2

-36.5

Q4:22-23

36.7

60.1

3.2

-33.5

41.6

53.2

5.2

-36.5

Q1:23-24

42.1

49.6

8.3

-33.7

35.4

62.0

2.6

-32.8

Q2:23-24

39.0

52.1

8.9

-30.1

38.1

57.6

4.3

-33.7

Q3:23-24

36.5

59.3

4.2

-32.3

32.8

61.0

6.2

-26.6

Q4:23-24


38.1

58.2

3.7

-34.4

‘Decrease’ in Cost of Finance is optimistic. Footnotes @ and # given in Table 1 are applicable here.


Table S7: Assessment and Expectation for Salary/Wages       

(Percentage responses)

Quarter

Assessment

Expectation

Increase

No Change

Decrease

Net response

Increase

No Change

Decrease

Net response

Q3:22-23

47.9

48.4

3.7

-44.2

42.4

56.0

1.6

-40.9

Q4:22-23

47.6

48.4

3.9

-43.7

43.3

52.1

4.6

-38.7

Q1:23-24

48.8

45.6

5.6

-43.2

45.9

46.7

7.5

-38.4

Q2:23-24

44.5

50.3

5.3

-39.2

46.4

52.0

1.6

-44.8

Q3:23-24

42.4

53.5

4.0

-38.4

33.6

62.3

4.1

-29.5

Q4:23-24


38.6

59.6

1.8

-36.8

‘Decrease’ in Salary/Wages is optimistic. Footnotes @ and # given in Table 1 are applicable here.


Table S8: Assessment and Expectation for Cost of Inputs    

(Percentage responses)

Quarter

Assessment

Expectation

Increase

No Change

Decrease

Net response

Increase

No Change

Decrease

Net response

Q3:22-23

46.1

49.2

4.7

-41.4

49.4

45.6

4.9

-44.5

Q4:22-23

41.9

53.4

4.7

-37.2

50.1

44.5

5.3

-44.8

Q1:23-24

45.2

45.4

9.5

-35.7

43.8

53.6

2.7

-41.1

Q2:23-24

39.1

49.9

11.0

-28.1

47.0

46.8

6.1

-40.9

Q3:23-24

44.6

48.6

6.8

-37.9

32.1

57.9

9.9

-22.2

Q4:23-24


47.4

50.9

1.7

-45.7

‘Decrease’ in Cost of Inputs is optimistic. Footnotes @ and # given in Table 1 are applicable here.


Table S9: Assessment and Expectation for Selling Price              

(Percentage responses)

Quarter

Assessment

Expectation

Increase

No Change

Decrease

Net response

Increase

No Change

Decrease

Net response

Q3:22-23

40.8

54.4

4.8

36.0

25.7

68.3

6.1

19.6

Q4:22-23

34.4

62.2

3.5

30.9

38.9

55.6

5.5

33.4

Q1:23-24

28.8

59.8

11.4

17.4

35.7

60.0

4.3

31.3

Q2:23-24

21.9

62.7

15.4

6.5

39.5

53.7

6.8

32.7

Q3:23-24

24.3

66.6

9.2

15.1

26.4

61.5

12.1

14.2

Q4:23-24


35.3

60.0

4.7

30.7

‘Increase’ in Selling Price is optimistic. Footnotes @ and # given in Table 1 are applicable here.


Table S10: Assessment and Expectation for Profit Margin            

(Percentage responses)

Quarter

Assessment

Expectation

Increase

No Change

Decrease

Net response

Increase

No Change

Decrease

Net response

Q3:22-23

41.9

52.0

6.1

35.8

36.3

54.3

9.5

26.8

Q4:22-23

43.6

46.7

9.7

33.9

44.8

49.7

5.4

39.4

Q1:23-24

26.3

52.3

21.4

4.9

48.4

42.3

9.3

39.1

Q2:23-24

26.3

51.8

22.0

4.3

50.3

40.6

9.1

41.2

Q3:23-24

27.1

55.5

17.4

9.7

27.3

59.2

13.5

13.8

Q4:23-24


36.1

55.2

8.6

27.5

‘Increase’ in Profit Margin is optimistic. Footnotes @ and # given in Table 1 are applicable here.


Table S11: Assessment and Expectation for Inventories 

(Percentage responses)

Quarter

Assessment

Expectation

Increase

No Change

Decrease

Net response

Increase

No Change

Decrease

Net response

Q3:22-23

48.3

46.9

4.8

43.5

40.5

56.8

2.7

37.8

Q4:22-23

38.1

58.1

3.8

34.2

48.8

46.0

5.2

43.5

Q1:23-24

30.4

58.8

10.8

19.6

38.6

57.7

3.7

34.8

Q2:23-24

30.2

56.2

13.6

16.5

40.3

54.3

5.4

34.8

Q3:23-24

29.6

62.9

7.5

22.2

34.5

53.9

11.6

22.9

Q4:23-24


34.2

60.0

5.8

28.3

‘Increase’ in Inventories is optimistic. Footnotes @ and # given in Table 1 are applicable here.


Table S12: Assessment and Expectation for Technical/Service Capacity         

(Percentage responses)

Quarter

Assessment

Expectation

Increase

No Change

Decrease

Net response

Increase

No Change

Decrease

Net response

Q3:22-23

41.7

53.6

4.7

37.1

29.5

68.8

1.7

27.7

Q4:22-23

36.4

60.9

2.7

33.7

41.5

53.9

4.6

37.0

Q1:23-24

30.0

65.1

4.9

25.1

36.4

61.1

2.5

34.0

Q2:23-24

28.1

69.2

2.7

25.3

51.2

47.5

1.3

49.8

Q3:23-24

22.6

75.8

1.6

21.0

41.9

56.3

1.9

40.0

Q4:23-24


34.1

65.9

0.0

34.1

‘Increase’ in Technical/Service Capacity is optimistic. Footnotes @ and # given in Table 1 are applicable here.


Table S13: Assessment and Expectation for Physical Investment

(Percentage responses)

Quarter

Assessment

Expectation

Increase

No Change

Decrease

Net response

Increase

No Change

Decrease

Net response

Q3:22-23

41.3

54.4

4.3

37.0

22.8

75.8

1.5

21.3

Q4:22-23

32.2

65.5

2.3

30.0

41.4

53.9

4.7

36.7

Q1:23-24

26.9

66.8

6.3

20.7

33.0

64.3

2.7

30.3

Q2:23-24

30.7

66.1

3.1

27.6

43.4

54.8

1.8

41.5

Q3:23-24

21.7

76.6

1.6

20.1

23.3

75.8

0.9

22.3

Q4:23-24


32.2

67.8

0.0

32.2

‘Increase’ in Physical Investment is optimistic. Footnotes @ and # given in Table 1 are applicable here.


Infrastructure Sector

Table I1: Assessment and Expectation for Overall Business Situation

(Percentage responses)@

Quarter

Assessment

Expectation

Better

No Change

Worse

Net response#

Better

No Change

Worse

Net response

Q3:22-23

55.5

38.0

6.5

49.0

49.2

46.7

4.1

45.1

Q4:22-23

60.9

28.7

10.4

50.4

56.8

37.2

6.0

50.9

Q1:23-24

62.6

23.1

14.3

48.4

60.5

34.2

5.3

55.3

Q2:23-24

44.2

41.3

14.4

29.8

62.6

30.8

6.6

56.0

Q3:23-24

44.2

45.8

10.0

34.2

67.3

29.8

2.9

64.4

Q4:23-24


73.1

21.8

5.0

68.1

‘Increase’ in Overall business situation is optimistic.

@: Due to rounding off percentage may not add up to 100.

#: Net Response (NR) is the difference of percentage of the respondents reporting optimism and that reporting pessimism. The range is -100 to 100. Any value greater than zero indicates expansion/ optimism and any value less than zero indicates contraction/ pessimism.


Table I2: Assessment and Expectation for Turnover              

(Percentage responses)


Quarter

Assessment

Expectation


Increase

No Change

Decrease

Net response

Increase

No Change

Decrease

Net response


Q3:22-23

52.6

40.2

7.2

45.4

56.1

35.0

8.9

47.2


Q4:22-23

60.9

27.0

12.2

48.7

55.8

37.2

7.0

48.8


Q1:23-24

64.8

19.8

15.4

49.5

61.4

32.5

6.1

55.3


Q2:23-24

46.2

39.4

14.4

31.7

61.1

33.3

5.6

55.6


Q3:23-24

47.9

40.3

11.8

36.1

53.8

42.3

3.8

50.0


Q4:23-24


75.6

22.7

1.7

73.9


‘Increase’ in Turnover is optimistic. Footnotes @ and # given in Table 1 are applicable here.


Table I3: Assessment and Expectation for Full-time Employees          

(Percentage responses)

Quarter

Assessment

Expectation

Increase

No Change

Decrease

Net response

Increase

No Change

Decrease

Net response

Q3:22-23

51.2

42.3

6.5

44.7

36.4

57.0

6.6

29.8

Q4:22-23

47.0

47.8

5.2

41.7

52.4

40.7

6.9

45.5

Q1:23-24

46.7

40.0

13.3

33.3

50.9

44.7

4.4

46.5

Q2:23-24

28.8

58.7

12.5

16.3

48.9

48.9

2.2

46.7

Q3:23-24

32.5

57.3

10.3

22.2

42.3

54.8

2.9

39.4

Q4:23-24


63.2

34.2

2.6

60.7

‘Increase’ in Full-time Employees is optimistic. Footnotes @ and # given in Table 1 are applicable here.


Table I4: Assessment and Expectation for Part-time Employees          

(Percentage responses)

Quarter

Assessment

Expectation

Increase

No Change

Decrease

Net response

Increase

No Change

Decrease

Net response

Q3:22-23

50.3

43.2

6.5

43.8

24.6

68.6

6.8

17.8

Q4:22-23

46.4

50.0

3.6

42.9

52.1

41.7

6.2

45.9

Q1:23-24

48.1

40.7

11.1

37.0

43.8

55.4

0.9

42.9

Q2:23-24

37.9

55.2

6.9

31.0

50.9

45.3

3.8

47.2

Q3:23-24

35.8

57.5

6.6

29.2

60.3

34.5

5.2

55.2

Q4:23-24


68.3

31.7

0.0

68.3

‘Increase’ in Part-time Employees is optimistic. Footnotes @ and # given in Table 1 are applicable here.


Table I5: Assessment and Expectation for Availability of Finance            

(Percentage responses)

Quarter

Assessment

Expectation

Improve

No Change

Worsen

Net response

Improve

No Change

Worsen

Net response

Q3:22-23

50.5

43.7

5.8

44.7

43.4

50.8

5.7

37.7

Q4:22-23

45.1

49.6

5.3

39.8

52.2

41.9

5.8

46.4

Q1:23-24

28.9

54.4

16.7

12.2

46.8

50.5

2.7

44.1

Q2:23-24

36.5

52.9

10.6

26.0

51.1

43.3

5.6

45.6

Q3:23-24

36.7

57.5

5.8

30.8

46.6

49.5

3.9

42.7

Q4:23-24


63.0

35.3

1.7

61.3

‘Improve’ in Availability of Finance is optimistic. Footnotes @ and # given in Table 1 are applicable here.


Table I6: Assessment and Expectation for Cost of Finance 

(Percentage responses)

Quarter

Assessment

Expectation

Increase

No Change

Decrease

Net response

Increase

No Change

Decrease

Net response

Q3:22-23

51.0

42.8

6.2

-44.9

47.5

46.7

5.8

-41.7

Q4:22-23

43.4

49.6

7.1

-36.3

49.7

44.5

5.8

-43.8

Q1:23-24

50.6

41.2

8.2

-42.4

43.8

53.6

2.7

-41.1

Q2:23-24

51.0

42.7

6.3

-44.8

44.0

53.6

2.4

-41.7

Q3:23-24

38.2

55.5

6.4

-31.8

54.2

45.8

0.0

-54.2

Q4:23-24


61.7

37.4

0.9

-60.7

‘Decrease’ in Cost of Finance is optimistic. Footnotes @ and # given in Table 1 are applicable here.


Table I7: Assessment and Expectation for Salary/Wages             

(Percentage responses)

Quarter

Assessment

Expectation

Increase

No Change

Decrease

Net response

Increase

No Change

Decrease

Net response

Q3:22-23

56.3

39.2

4.4

-51.9

35.0

62.4

2.6

-32.5

Q4:22-23

47.0

49.6

3.5

-43.5

50.5

43.6

5.8

-44.7

Q1:23-24

40.7

56.0

3.3

-37.4

46.5

50.9

2.6

-43.9

Q2:23-24

42.7

50.5

6.8

-35.9

47.8

52.2

0.0

-47.8

Q3:23-24

44.9

50.8

4.2

-40.7

41.2

56.9

2.0

-39.2

Q4:23-24


59.8

39.3

0.9

-59.0

‘Decrease’ in Salary/Wages is optimistic. Footnotes @ and # given in Table 1 are applicable here.


Table I8: Assessment and Expectation for Cost of Inputs          

(Percentage responses)

Quarter

Assessment

Expectation

Increase

No Change

Decrease

Net response

Increase

No Change

Decrease

Net response

Q3:22-23

52.2

41.6

6.2

-46.0

53.0

42.7

4.3

-48.7

Q4:22-23

46.9

50.4

2.7

-44.2

55.3

37.8

6.9

-48.5

Q1:23-24

47.7

47.7

4.5

-43.2

49.6

48.7

1.8

-47.8

Q2:23-24

50.0

45.1

4.9

-45.1

51.1

44.3

4.5

-46.6

Q3:23-24

52.1

43.6

4.3

-47.9

52.0

41.0

7.0

-45.0

Q4:23-24


59.1

37.4

3.5

-55.7

‘Decrease’ in Cost of Inputs is optimistic. Footnotes @ and # given in Table 1 are applicable here.


Table I9: Assessment and Expectation for Selling Price              

(Percentage responses)

Quarter

Assessment

Expectation

Increase

No Change

Decrease

Net response

Increase

No Change

Decrease

Net response

Q3:22-23

51.4

41.8

6.8

44.5

32.2

62.6

5.2

27.0

Q4:22-23

46.8

48.6

4.5

42.3

50.3

43.1

6.6

43.8

Q1:23-24

29.3

63.4

7.3

22.0

43.5

53.7

2.8

40.7

Q2:23-24

33.7

53.3

13.0

20.7

43.4

54.2

2.4

41.0

Q3:23-24

37.0

54.0

9.0

28.0

42.4

53.3

4.3

38.0

Q4:23-24


62.0

36.0

2.0

60.0

‘Increase’ in Selling Price is optimistic. Footnotes @ and # given in Table 1 are applicable here.


Table I10: Assessment and Expectation for Profit Margin             

(Percentage responses)

Quarter

Assessment

Expectation

Increase

No Change

Decrease

Net response

Increase

No Change

Decrease

Net response

Q3:22-23

52.2

40.1

7.6

44.6

34.7

47.1

18.2

16.5

Q4:22-23

46.0

44.2

9.7

36.3

52.8

39.6

7.6

45.1

Q1:23-24

36.7

38.9

24.4

12.2

47.3

45.5

7.1

40.2

Q2:23-24

24.5

58.8

16.7

7.8

46.1

48.3

5.6

40.4

Q3:23-24

35.0

55.0

10.0

25.0

37.3

56.9

5.9

31.4

Q4:23-24


56.3

36.1

7.6

48.7

‘Increase’ in Profit Margin is optimistic. Footnotes @ and # given in Table 1 are applicable here.


Table I11: Assessment and Expectation for Inventories 

(Percentage responses)

Quarter

Assessment

Expectation

Increase

No Change

Decrease

Net response

Increase

No Change

Decrease

Net response

Q3:22-23

52.4

41.0

6.6

45.9

45.8

47.5

6.8

39.0

Q4:22-23

48.7

46.0

5.3

43.4

53.6

39.2

7.2

46.4

Q1:23-24

28.3

58.3

13.3

15.0

48.2

50.0

1.8

46.4

Q2:23-24

42.1

52.6

5.3

36.8

36.7

60.0

3.3

33.3

Q3:23-24

41.7

53.4

4.9

36.9

60.5

36.8

2.6

57.9

Q4:23-24


75.2

23.8

1.0

74.3

‘Increase’ in Inventories is optimistic. Footnotes @ and # given in Table 1 are applicable here.


Table I12: Assessment and Expectation for Technical/Service Capacity         

(Percentage responses)

Quarter

Assessment

Expectation

Increase

No Change

Decrease

Net response

Increase

No Change

Decrease

Net response

Q3:22-23

50.2

43.9

6.0

44.2

27.7

70.5

1.8

25.9

Q4:22-23

45.9

50.5

3.7

42.2

50.5

43.5

6.0

44.6

Q1:23-24

35.7

59.5

4.8

31.0

45.0

53.2

1.8

43.1

Q2:23-24

38.3

59.6

2.1

36.2

51.2

48.8

0.0

51.2

Q3:23-24

39.8

55.9

4.3

35.5

66.7

33.3

0.0

66.7

Q4:23-24


75.0

25.0

0.0

75.0

‘Increase’ in Technical/Service Capacity is optimistic. Footnotes @ and # given in Table 1 are applicable here.


Table I13: Assessment and Expectation for Physical Investment 

(Percentage responses)

Quarter

Assessment

Expectation

Increase

No Change

Decrease

Net response

Increase

No Change

Decrease

Net response

Q3:22-23

49.7

44.1

6.3

43.4

26.9

70.4

2.8

24.1

Q4:22-23

45.9

50.5

3.7

42.2

49.8

43.6

6.6

43.2

Q1:23-24

37.1

52.9

10.0

27.1

43.9

52.3

3.7

40.2

Q2:23-24

38.0

58.2

3.8

34.2

36.8

60.3

2.9

33.8

Q3:23-24

35.8

60.0

4.2

31.6

46.8

53.2

0.0

46.8

Q4:23-24


75.3

24.7

0.0

75.3

‘Increase’ in Physical Investment is optimistic. Footnotes @ and # given in Table 1 are applicable here.


[1]  सर्वेक्षण के परिणाम उत्तरदाताओं के विचारों को दर्शाते हैं, जिन्हें आवश्यक रूप से रिज़र्व बैंक द्वारा साझा नहीं किया जाता है। पिछले सर्वेक्षण दौर के परिणाम 06 अक्टूबर 2023 को बैंक की वेबसाइट पर जारी किए गए।.


[2] Net Response (NR) is the difference between the percentage of respondents reporting optimism and those reporting pessimism. It ranges between -100 to 100. Positive value indicates expansion/optimism and negative value indicates contraction/pessimism. In other words, NR = (I – D); where, I is the percentage response of ‘Increase/optimism’, D is the percentage response of ‘Decrease/pessimism’ and E is the percentage response as ‘no change/ equal’ (i.e., I+D+E=100).  For example, increase in turnover is optimism whereas decrease in cost of inputs is optimism.

RbiTtsCommonUtility

प्ले हो रहा है
सुनें

संबंधित एसेट

आरबीआई-इंस्टॉल-आरबीआई-सामग्री-वैश्विक

RbiSocialMediaUtility

आरबीआई मोबाइल एप्लीकेशन इंस्टॉल करें और लेटेस्ट न्यूज़ का तुरंत एक्सेस पाएं!

Scan Your QR code to Install our app

RbiWasItHelpfulUtility

क्या यह पेज उपयोगी था?