 IST,
IST,


मौद्रिक नीति रिपोर्ट - सितंबर 2014
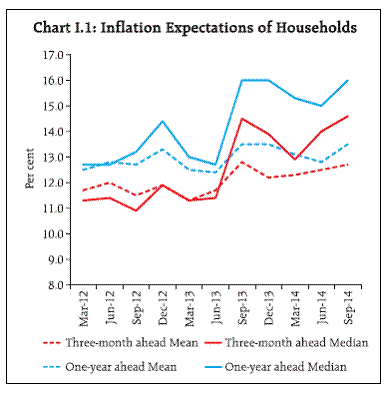
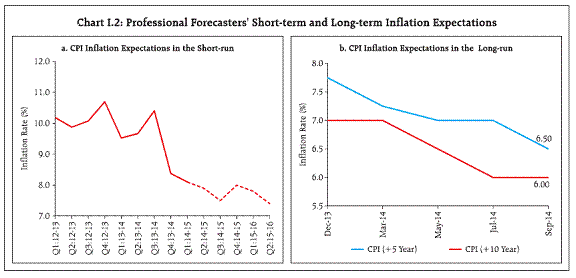
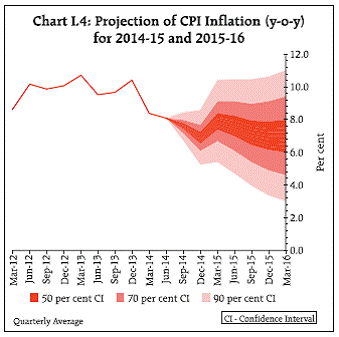
Economic activity gained pace in Q1 of 2014-15, but its momentum appears to have slackened in Q2. With the improvement in business confidence and congenial conditions for restarting investment demand, real GDP growth should pick up towards the close of the year, aided by a modestly firming global recovery supporting exports and the ongoing search for yields in international financial markets spurring capital inflows. Barring the impact of weather-related food supply disruptions, inflation has been moderating in a broad-based manner and is set to evolve around the expected trajectory through 2014-15. Elevated inflation expectations of households and risks from still-high input costs and sticky wages, however, present challenges to bringing down inflation to 6 per cent by January 2016 along the committed glide path. With consumer price index (CPI) inflation easing from its recent peak of 11.2 per cent in November 2013, the near-term outlook for inflation has improved and the target of 8 per cent for January 2015 appears more within reach than at the time of the first bi-monthly monetary policy statement in April. Latest readings on sensitive components of food prices suggest that they may have peaked after monsoon related increases. The softening of international commodity prices, particularly crude oil, metals and chemicals, is feeding through into an abating of key input prices domestically. Wages, though still sticky, are decelerating, facilitating smaller increases in minimum support prices than in the past. Also, the stability in the exchange rate since January this year is entrenching the disinflation. Furthermore, the effects of past monetary policy tightening are operating through the slack in various segments of the economy to bring down inflation excluding food and fuel. Nevertheless, there are upside risks to inflation from the skewed spatial and temporal distribution of the monsoon and from geo-political tensions which could jeopardise the near- term outlook if they materialise. Expectations of various economic agents tracked by forward-looking surveys provide useful insights into wage and price formation and thereby into the evolution of inflation conditions. Households’ three month ahead inflation expectations appear to have discounted recent favourable developments on the inflation front and have been rising since March, presumably affected by monsoon uncertainty (Chart I.1). Households’ inflation expectations for a year ahead also moved up after edging down since December 2013, and remain elevated relative to their long-run averages. Professional forecasters surveyed by the Reserve Bank also believe that median inflation may ease up to Q3 of 2014-15, but it is likely to firm up in Q4 (Chart I.2). Their long-term inflation expectations, however, appear to be on a gradually declining path. The industrial outlook survey of the Reserve Bank reflects a softening of manufacturers’ expectations of input prices over the near-term; with slack in the economy persisting, this could lead to selling prices moderating going forward (Chart I.3). Taking into account the baseline assumptions (Table I.1), near-term forecasts drawn from structural models, with off-model judgmental adjustments reflecting information that is not explicitly modeled, suggest that average CPI headline inflation will be about 8 per cent in Q4 of 2014-15, with a 70 per cent confidence interval of 6.8 per cent to 9.2 per cent. Thus, the risks to the target of ensuring CPI inflation at or below 8 per cent by January 2015 remain broadly balanced (Chart I.4). The near-term month-wise evolution of the inflation trajectory suggests that inflation will ease from the current level of close to 8 per cent to about 6 per cent by November. With favourable base effects reversing in the following months (Box I.1), inflation is likely to climb back to around 8 per cent by January through March 2015. Model projections over a longer monetary policy horizon, i.e., up to March 2016, assuming unchanged macroeconomic policies and structural characteristics of the Indian economy, suggest that inflation will gradually ease to 7.0 per cent in Q4 of 2015-16 with a 70 per cent confidence interval of 4.6 per cent to 9.4 per cent. This indicates that the upside risks to the target of 6 per cent by January 2016 are significant, especially with economic activity and aggregate demand expected to pick up and structural improvements in food supply taking time to fructify.
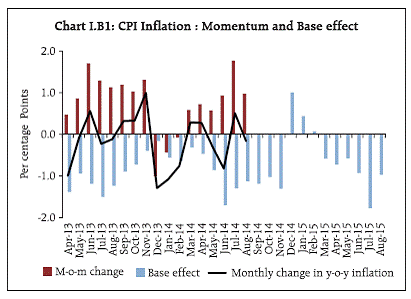
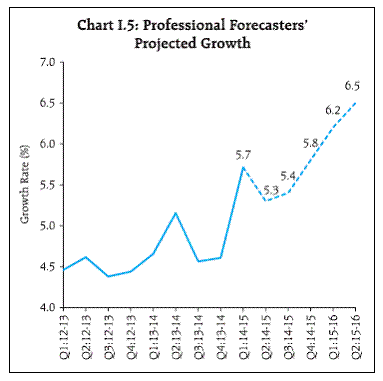
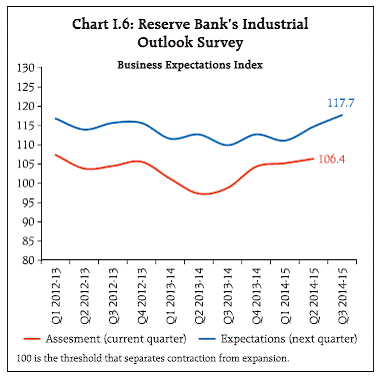
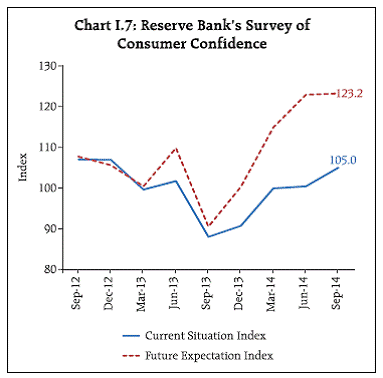
Real GDP growth surprised on the upside in Q1 of 2014-15, recording 5.7 per cent after remaining damped for eight consecutive quarters. On the supply side, the 12 per cent deficit in rainfall in the south west monsoon season as well as its uneven distribution and delayed kharif sowing relative to a year ago will drag down agricultural growth, which is evident from the first advance estimates of kharif production. The sharp pick-up in industrial activity in Q1 has weakened thereafter, with decline in production of both consumer durables and capital goods. However, business sentiment is on an upswing as reflected in financial market conditions. Standard and Poor’s have revised India’s sovereign rating outlook from negative to stable, which should contribute to brightening the prospects for investment and capital flows. Constituents of the ser vices sector are moving at different speeds. Construction activity should benefit from policy initiatives to boost affordable housing, investment in real estate, and refinancing of infrastructure projects coming back on-stream. Ahead of this recovery, bank credit to construction has been accelerating and should gain further momentum as efforts to improve credit disbursement support the revival of demand. On the other hand, financial and business services as well as social, community and personal services are unlikely to sustain the pace of expansion recorded in Q1 in view of sluggish banking activity and the expected fiscal consolidation. Box I.1: Base Effects and Inflation Forecasting 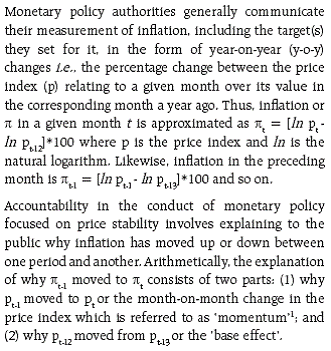 Short-term y-o-y inflation forecasts are fundamentally influenced by the base effect and, therefore, a good understanding of how and why inflation behaved in the base period is key to robust forecasts. Formally, the base effect has been defined as the contribution to changes in the annual rate of inflation from unusual or extreme changes in the price index (or sub-index) during the base period i.e., the period that is used as the basis for calculation of annual rates2. Forecasting y-o-y inflation thus involves two parts: (a) a good fix on base effects which is obtained from the momentum of inflation in the base period that is already known; and (b) projecting future momentum through time series techniques and structural models and converting them into price index values so that they can be expressed in y-o-y terms. The inflation outcome characterising the year 2013-14 as well as 2014-15 so far is a good example of the interaction between momentum and base effects as reflected in the observed volatility of headline inflation. In June 2014, the sharp increases in prices of vegetables resulted in high momentum of headline price increases, but y-o-y inflation moved down because of a favourable base effect from even higher momentum in June 2013. By contrast, vegetable prices spiked further in July 2014 relative to the preceding month, pushing up momentum of headline inflation and more than offsetting the favourable base effect. Consequently, y-o-y headline inflation rose sharply in July 2014 in comparison with June 2014. In August 2014, with base effects overwhelming the headline price momentum, which had seen some moderation due to decline in the extent of month over month (m-o-m) increase in vegetable prices, year on year (y-o-y) inflation registered a decline from July to August 2014 (Chart I.B1). Going forward, favourable base effects are expected to dampen headline inflation over September- November 2014, aided by a moderation in momentum as vegetable prices come off their recent peak. The evolution of headline inflation during December 2014 -February 2015 will likely be significantly influenced by unfavourable base effects arising out of the sharp fall in m-o-m changes in prices during the base period. This, in spite of a possible subdued momentum obtained from a seasonal softening of vegetable prices, would result in an upturn in inflation during December 2014-February 2015. Monetary policy in disinflationary mode along with normal monsoons next year could then mute the momentum of headline inflation. The favourable base effects from high inflation in June-August 2014 could operate in conjunction to produce an easing inflation trajectory in the middle of 2015-16. 1 Usually seasonal adjustments are made in order to get a clear picture of the underlying trend that is not blurred by very short-run predictable changes related to seasonal effects as observed in say agricultural production or consumer spending and the like. Month-on-month changes are also usually annualised to get an annual rate assessment corresponding to the manner in which inflation is communicated. 2 European Central Bank (2005), “Base Effects and their Impact on HICP Inflation in early 2005”, ECB Monthly Bulletin, January, pp. 31-32. Turning to the demand side, gross fixed capital formation should build upon the robust upturn in Q1 as announced policy measures to boost investment take effect. External demand is gradually improving, suggesting better prospects for export growth in the second half of 2014-15. Although corporate sales seem to be pointing to modest strengthening of consumption, rural demand is being moderated by slowing growth in agriculture. Forward-looking indicators extracted from surveys of real activity conducted by the Reserve Bank as well as other agencies reflect cautious optimism on the near-term outlook for growth. While professional forecasters expect only a gradual pick-up in growth after some deceleration in the second half of 2014 (Chart I.5), business expectations of corporates surveyed by the Reserve Bank are at an eleven-quarter high in Q3 of 2014-15 (Chart I.6). This is also corroborated by surveys conducted by other agencies, which ascribed upbeat business sentiment to formation of a stable government at the centre and the greater certainty about the policy environment, improvement in twin deficits, buoyant foreign capital inflows, a stable exchange rate and improved financial market conditions (Table I.2). Consumer confidence is also reviving, with the Reserve Bank’s survey indicating expectations one year ahead at their highest levels since the global financial crisis (Chart I.7).
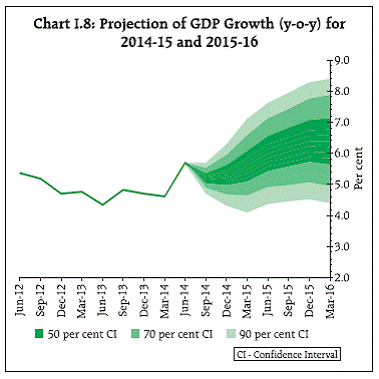
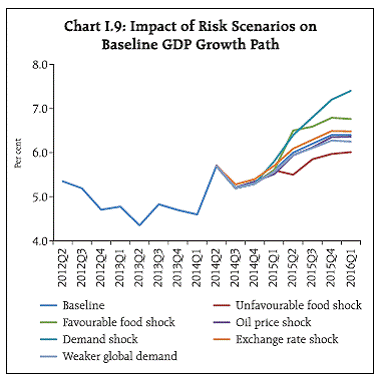
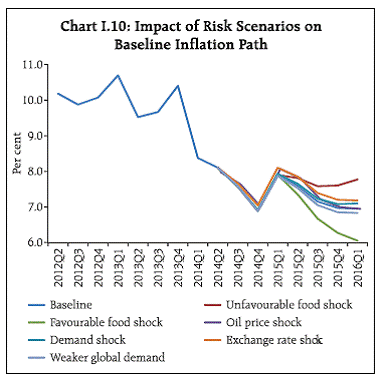
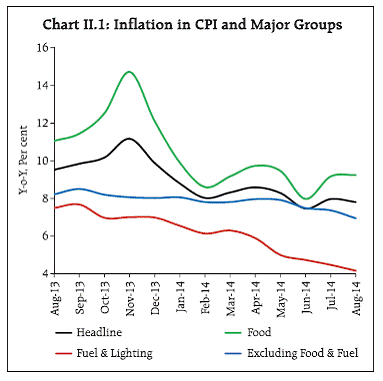
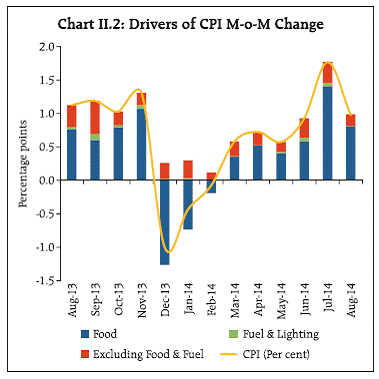
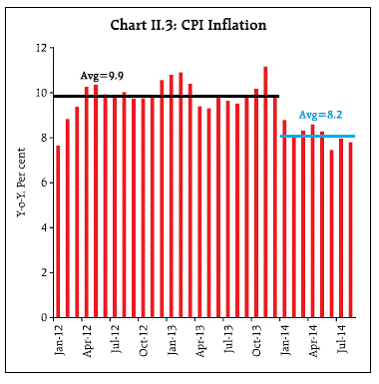
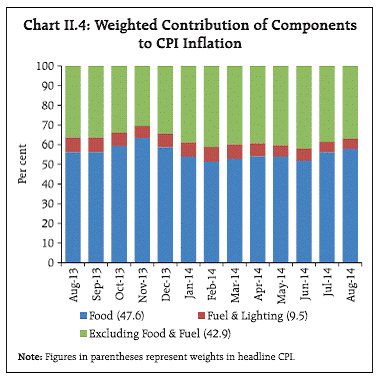
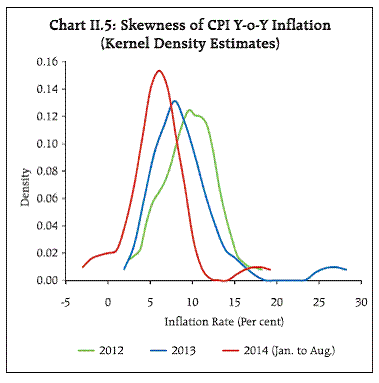
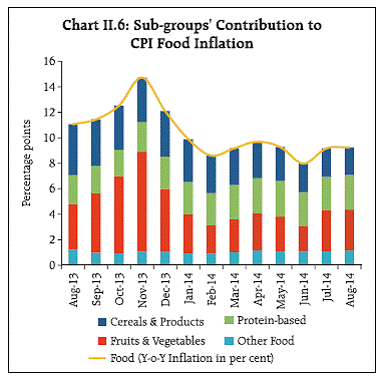
Model-based forecasts augmented with these forward-looking assessments indicate that the sharp pick-up in growth in Q1 of 2014-15 may not be sustained in Q2 and Q3 as the full impact of the monsoon deficiency plays out on agricultural activity, with spillovers to non-agricultural sectors through demand effects (Chart I.8). The outlook for services, and in particular, community, social and personal services is weak. For other categories of services a slow turnaround is expected in the second half of 2014- 15. Accordingly, prospects for reinvigoration of nonagricultural growth are expected to improve only gradually, gathering momentum in Q4 of 2014-15. Looking forward into 2015-16, the likely firming up of export growth and investment demand should support both manufacturing and service sector activity. Revival of stalled projects and the space created for private enterprise by ongoing fiscal consolidation should support a stronger step-up in the growth momentum in an environment of steady disinflation. For 2014-15, real GDP growth is projected to lie between 5 per cent and 6 per cent, with a central estimate of 5.5 per cent. This projection remains unchanged from the April projection with a better than expected industrial growth compensating for the likely decline in agricultural growth. GDP growth for Q4 of 2014-15 is projected at 5.6 per cent with a 50 per cent confidence interval of 5.1 per cent to 6.1 per cent. For 2015-16, real GDP growth is projected to rise to 6.3 per cent. The macroeconomic outlook is subject to risks from both global and domestic uncertainties. Risks from global adversities such as a slowdown in the pace of global recovery, financial market turbulence due to faster than expected tightening of monetary policy in advanced economies and hardening of commodity prices on geo-political tensions and/or weather-related supply disruptions could impact all emerging economies. On the other hand, domestic risks stem from a larger than expected negative impact of a skewed distribution of monsoon, inflationary impact of a stronger than expected improvement in domestic economic activity and exacerbation of exchange market pressures. The likely impact of these shocks on growth and inflation are assessed using a quarterly projection and policy analysis system. (a) Uncertainty Surrounding Global Recovery If global growth turns out to be weaker than projected in the July update of the IMF’s World Economic Outlook, due to either a lasting impairment of potential output, or financial vulnerabilities resurfacing and undermining consumer confidence, or the effects of monetary policy tightening, or a combination thereof, external demand conditions facing India’s exports could worsen, translating into a negative external shock for growth. A widening of slack in the global economy by 50 basis points would lead to a decline in India’s GDP growth from the baseline by about 20 basis points in 2015-16 (Chart I.9). Domestic inflation would also soften by about 10 basis points below the baseline, largely reflecting the fall in global commodity prices in response to higher slack in the global economy and their pass-through to domestic inflation (Chart I.10). (b) Reversal in Commodity Prices In the baseline, international crude prices are expected to gradually moderate through 2015 with alternate supply sources opening up amidst weak demand. Yet, a supply disruption induced imported inflation shock in the form of a 10 per cent increase in the price of the Indian basket of crude oil from the level assumed in the baseline could result in an increase in headline inflation by about 20 basis points above the baseline. The direct impact on domestic retail fuel prices will be reinforced by the second round impact on food, manufacturing and services prices. The crude oil price increase would have a minimal impact on GDP growth reflecting still low energy intensity of growth. (c) Below Normal Monsoon in 2015-16 As regards specific domestic shocks, the baseline trajectories of growth and inflation assume a normal monsoon in 2015-16 and moderate increases in minimum support prices. If these conditions are not realised, the shock to farm output, and through demand and input linkages to other sectors, could result in a decline in overall GDP growth by around 40 basis points below the baseline in 2015-16. This may lead to food price pressures persisting at the levels prevailing so far, pushing headline inflation by about 80 basis points above the baseline by the end of 2015-16. (d) Augmenting Supply Capacity A favourable shock to the baseline inflation path could also be envisaged if the recent initiatives to address food supply bottlenecks fructify on an enduring basis, especially through improvements in the supply chain, reforms in market infrastructure and a step-up in investment in agriculture. This may result in GDP growth accelerating by about 40 basis points in 2015-16 over the baseline, and a faster fall in food price inflation leading to a decline in headline inflation by around 90 basis points below the baseline by the end of 2015-16. (e) Faster Closing of Output Gap The future path of inflation could also be impacted by the uncertainties surrounding the outlook for growth. If real GDP growth turns out to be stronger by 100 basis points than expected in 2015-16, aggregate demand could rise sharply in the form of a pick-up in investment and consumer spending. This would result in a faster closing of the output gap, translating into higher underlying inflation and an increase in headline inflation by about 20 basis points above the baseline by the end of 2015-16. This relatively muted effect of a positive demand shock essentially reflects the initial conditions – the persisting slack in the economy. (f) Depreciation of the Rupee Another risk to the baseline inflation path is volatility in the exchange rate emanating either from global developments or a domestic demand shock. If the exchange rate depreciates by 10 per cent in 2015-16 below the baseline assumption, a rise in import costs would feed into higher input costs and over time, translate into higher output prices as firms pass on cost pressures. The direct and indirect impact of the exchange rate change would cause headline inflation to increase by about 30 basis points above the baseline. The deprecation of rupee may, however, provide some boost to exports, resulting in an increase in GDP growth by about 10 basis points The macroeconomic outlook presented in this chapter is one of gradual disinflation with growth gaining some momentum from Q4 of 2014-15 and improvement in macro-balances (Table I.3). Near-term risks appear to be abating, but medium-term risks are still on the upside. The outlook draws upon the assessment of macroeconomic conditions presented in Chapter II to Chapter V. The ebb of headline consumer price inflation through 2014-15 so far was interrupted by a spike in vegetable prices in July 2014 due to monsoon-induced supply disruptions. Excluding food and fuel, however, inflation has been declining, aided by the disinflationary stance of monetary policy. Headline inflation appears well aligned with the target of 8 per cent set for January 2015. As for costs, there are indications of some deceleration after a sustained period of high growth. In January 2014, the Reserve Bank formally adopted a glide path for disinflation in terms of headline consumer prices1, with milestones of 8 per cent by January 2015 and 6 per cent by January 2016. Drawing from the recommendations of the Expert Committee to Revise and Strengthen the Monetary Policy Framework (Chairman: Dr. Urjit R. Patel), this ushered in a fundamental regime shift in the conduct of monetary policy in India. The Reserve Bank anchored this change by tightening monetary policy in the January 2014 policy review and maintained this tight stance in subsequent policy reviews so as to set the economy firmly on the disinflation path. Since then, inflationary pressures have fallen in a broadbased manner. This has been aided by measures taken by the Government to control the fiscal deficit and to augment food supply, disincentivise agricultural exports and reform agricultural marketing policies. Inflation is ultimately determined by the stance of monetary policy, notwithstanding short-run disturbances emanating from sectoral price pressures. Reflecting the ongoing transmission of monetary policy impulses through the economy, inflation excluding food and fuel has declined from 8.5 per cent in September 2013 to 6.9 per cent in August 2014. Food inflation has also moderated in tandem from double digits to 9.2 per cent in August 2014, punctuated by sharp inclement weather-driven spikes. Fuel inflation has been steadily falling as administered increases in kerosene, cooking gas and coal prices have been held back while electricity price revisions have been low and infrequent. Accordingly, headline inflation has fallen from 11.2 per cent in November 2013 to 7.8 per cent in August 2014 – within range of the target of 8 per cent for January 2015 (Chart II.1). Even as headline year-on-year inflation has been moderating, there was a sharp pick-up in month-on-month change in prices – or momentum – in July caused by sharp increases in food prices. The momentum, however, moderated in August (Chart II.2). The impact of higher momentum on the headline has been largely masked by favourable base effects. The magnitude of sequential increases in prices in CPI excluding food and fuel were also higher in June and July 2014, though it reversed in August. A marked feature of the years following the global financial crisis of 2008-09 has been the persistence of CPI inflation in India. While there has been a downward correction in average headline inflation in the recent period beginning in January 2014 relative to 2012 and 2013, its inertia at elevated levels relative to tolerance thresholds warrants careful scrutiny of the sources of this persistence so as to break unidirectional expectations surrounding the inflation outlook (Chart II.3. and Box II.1). Recent changes in headline inflation are observed to be sensitive to the behaviour of some of its components, which appear to be moving in diverse directions and exerting differing pulls (Chart II.4). Analysis of the cross-sectional distribution of inflation assumes importance in this context to ascertain whether or not transitory elements are generating relative price changes which could be impacting aggregate price movements enduringly. In particular, India’s inflation history shows that supply shocks tend to produce a positive skew to its distribution, with a few items pushing the average inflation up on a sustained basis. Headline CPI inflation has largely had a positive skew, indicating that relative price pressures may be contributing to the overall inflation persistence (Chart II.5). Box II.1: Post-crisis Inflation Persistence in India Inflation persistence is the tendency for shocks to push the inflation rate away from its steady state. Sources of inflation persistence have been identified as: (a) intrinsic persistence or backward-lookingness in pricesetting behaviour; (b) extrinsic persistence arising out of the mark-up over costs; (c) expectations-based persistence emerging from the nature of inflation expectations; and (d) policy-driven persistence from monetary policy regime shifts. For a country like India which is exposed to a variety of shocks, this disaggregate approach assumes critical importance. Recent studies in the Indian context suggest that: (i) inflation persistence increased in the post-global crisis period; (ii) both intrinsic and extrinsic persistence declined while expectations-driven inflation persistence increased; (iii) both intrinsic and extrinsic inflation persistence have, however, remained high relative to the cross-country experience; and (iv) the increase in expectations-driven inflation persistence could be due to consumers’ incomplete information on the nature of economic shocks and also unhinged credibility around the ability of macroeconomic policies to deliver low and stable inflation. Food constitutes about 48 per cent of the CPI and has been the major source of upside pressures on retail inflation. Food price shocks have large and persistent effects on inflation expectations, with second-round effects propagating into prices of items other than food and resulting in a generalisation of inflation. Within the food group, cereals constitute about 15 per cent of the CPI but the sub-group’s contribution to food inflation has declined over the preceding 12 months (Chart II.6). The group of protein-based items (eggs, fish, meat, milk and pulses), which has been experiencing persistent upside pressures, contributed about a sixth of overall inflation through 2014-15 so far. Fruits and vegetables have a share of merely 7 per cent in the index, but contributed about a fifth of headline inflation in July and August, and are marked by sharp spikes in prices. Headline inflation is also vulnerable to shocks from fuel prices, typically emanating from administered price changes in response to international crude price movements. The category fuel and lighting accounts for 9.5 per cent of the CPI. Contribution to headline inflation from this category has been falling on account of inadequate administered price revisions. However, the large element of suppressed inflation in subsidised kerosene and liquefied petroleum gas (LPG) warrants a precautionary monetary policy stance in the context of under-recoveries of oil marketing companies (OMCs) which may push up outgoes on subsidies (Table II.1).
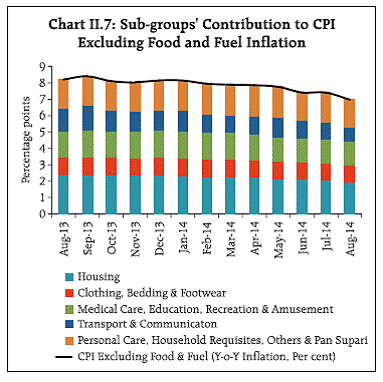
CPI inflation excluding food and fuel has been falling gradually since September 2013 in response to monetary policy actions, with favourable implications for the evolution of headline inflation. Within this category, housing2, contributing 11 per cent to headline inflation through 2014-15 so far, has been edging down with rentals easing in recent months. Inflation in respect of transport and communication – which mainly comprises petrol and transport fares – has experienced moderation since October 2013, largely reflecting the easing of international crude prices, stability in the exchange rate and favourable base effects (Chart II.7). The category of ‘others’ in the CPI covers a heterogeneous group of personal non-tradable services with annual price changes persistently in double digits barring June 2014. This suggests that wages have been imparting upside price pressures to these labour-intensive services and on an economy- wide basis, they can lead to the generalisation of inflationary pressures. Other indicators of retail inflation such as consumer price indices for industrial workers (CPI-IW), agricultural labourers (CPI-AL) and rural labourers (CPI-RL) ebbed in Q1 of 2014-15 and moderated further in July-August 2014. Wholesale inflation measured by the wholesale price index (WPI) as also the indicator of economy-wide price trends – the GDP deflator – have decelerated (Table II.2). Cost pressures from both domestic and external sources have played a significant role in the coexistence of elevated inflation and a negative output gap, denting the efficacy of monetary policy in bringing inflation down to the desired extent. Supply bottlenecks in various sectors of the economy have imparted cost-push rigidities to the level and path of inflation. Imported inflation, mainly associated with the prices of crude petroleum, in 2014-15 so far, have eased. Combined with a stable exchange rate, market-determined prices of petroleum, oil and lubricants (POL) could moderate. Furthermore, the staggered increases in the administered prices of diesel coupled with softening of international crude oil prices have wiped out the diesel under-recovery of OMCs in September 2014.
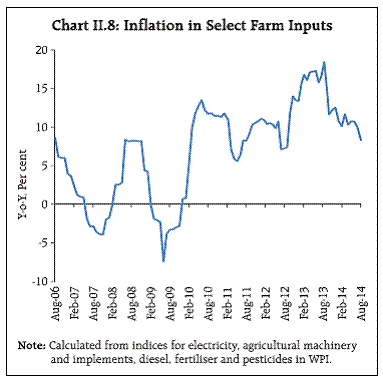
Costs of farm inputs have seen some deceleration in the last one year (Chart II.8). Industrial raw material cost pressures have been easing. The Reserve Bank’s industrial outlook survey indicates that fewer firms assessed that input prices went up in Q2 of 2014- 15 than in the corresponding quarter a year ago. At the same time, fewer firms expect increase in selling prices, reflecting perceptions of still weak pricing power (Table II.3).
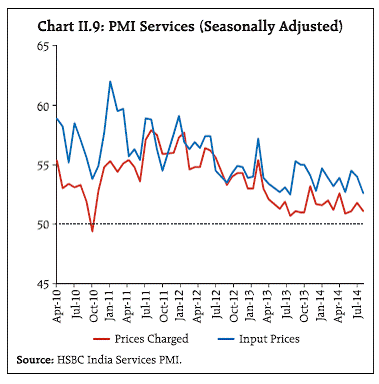
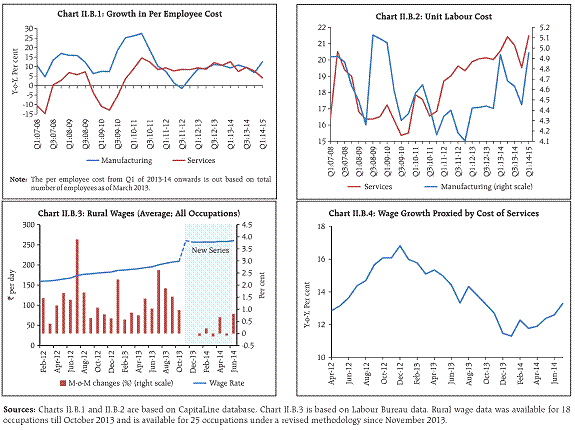
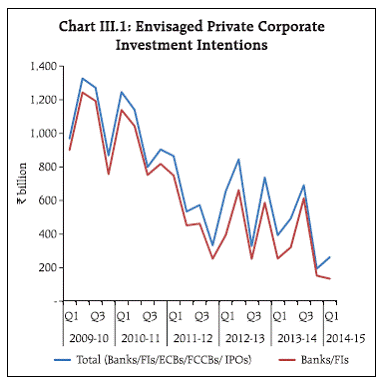
Services sector input cost pressures are perceived by purchasing managers to be moderating from their recent peak in 2011. Weak pricing power is, however, preventing the pass-through of even these moderate increases into selling prices (Chart II.9). Trends in labour costs have to be assessed separately for both formal and informal sectors, given the dualistic character of the Indian labour market (Box II.2). Monetary policy has to be watchful about wage-price spirals posing risks to the disinflationary momentum. Inflationary pressures are expected to ease further in Q3 as the effects of weather-related food price shocks wane and the usual seasonal trough sets in. Cost pressures from both domestic and external sources are softening. The path of headline inflation in the coming months will be impacted by favourable base effects. As they dissipate from December onwards, headline inflation could turn up in the last quarter of 2014-15. Potential administered price revisions carry upside risks to the near-term inflation outlook. It is critical that these dynamics are carefully monitored to ensure that the disinflation momentum is sustained. 1 Unless stated otherwise, consumer prices are measured by the consumer price index (combined) base: 2010=100. 2 CPI housing (in terms of rentals) is collected only in the urban areas. The weight of housing in the CPI-Urban index is 22.5 per cent and in CPI-Combined index is 9.8 per cent Box II.2: Measurement of Wages/Labour Costs Wages are a key determinant of the inflation process influencing cost conditions and also setting up – through rigidities in their formation – the short-run trade-off that monetary policy has to address. Unlike most advanced and many emerging market economies, the heterogeneity of labour markets and large presence of self-employed as well as the unorganised sector makes it difficult to collate and compile labour market and wage statistics on a regular basis. In order to assess wage pressures, therefore, the Reserve Bank uses a wide range of information. (i) In the organised sector, growth in per unit employee costs1 extracted from balance sheets of companies engaged in manufacturing and services have remained moderate in recent quarters (Chart II.B.1). (ii) Unit labour costs (ULCs), arrived at as a ratio of staff cost to value of production, have risen in the recent period for both manufacturing and services sector entities (Chart II.B.2). (iii) Rural wages gauge wage pressures in the unorganised sector. Notwithstanding definitional changes, starting November 2013, which render temporal comparison difficult, modest softening in monthly rural wage growth appears to be underway (Chart II.B.3). (iv) Information on item level indices for services in the CPI (IW) can proxy for wages as they predominantly reflect wages paid to labourers. A combined index incorporating seven such services2 indicates that the cost of these services increased in recent months (Chart II.B.4). 1 The estimate is based on data for around 400 companies in manufacturing and around 200 companies in services. Per employee cost = Total employee expenses/total number of employees. 2 Includes doctors’ fees, private tuition fees, cycle rickshaw fares, barber charges, washing/ironing charges, tailoring charges and laundry charges. Domestic activity recorded a distinct upturn during Q1 of 2014-15. Improvement in business confidence has driven up investment demand after a two year hiatus, but consumption spending remains subdued. Industrial activity slumped in July after having picked up in Q1 supported by a steady rise in exports. Skewed and deficient monsoon is likely to dampen growth in the agriculture sector while the prospects for services are still mixed. The Indian economy expanded at a faster than expected pace in Q1 of 2014-15 after eight successive quarters of sluggish growth. This has infused business sentiment with guarded optimism on the near-term outlook. Exports of goods and services in real terms have recorded double-digit growth for four successive quarters in spite of headwinds from a weak global economy and domestic supply constraints. Nevertheless, risks to agriculture from the skewed spatial distribution of the south-west monsoon and the still sluggish prospects for service sector activity will challenge efforts to sustain the momentum of activity over Q2 and Q3 of 2014-15. Real GDP at market prices grew at 5.8 per cent in Q1 of 2014-15 - higher than 4.2 per cent a year ago - buoyed by net exports and a turnaround in gross fixed capital formation (Table III.1). In spite of election-related expenditure in April and May, the erosion of purchasing power by inflation and moderating real wage growth took its toll and the contribution of private final consumption expenditure (PFCE) to GDP growth declined over Q4 of 2013-14. Gross fixed capital formation (GFCF) grew robustly at 7.0 per cent, though partly lifted by the base effect of decline of 2.8 per cent in Q1 of 2013-14. Subsequently, however, the contraction in capital goods production in July 2014 and sluggish imports of capital goods have raised concerns about sustainability of the investment recovery. Accordingly, the growth in new investment intentions of the private corporate sector has been modest (Chart III.1). Sustained progress in putting stalled projects back to work is key to a durable reinvigoration of animal spirits in investment activity. This could also crowd-in new investment and provide a much needed stimulus to aggregate demand. So far, however, surmounting this gridlock has proved formidable as a number of factors are driving the time overruns in project implementation, including land acquisition, forest clearance and supply of raw material. Yet another binding constraint is the energy sector outlook with uncertainty regarding coal supply.
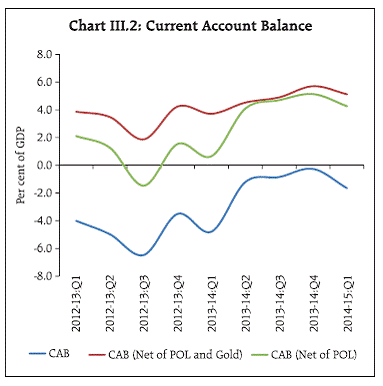
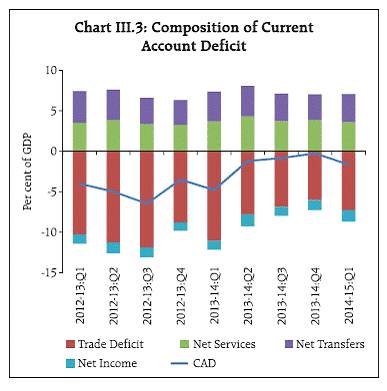
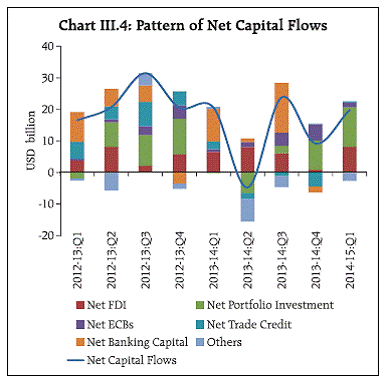
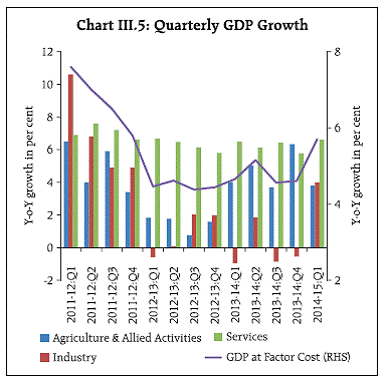
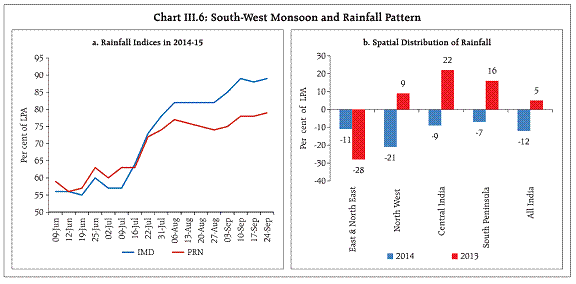
Government final consumption expenditure (GFCE) decelerated sharply in Q1 of 2014-15 than a year ago. In terms of proportion to budget estimates (BE), the key deficit indicators of the central government, viz., the revenue deficit (RD) and the gross fiscal deficit (GFD) were marginally lower during 2014-15 (up to July) than a year ago, mainly on account of lower plan revenue expenditure and capital expenditure on defence. Expenditure on subsidies was significantly lower at 33 per cent of BE from 51 per cent a year ago. Tax revenue dipped to 15 per cent of BE than 16.4 per cent a year ago on lower collections under custom duties and union excise duties. Non-tax revenues were also lower, mainly on account of interest and dividend receipts (Table III.2). Going forward, introduction of goods and services tax (GST) will provide a boost to the manufacturing sector. Net exports rose by 30.2 per cent in Q1 of 2014-15, providing valuable contribution to aggregate demand in spite of a subdued global recovery. Underpinning this improvement, export growth picked up to 11.5 per cent in Q1 of 2014-15, benefiting from the competitive edge stemming from rupee depreciation in 2013-14. Reflecting the fall in merchandise trade deficit, a small rise in net exports of services, higher net investment income outgo related to servicing of equity and debt obligations and a marginal fall in net private transfers, the current account deficit (CAD) shrank to 1.7 per cent of GDP in Q1 of 2014-15, down from 4.8 per cent a year ago (Charts III.2 and III.3). Net of POL imports, the current account balance remains in surplus since Q4 of 2012-13. The financial account of India’s balance of payments in Q1 of 2014-15 was dominated by direct and portfolio investments. External commercial borrowings (ECBs) and trade credit also recorded net inflows (Chart III.4). India’s external sustainability indicators recorded a modest improvement, contributed by a build-up of foreign exchange reserves. The net international investment position (NIIP) remained stable at 17.6 per cent of GDP in March 2014 which is sustainable from the point of view of the debt servicing profile and a viable level of the CAD. Assessment of reserve adequacy should take into account not only reserves as measured conventionally but also off-balance sheet buffers in the form of net outstanding forward purchases of the Reserve Bank, which stood at US $ 5.4 billion as at end-July 2014, and bilateral/multilateral swap lines, such as the Reserve Bank of India and Bank of Japan Currency Swap Arrangement of US $ 50 billion and the Brazil, Russia, India, China and South Africa (BRICS) Contingent Reserve Arrangement (CRA), 2014. Under the CRA, each country’s maximum access limit is equal to a multiple of its own commitment to the total pool of US $ 100 billion. Real GDP at factor cost rose by 5.7 per cent in Q1 of 2014-15, shrugging off eight successive quarters of sluggish momentum with industrial growth, in particular, returning to positive territory after two quarters (Chart III.5 and Table III.3). The prospects for agriculture in 2014-15 will likely be impacted by the vicissitudes of the south-west monsoon. Setting in late, it gathered momentum rapidly from July and rainfall deficiency measured by the rainfall index of the India Meteorological Department (IMD) progressively narrowed from 43 per cent at the end of June to 12 per cent by late September. The Reserve Bank’s production-weighted rainfall index (PRN)1 indicates a larger rainfall deficit. The spatial and temporal distribution of rainfall has been skewed (Chart III.6). The kharif foodgrain production is likely to decline by 6.9 per cent in 2014-15, while production of other crops including oilseeds and commercial crops is also likely to suffer. On the other hand, reservoir levels have risen to 79 per cent and therefore, the rabi foodgrains output, which accounts for 50.7 per cent of total production on average, could largely alleviate kharif shortfalls.
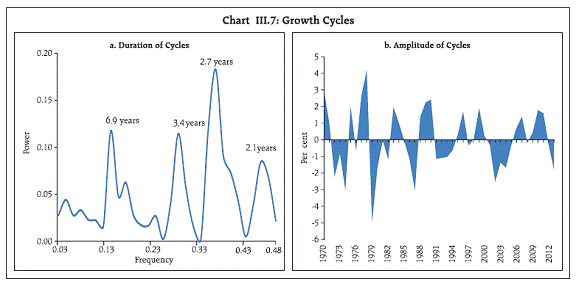
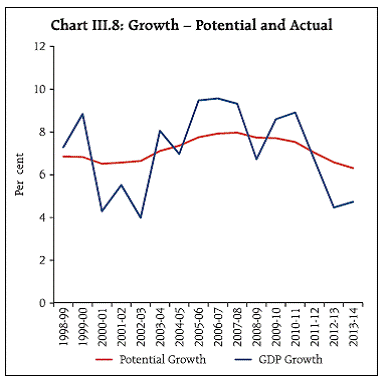
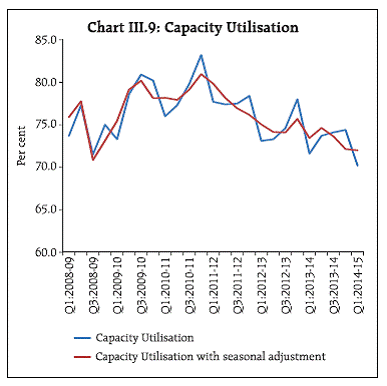
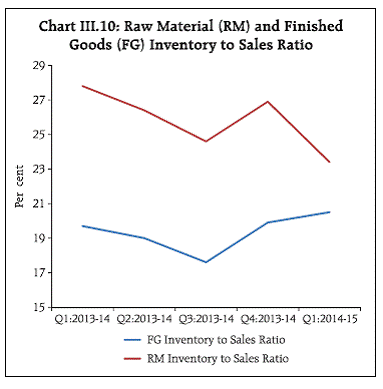
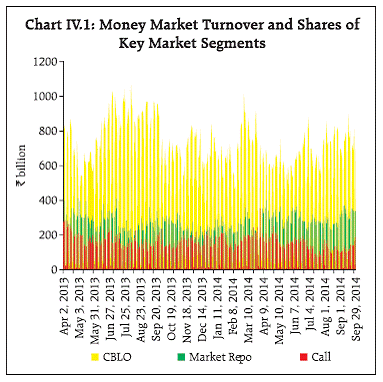
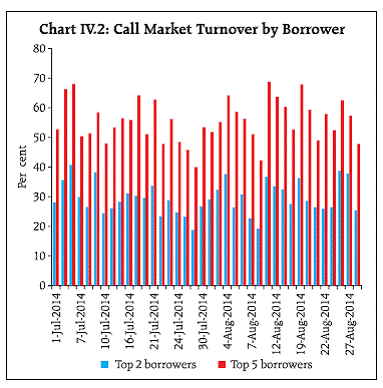
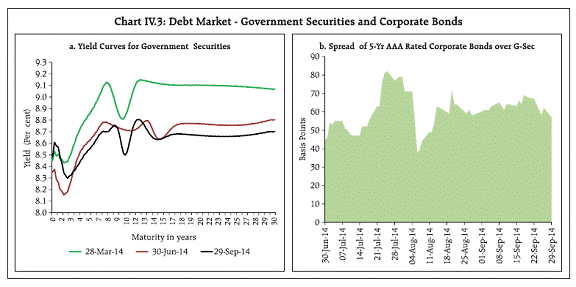
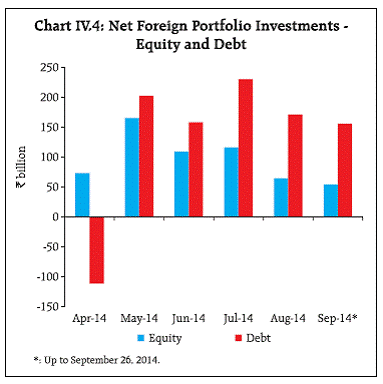
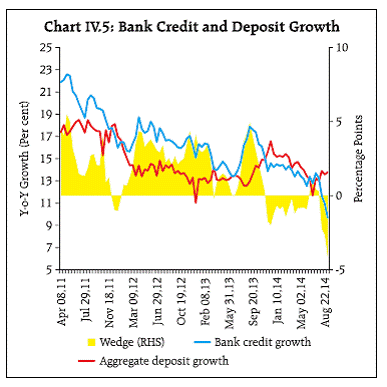
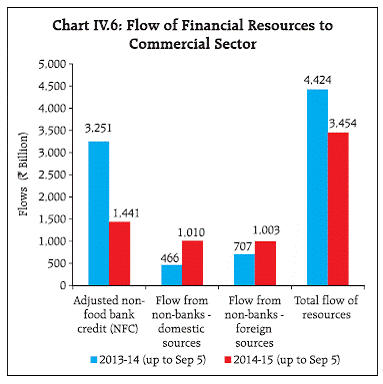
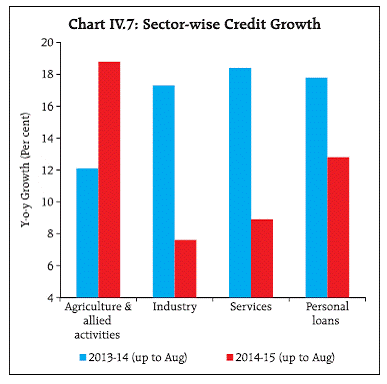
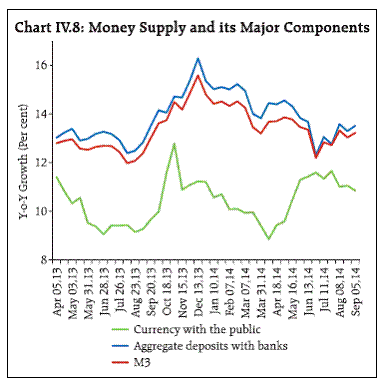
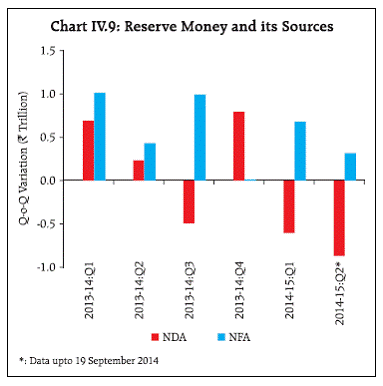
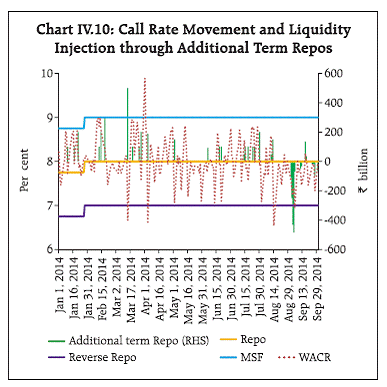
The index of industrial production (IIP) grew by 4.2 per cent in Q1 of 2014-15, its fastest pace in 11 quarters. The pick-up in industrial activity in Q1 was driven by the capital goods sector, which recorded the highest growth in the last three years. Mining activity also recovered in Q1 from a 13-quarter slump and electricity generation registered a record level of production. However, its momentum fell in July 2014 as the IIP growth slipped to 0.5 per cent. The slowdown in manufacturing, especially the contraction in both consumer durable goods and capital goods production has added further uncertainty to the prospects for this sector. Core infrastructure industries (coal, crude oil, natural gas, refinery products, fertilisers, steel, cement and electricity), which constitute 37.9 per cent of the IIP, also lost some momentum in July. Service sector activity, which constitutes two-thirds of the domestic economy, picked up in Q1 of 2014-15, expanding by 6.6 per cent. Within the sector, different constituents moved at differing speeds. Construction sector benefited from the delayed arrival of the southwest monsoon. Community, social and personal services also recorded robust growth. On the other hand, the growth of financing, insurance, real estate and business services lost some momentum, reflecting the deceleration in growth of credit and deposits in the banking system. Services PMI, after peaking in June 2014, has moderated in subsequent months. Lead indicators of activity in the services sector for Q2 exhibit a mixed picture. III.3. Cyclical and Structural Aspects of Growth Dynamics An assessment of the aggregate demand-supply balance in the economy would be usefully informed by an empirical measurement of its potential. This involves an evaluation of two elements: (a) the cyclical behaviour of output which provides insights into the role of excess/deficient demand in the state of the economy; and (b) trend output which enables a fuller evaluation of the role of aggregate supply determined by the production structure, institutional characteristics and constraints thereon. Estimating variances in GDP over the frequency domain helps to ascertain the presence of cycles as well as to measure the duration of the fluctuations. Disentangling of irregular, seasonal, cyclical and trend components suggests that the majority of cycles in India have a duration of about 2.7 years and cycles of shorter or longer durations are less frequent in occurrence. The amplitude of cycles has dampened over time, pointing to increasing resilience of economic activity to shocks (Chart III.7). Cycles are essentially fluctuations around its potential trend. Potential output is intrinsically unobservable and measuring it is challenging at all times, but especially so in the wake of a major crisis. Measurement typically suffers from high sensitivity to methodology: for instance, the standard univariate filters suffer from bias towards the choice of end points and lack an underlying economic basis. Estimates from multivariate filters derived from a small macroeconomic model which minimise the sensitivity to end points, suggest that India’s potential output growth has been falling since 2008-09 to about 6.3 per cent in 2012-13 and since then the output gap has turned negative (Chart III.8). Juxtaposing estimates of average duration of cycles and potential growth suggests that the Indian economy may be approaching a turning point after two years of sluggish growth but, given the decline in potential output growth, the expansion phase may be shallower than before. Capacity utilisation levels and inventory cycles provide information on the degree of slack in the economy. The order books, inventories and capacity utilisation survey (OBICUS) of the Reserve Bank points to seasonally adjusted capacity utilisation recording a modest decline in Q1 (Chart III.9). Finished goods as well as raw material inventories as ratios of sales continued to decline in Q4 of 2013-14, corroborating the presence of slack in the economy (Chart III.10). In summary, there are tentative signs of investment turning around in an environment of improving macroeconomic fundamentals and political stability. Downside risks to a durable pick-up in investment and growth stem from domestic supply constraints, particularly with regard to power, a reversal in the global interest rate cycle and re-emergence of geopolitical risks. 1 PRN is calculated using contribution to total foodgrain production by each State. IV. Financial Markets and Liquidity Conditions Financial markets have been upbeat, reflecting ebbing volatility and strengthening confidence in the outlook shared by domestic and foreign investors. Domestic money, debt and foreign exchange markets have remained stable and stock prices reached record highs. Growth in credit in the banking system, however, has turned sluggish. The Reserve Bank implemented a new liquidity management framework which provides greater assurance and flexibility on liquidity. Domestic financial markets have been buoyant through Q2 of 2014-15, spurred by the risk-off search for yields in international markets, and a pick-up in business confidence domestically with the onset of political stability. The ebbing of international crude oil prices with the easing of geo-political tensions and expectations of improvement in domestic macro-fundamentals boosted market sentiment. Overnight money market rates hardened during July as liquidity condition was tight. From mid-August, however, money market rates moderated, while in September, barring a brief spike on account of advance tax payments, rates eased below the liquidity adjustment facility (LAF) repo rate. A distinct feature of this period has been the drop in call money volumes, reflecting shifts by banks to the collateralised overnight segments. The call money market currently accounts for around 10 per cent of the total turnover in the overnight segment (Chart IV.1). The thinness of the call money market tended to amplify volatility in July and early August with the top five borrowers accounting for more than 50 per cent of call market turnover (Chart IV.2). In the government securities market, yields inched up in the first half of July, trading with a bearish note as geo-political tensions in the Middle East pushed up crude oil prices. Subsequently, bullish sentiment returned on the back of announcement of a new 10-year benchmark security and re-adjustment of limits for investment by foreign institutional investors (FIIs) in government securities. Positive sentiment spilled over into August, boosted by the reduction in notified amounts under the remaining primary auctions for the first half of the year as well as the easing of crude oil prices as tensions in the Middle East and Ukraine abated. In September, yields moved in a tight range in the absence of any triggers. The 10-year yield declined through Q2 from 8.7 per cent at the end of June to 8.5 per cent on September 29 (Chart IV.3). Trading volumes have declined sizeably throughout the quarter. The corporate bond market recorded a pick-up in activity during Q2 with an increase in offerings of public issues and rights issues, partly reflecting tightening bank credit conditions. Debt mobilisation through public issues and private placements has been significantly higher during July-August 2014 than that in the preceding quarter. Foreign portfolio investors (FPIs) invested `1,124 billion in the corporate bonds as on September 29, 2014 which amounted to about 46 per cent of the limit. Yields of AAA rated corporate bonds generally moved in line with gilt yields, while spreads have been broadly stable after picking up in early August. In the foreign exchange market, the exchange rate of the rupee has moved in a narrow range of `59.7 and `61.6 against the US dollar during the quarter. Pick up in import demand and strengthening of the US dollar modestly weakened the rupee in July and early August. Thereafter, bunched inflows on account of FIIs, particularly into the debt market, and positive sentiment sparked by a narrower than expected current account deficit for Q1 as well as the credibility of fiscal consolidation helped the rupee to appreciate. In September, the rupee generally remained range-bound with pessimism on US interest rate expectations offset by positive sentiment triggered by the upturn in India’s GDP growth in Q1 and easing of tensions in Ukraine. The softening of crude oil prices also supported the rupee. For the quarter as a whole, the rupee depreciated against the US dollar albeit with some appreciating bias during the second week of August to first week of September. The rupee was at `61.43 against the US dollar on September 29, 2014 (Table IV.1). The rupee has been appreciating in nominal effective terms since March 2014. Against the euro, the rupee appreciated by 5.2 per cent during Q2. Since July, forward premia have softened, tracking the spot market. Equity markets rose through Q2 to reach historic highs on formation of a stable government at the centre, modest improvement in corporate earnings and positive expectations following exemption granted to banks by the Reserve Bank on reserve requirements for raising funds for infrastructure. The uptrend generally tracked global equity markets. Expectations of quantitative easing by the ECB, sustained FII investments (Chart IV.4), easing geo-political tensions and the resulting softening of crude oil prices and the recent revision in India’s sovereign rating outlook from negative to stable by Standard & Poor’s helped in boosting equity markets. Towards the end of the quarter, the equity markets pared some of the gains on concerns following geo-political tensions in Syria and the Supreme Court’s verdict to de-allocate coal blocks. During Q2 so far (up to September 29, 2014), both the BSE Sensex and NSE Nifty recorded an increase of around 5 per cent. In the primary market, activity picked up mainly on the back of issuances through qualified institutional placements (QIPs) for debt repayment and capital expenditure. The Securities and Exchange Board of India (SEBI) announced a slew of measures related to IPOs and offers-for-sale, including 25 per cent public shareholding norms for public sector undertakings as also issued guidelines for Real Estate Investment Trusts (REITs) and Infrastructure Investment Trusts. In addition, the government decided to raise about `43.5 billion through disinvestment of public sector undertaking (PSU) shares. The credit market has been subdued through Q2, with non-food credit growth decelerating on account of risk aversion related to asset quality as well as weak demand in general. With deposit growth remaining largely flat, a decline in credit growth led to a negative wedge (since August 2014) between credit and deposit growth, indicative of an increase in availability of structural liquidity with banks (Chart IV.5). Mirroring the slowing of bank credit growth, the flow of financial resources to the commercial sector has been lower than a year ago and higher funding has been obtained from non-bank sources (Chart IV.6). Bank credit to agriculture recorded a higher year-on-year growth of 18.8 per cent in August 2014 as compared with 12.1 per cent in August 2013. Growth in credit to industry decelerated sharply to 7.6 per cent in August 2014 from 17.3 per cent in August 2013 with lower growth in sectors such as infrastructure, basic metals, textiles, chemicals and food processing industries. Credit growth to the services sector also decelerated substantially during this period (Chart IV.7). This slowdown mainly reflects medium and large scale industries sourcing funds through commercial paper (CP) and external commercial borrowings (ECBs), sales of assets by banks to asset reconstruction companies (ARCs), bulk repayments by oil/fertilizer PSUs and reduction in banks’ exposures in view of the stress on assets. During 2014-15 so far (up to September 25), term deposit rates and weighted average lending rates (WALR) have softened marginally. With moderation in inflation, however, this has translated to a modest tightening of credit conditions in real terms. The transmission of policy actions across market segments has been asymmetrical in various phases of the interest rate cycle (Table IV.2). A key factor influencing financial market behaviour is the movement of liquidity which, in turn, reflects the interplay of structural and frictional factors impinging on the system. A broad measure of liquidity encapsulating the impact of both factors is money supply or M3. The growth rate (year-on-year) of money supply at 13.2 per cent during 2014-15 (up to September 5) has been running somewhat higher than a year ago (Chart IV.8). The major components, i.e., currency with the public and deposits, rose at a faster pace this year. Currency demand was higher on account of the spending during the general elections in April-May, but it has fallen back to usual levels in subsequent months. Movements in reserve money essentially capture the Reserve Bank’s response to various autonomous forces impacting liquidity conditions. The expansionary effects of the Reserve Bank’s operations in the foreign exchange market – which experienced sizable surplus conditions through most of 2014-15 so far – were more than offset by a decline in net domestic assets (Chart IV.9). The choice of instrument for liquidity management is based on an assessment of the sources of liquidity pressures from time to time - whether frictional or structural; transient or lasting. With call rates trading with a softening bias below the LAF repo rate during the first week of July, a 4-day term reverse repo was conducted to absorb excess liquidity, but it met with a tepid response as market participants showed reluctance to part with liquidity over periods beyond 24 hours. With spending by the government delayed by the passing of the Union Budget, liquidity conditions tightened again, and the call rates tended to hover above the repo rate, occasionally rising towards the MSF rate. Six special term repos of tenors varying between 3-day to 7-day for a cumulative amount of `650 billion were conducted. By the first week of August, liquidity eased as Government spending began to gather momentum and the call rate moved down again to sub-repo rate levels. Thereafter, it reversed and as liquidity tightened on account of the build-up in cash balances of the Government, the Reserve Bank conducted one special term repo and two variable rate overnight repos, in addition to its regular operations, for a total amount of `247 billion (Chart IV.10). By mid-August, increasing expenditure by the Government along with a pick-up in deposits relative to credit off-take significantly expanded system-wide liquidity through the rest of the month and the first half of September. With effect from September 5, the Reserve Bank revised and fine-tuned its liquidity management framework under which overnight variable rate reverse repo auctions were conducted in the first half of September to absorb excess liquidity (Box IV. 1). In summary, the progressive evolution of the term repo auctions as the main instrument of frictional liquidity management is expected to improve the transmission of policy impulses across the interest rate spectrum. Money, debt and foreign exchange markets have generally mirrored liquidity conditions and will follow incoming information, both global and domestic. Equity markets have displayed robust optimism and may continue to be supported by the global search for yields, although reversal in market sentiments surrounding the US monetary policy tightening remains a clear risk. Credit growth is expected to pick-up in the second half of 2014-15 as the industrial recovery gains momentum. Box IV.1: Liquidity Projections and the New Liquidity Management Framework The Reserve Bank’s operating framework of monetary policy aims at anchoring the weighted average call rate around the policy repo rate as the first leg of monetary policy transmission. Liquidity management broadly encompasses: (a) the ability to generate precise projections of the likely evolution of the liquidity conditions driven by autonomous factors; and (b) timely use of appropriate discretionary liquidity injection/ absorption measures (Table IV.B.1). Near term forecasts of liquidity incorporate full information judgement and time series estimation to capture momentum, seasonality and special factors such as festivals. The Reserve Bank has put in place a revised liquidity management framework since September 5, 2014. Its features include: (a) assured access to liquidity of 1 per cent of NDTL (excluding ECR) in the form of bank-wise overnight fixed rate repos of 0.25 per cent of NDTL and the balance through variable rate 14- day term repos; (b) more frequent auction of term repos during a fortnight, allowing flexibility to banks to alter their liquidity assessment four times during the fortnight and participate in auctions accordingly; and (c) higher frequency of access to Reserve Bank’s overnight liquidity, with the introduction of variable rate overnight repos/reverse repo auctions between 3 to 3.30 PM, besides extending the timing of ECR facility to 5 PM.
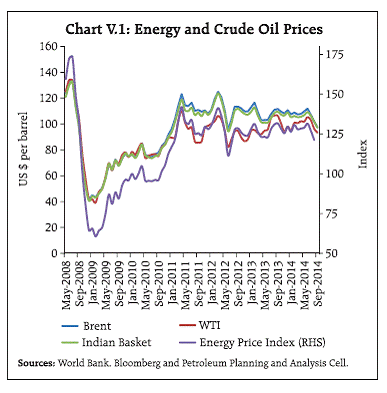
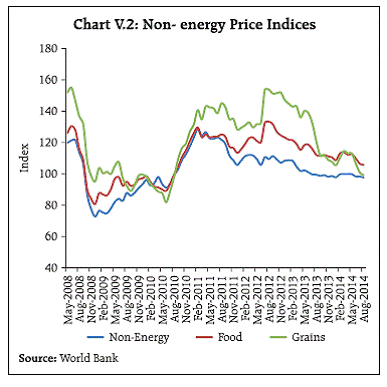
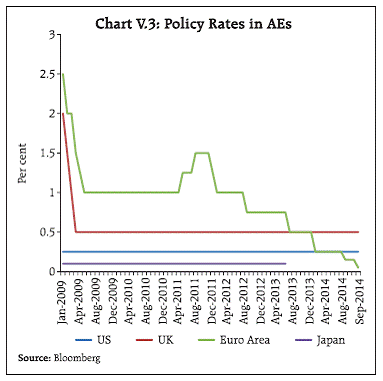
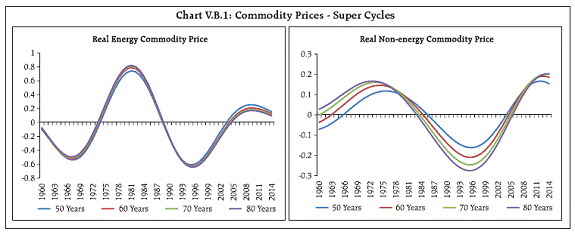
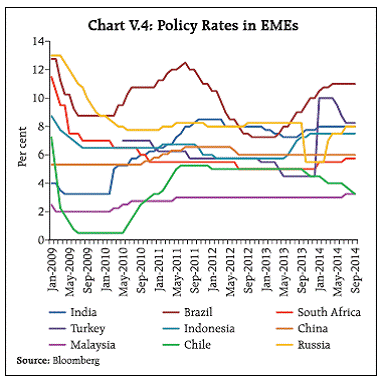
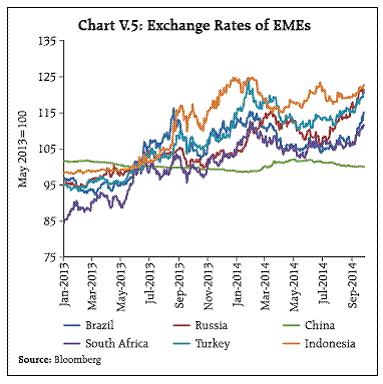
Economic activity in the advanced economies turned up in Q2 of 2014, while in emerging market economies, it generally decelerated. Inflation in the advanced economies continues to be benign and below set targets, as economic slack persists. Several emerging market economies continue to face inflationary pressures alongside sluggish activity. Global commodity prices have eased and financial markets are buoyant, barring some volatility on geo-political tensions in early August and intermittent reactions to incoming data. V.1 Global Economic Conditions Global economic activity shed some of the weakness experienced in Q1 of 2014 – induced by harsh weather and inventory adjustment – and picked up modestly in Q2 on stronger consumer spending in the US and the UK. Growth in the advanced economies (AEs) is expected to firm up gradually through 2014 as financial conditions ease and monetary policy remains highly accommodative, but the recovery is vulnerable to downside risks from weak investment activity and possible escalation of geo-political tensions. Emerging Market Economies (EMEs) generally experienced deceleration of growth in Q2 – barring China on policy stimulus and India on improved business sentiment – and prospects for 2014 appear to be held back by structural constraints and subdued consumption and investment demand (Table V.1). World trade growth has tracked the fragile recovery, but the recent firming up appears hesitant, having slipped behind global GDP growth since Q4 of 2011 (Table V.1). The World Trade Organization (WTO) has lowered its world trade growth forecast for 2014 to 3.1 per cent in September from 4.7 per cent in April. This is attributed to global recovery not being broad-based and unsteady in the first half of 2014, trade slowdown in major EMEs as a result of weak global recovery itself, and escalation of geopolitical tensions. Both AEs and EMEs are susceptible to risks of reversal in sentiment and re-pricing of risk premiums in global financial markets, especially if US long-term interest rates rise faster than expected. V.2 Global Inflation Developments Inflation remains subdued in the AEs. In the US, annual inflation declined to 1.7 per cent in August with core inflation remaining unchanged. Inflation in Japan increased sharply on the back of the hike in the value added tax (VAT), but moderated to 3.4 per cent in July. Excluding the impact of VAT, headline inflation was much lower at 1.3 per cent in July, with core inflation at 0.6 per cent. Euro area inflation remained unchanged at 0.4 per cent in August, primarily on account of lower energy prices. In the UK, inflation remains below the Bank of England’s target of 2.0 per cent, declining to 1.5 per cent in August. In EMEs, the picture is mixed with China experiencing lower inflation due to weakening domestic demand, while Brazil, Russia and Turkey face upside pressures due to domestic food price pressures and exchange rate depreciation. Other EMEs such as Indonesia and India have undertaken policy-driven disinflation. Unlike in the AEs, several EMEs continue to face inflationary pressures and their persistence suggests structural characteristics, warranting a broader policy strategy rather than merely front-loading of monetary policy. World energy prices have begun to ease after remaining largely range bound during 2014, with Brent prices declining by 9.5 per cent between April and September to US $ 97.5 per barrel in September (Chart V.1). Notwithstanding risks of supply disruptions due to geo-political conflicts, global supply has held up on account of increased supplies from OPEC members and higher production in the US. Market participants expect oil prices to ease in the medium-term with Brent future contracts for December 2015 being traded at US $ 99.7 per barrel as on September 26, 2014. Non-energy prices have also been softening since May, plateauing in July and August 2014. Global food prices, which have been declining since March 2014, fell to a seven-month low in August. This was driven by reduction in grain prices since March following plentiful harvests in the US (Chart V.2). The Food and Agriculture Organisation (FAO) forecasts stable food prices for the next 10 years. Overall, commodity prices are expected to remain stable, perhaps indicating the end of the commodity super-cycle that started in the late 1990s (Box V.1). With well anchored inflation conditions and sizable slack, central banks in the AEs have persevered with highly accommodative monetary policies, with forward guidance indicating that the policy stance will remain supportive of the recovery. In September 2014, the Fed kept its policy rate unchanged, but announced a further reduction in its asset purchases by $10 billion to a total of $15 billion. The ECB further reduced its key policy rate to 0.05 per cent and raised the charge on deposits to -0.20 per cent in September in order to encourage bank lending, and would start purchasing asset-backed securities and covered bonds in October. The Bank of Japan and the Bank of England have also retained high accommodation in their monetary policy stances, the former keeping unchanged the monetary base target, and the latter maintaining the policy rate and size of the asset purchase programme (Chart V.3). Box V.1: Has the Commodity Super-cycle Ended? Commodity super-cycles are long and rapid rises in prices across commodities, propelled by persistent increases in demand outstripping supply. Since 1894, four super-cycles have been identified, with the last one starting from the late 1990s and attributed to rapid and sustained industrialisation and urbanisation in China and other emerging economies. In this latest commodity super-cycle, inflation adjusted prices of commodities rose in the range of 60 to 500 per cent between 1999 and its peak in 2010. Oil price rose by 467 per cent, metals by 202 per cent and agricultural prices by 77 per cent - the largest price increases among all the four commodity super-cycles. Another striking characteristic of the recent super-cycle relative to its predecessors is high correlation across commodity prices and high price volatility, possibly owing to financialisation of commodity markets and increase in supply disruptions due to natural disasters. The sustained moderation in commodity prices since 2012 - across the board - from their peak levels has generated some debate around the question of whether the latest commodity super-cycle has come to an end. Given the pace of innovation and physical investment, supply-side costs are still rising due to resource depletion, while EMEs are expected to grow without any drastic reversal of commodity demand. In fact, commodity prices have occasionally shown signs of reviving more quickly than global economic activity. On the other hand, the world economy may be entering a phase of stable but secularly lower levels of growth, keeping commodity prices stable but higher than the level that prevailed before the current super-cycle phase began. Asymmetric Christiano and Fitzgerald band pass filters commonly used to identify commodity super cycles show that both real energy prices and real non- energy prices have already reached inflexion points and are turning onto on a downward phase (Chart V.B1). In EMEs, monetary policy stances have been mixed, reflecting diverse domestic economic conditions as well as inflationary and exchange rate pressures. Turkey has started reducing its policy rate since May with improving global liquidity conditions and moderation of the impact of exchange rate fluctuations on inflation. Similarly, Chile has been slowly reducing its policy rate since February 2014 due to weakening domestic activity. By contrast, Russia has been on a tightening mode, raising its policy rate since March 2014 to contain inflationary pressures. Brazil has been maintaining a high policy rate for the past several months as inflationary pressures persist, despite entering into recession. South Africa and Malaysia have also raised policy rates in July to address inflationary pressures. China and Indonesia, on the other hand, have kept their policy rates steady for the past several months (Chart V.4). V.4 International Financial Markets International financial markets are experiencing a generalised ebbing of volatility since early 2014 as ‘taper’ fears subsided, and a widening of the search for returns triggered a resurgence of capital flows. Although volatility picked up in August 2014 on geo-political concerns across bond and equity markets, losses have been recovered by early September as risk appetite was whetted by announcements of further stimulus in the Euro area. The search for returns appears to have resumed strongly while volatility has fallen back to new lows. EME financial markets have been buoyed by the reach for yields and the uptick in volatility in August proved to be a temporary aberration, accompanied by some re-pricing of risk with country-specific accents. The sharp rise in asset prices has raised the risk of financial instability in the event of an unanticipated bursting of building equity/ real estate bubbles. The US dollar appreciated significantly against major currencies since July as conditions for recovery in the US economic activity became more favourable. In the EMEs, currency markets stabilised with normalisation of capital flows, barring sporadic responses to incoming data. Reduced currency volatility also increased the attractiveness for carry trade targeting EME currencies in general (Chart V.5). The eventual reversal of carry trade poses a major risk to macro-stability. In sum, global economic slack would persist even though recovery has modestly firmed in the advanced economies. Structural constraints and political tensions would mute growth in EMEs. As inflationary pressures appear benign, given the economic slack and stable commodity prices, AEs are likely to persist with their easy monetary policy stance. Among EMEs confronted with stubborn inflation experiences, the headroom for monetary policy action may increasingly become constrained by weaker than desirable economic activity. While financial markets and commodity prices would remain stable, an earlier than expected reversal in policy rate in the US could put pressures on these markets. ABBREVIATIONS
|
||||||||||||||||||||||||||||||||||||||||||||||||||||||||||||||||||||||||||||||||||||||||||||||||||||||||||||||||||||||||||||||||||||||||||||||||||||||||||||||||||||||||||||||||||||||||||||||||||||||||||||||||||||||||||||||||||||||||||||||||||||||||||||||||||||||||||||||||||||||||||||||||||||||||||||||||||||||||||||||||||||||||||||||||||||||||||||||||||||||||||||||||||||||||||||||||||||||||||||||||||||||||||||||||||||||||||||||||||||||||||||||||||||||||||||||||||||||||||||||||||||||||||||||||||||||||||||||||||||||||||||||||||||||||||||||||||||||||||||||||||||||||||||||||||||||||||||||||||||||||||||||||||||||||||||||||||||||||||||||||||||||||||||||||||||||||||||||||||||||||||||||||||||||||||||||||||||||||||

इस पेज को शेयर करें:


आरबीआई मोबाइल एप्लीकेशन इंस्टॉल करें और लेटेस्ट न्यूज़ का तुरंत एक्सेस पाएं!
हमारा ऐप इंस्टॉल करने के लिए QR कोड स्कैन करें


पृष्ठ अंतिम बार अपडेट किया गया:


