RbiSearchHeader

Press escape key to go back

पिछली खोज

थीम
थीम
टेक्स्ट का साइज़
टेक्स्ट का साइज़
S3

RbiAnnouncementWeb

RBI Announcements
RBI Announcements

असेट प्रकाशक

109259599

मुद्रास्फीति पर घरेलू अपेक्षाओं का सर्वेक्षण

मुद्रास्फीति पर घरेलू अपेक्षाओं का सर्वेक्षण


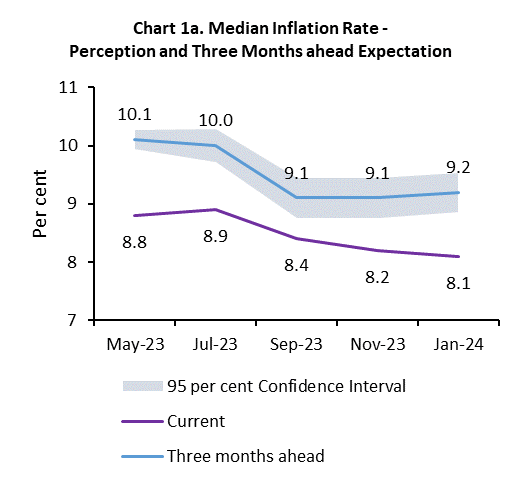
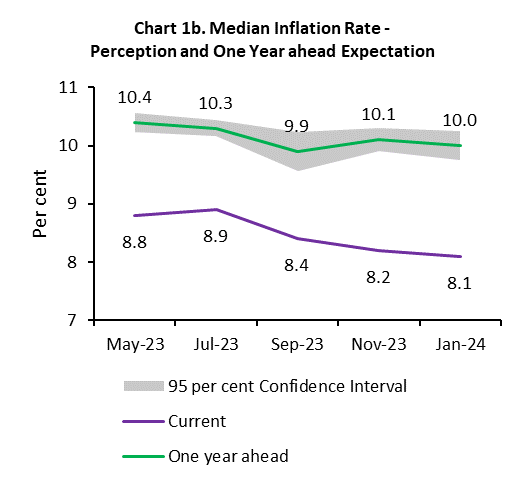
आज, रिज़र्व बैंक ने जनवरी 2024 के अपने द्विमासिक मुद्रास्फीति पर घरेलू अपेक्षाओं का सर्वेक्षण (आईईएसएच) 1 2 के परिणाम जारी किए हैं। यह सर्वेक्षण 2-11 जनवरी, 2024 के दौरान 19 प्रमुख शहरों में आयोजित किया गया था, जिसमें 6,062 शहरी परिवारों की प्रतिक्रियाएँ शामिल थी। इस दौर के सर्वेक्षण में महिला उत्तरदाताओं की हिस्सेदारी 52.3 प्रतिशत रही है।

मुख्य विशेषताएँ:   

  1. वर्तमान मुद्रास्‍फीति पर परिवारों की धारणा पिछले सर्वेक्षण दौर से 10 आधार अंक (बीपीएस) घट कर जनवरी 2024 में 8.1 प्रतिशत हो गई है [चार्ट 1(ए) और 1(बी); टेबल 3]।
  2. आगामी तीन महीने के लिए मीडियन मुद्रास्फीति की अपेक्षाएँ 10 आधार अंक (बीपीएस) बढ़ कर 9.2 प्रतिशत हो गई हैं; जबकि नवीनतम सर्वेक्षण दौर में एक वर्ष के लिए यह 10 आधार अंक (बीपीएस) घट कर 10.0 प्रतिशत हो गई है [चार्ट 1(ए) और 1(बी); टेबल 3]।
  3. उत्तरदाताओं का एक बड़ा समूह निकट भविष्य में मुद्रास्फीति में वृद्धि का पूर्वानुमान करता है, लेकिन एक वर्ष के क्षितिज में, उच्च मुद्रास्फीति की अपेक्षा करने वाले परिवारों की हिस्सेदारी पिछले सर्वेक्षण दौर की तुलना में कम हो गई है। [टेबल 1(ए) और 1(बी)]।
  4. अधिकांश सर्वेक्षण प्रतिभागियों को आने वाले तीन महीने के दौरान मूल्यों और मुद्रास्फीति के दबाव में, विशेष रूप से खाद्य उत्पाद श्रेणी के लिए, वृद्धि की अपेक्षा है [टेबल 1(ए)]।
  5. समग्र कीमतों पर परिवारों की अपेक्षाएँ आम तौर पर सेवाओं की लागत, खाद्य और गैर-खाद्य वस्तुओं की कीमतों पर उनकी अपेक्षाओं के साथ संरेखित हैं; एक वर्ष आगे के लिए, यह संरेखण विशेष कर खाद्य उत्पादों के संबंध में अधिक स्पष्ट है [टेबल 4]।

Chart 1a. Median Inflation Rate - Perception and Three Months ahead Expectation

Chart 1b. Median Inflation Rate - Perception and One Year ahead Expectation

   नोट:  कृपया समय क्षृंखला डेटा के लिए एक्सेल फ़ाइल देखें3 


Table 1(a): Product-wise Expectations of Prices for Three Months ahead

(Percentage of Respondents)

Survey period ended

Jan-23

Jul-23

Sep-23

Nov-23

Jan-24

General

Estimate

SE

Estimate

SE

Estimate

SE

Estimate

SE

Estimate

SE

Prices will increase

84.3

0.76

80.8

0.86

74.2

0.97

74.1

0.93

78.2

0.84

Price increase more than current rate

60.8

1.14

55.3

1.20

49.5

1.10

50.8

1.13

54.4

1.09

Price increase similar to current rate

20.2

0.86

21.8

0.93

20.0

0.80

19.1

0.85

19.5

0.80

Price increase less than current rate

3.4

0.36

3.6

0.39

4.7

0.47

4.2

0.42

4.2

0.43

No changes in prices

13.3

0.71

16.1

0.79

20.7

0.88

21.2

0.88

18.3

0.79

Decline in prices

2.3

0.30

3.1

0.41

5.0

0.52

4.7

0.45

3.6

0.37

Food Product


Prices will increase

84.6

0.72

84.0

0.77

75.4

0.87

75.5

0.90

80.2

0.77

Price increase more than current rate

61.1

1.08

63.5

1.04

55.1

1.05

53.7

1.04

59.3

1.00

Price increase similar to current rate

18.4

0.77

15.5

0.72

15.1

0.71

16.1

0.74

15.6

0.72

Price increase less than current rate

5.1

0.43

5.0

0.44

5.3

0.46

5.8

0.47

5.4

0.45

No changes in prices

10.2

0.59

9.0

0.60

13.2

0.68

15.5

0.76

12.3

0.65

Decline in prices

5.2

0.45

7.0

0.54

11.3

0.66

9.0

0.57

7.5

0.51

Non- Food Product


Prices will increase

81.8

0.77

75.5

0.92

69.2

0.93

73.8

0.87

74.0

0.85

Price increase more than current rate

56.4

1.08

52.2

1.16

47.1

1.04

52.4

1.04

52.3

1.03

Price increase similar to current rate

20.5

0.82

18.4

0.80

16.7

0.72

16.1

0.72

16.4

0.71

Price increase less than current rate

4.9

0.44

4.9

0.43

5.4

0.51

5.3

0.46

5.2

0.45

No changes in prices

13.4

0.67

18.3

0.80

20.5

0.77

19.5

0.77

18.6

0.76

Decline in prices

4.7

0.43

6.2

0.54

10.3

0.66

6.7

0.48

7.4

0.52

Household Durables


Prices will increase

72.4

0.90

65.8

0.97

62.2

0.99

63.8

0.98

65.5

0.93

Price increase more than current rate

50.3

1.07

45.3

1.12

43.2

1.05

45.5

1.02

46.3

1.04

Price increase similar to current rate

17.5

0.71

15.8

0.75

14.1

0.65

13.4

0.68

14.5

0.65

Price increase less than current rate

4.6

0.42

4.6

0.41

4.9

0.43

4.9

0.43

4.7

0.42

No changes in prices

21.2

0.84

25.0

0.88

26.4

0.88

25.9

0.89

25.2

0.85

Decline in prices

6.3

0.47

9.2

0.60

11.3

0.64

10.3

0.59

9.4

0.57

Cost of Housing


Prices will increase

78.0

0.86

76.8

0.94

75.1

0.95

76.8

0.88

78.4

0.83

Price increase more than current rate

58.4

1.08

56.0

1.14

54.3

1.09

57.2

1.09

58.2

1.05

Price increase similar to current rate

16.3

0.73

17.0

0.75

16.3

0.66

15.5

0.72

16.1

0.72

Price increase less than current rate

3.3

0.35

3.7

0.35

4.5

0.43

4.1

0.37

4.0

0.41

No changes in prices

18.9

0.84

20.2

0.88

20.9

0.90

20.0

0.83

18.1

0.79

Decline in prices

3.1

0.34

3.0

0.37

4.1

0.46

3.2

0.36

3.6

0.34

Cost of Services


Prices will increase

71.7

0.90

67.7

0.97

63.0

1.04

63.3

0.96

65.0

0.93

Price increase more than current rate

49.9

1.08

47.3

1.13

44.7

1.05

43.7

1.09

46.1

1.02

Price increase similar to current rate

17.6

0.71

15.9

0.72

14.5

0.68

15.5

0.70

15.0

0.69

Price increase less than current rate

4.1

0.40

4.5

0.40

3.9

0.40

4.2

0.40

3.8

0.37

No changes in prices

25.5

0.88

28.2

0.90

31.2

0.99

31.5

0.93

30.5

0.91

Decline in prices

2.7

0.30

4.1

0.43

5.7

0.54

5.1

0.48

4.5

0.41

Note:

1. The table provides estimates and standard errors for qualitative responses.

2. Constituent items may not add up to the corresponding total, due to rounding off.


Table 1(b): Product-wise Expectations of Prices for One Year ahead

(Percentage of Respondents)

Survey period ended

Jan-23

Jul-23

Sep-23

Nov-23

Jan-24

General

Estimate

SE

Estimate

SE

Estimate

SE

Estimate

SE

Estimate

SE

Prices will increase

91.6

0.53

88.6

0.68

86.2

0.74

89.0

0.65

88.7

0.63

Price increase more than current rate

70.8

1.02

65.0

1.07

62.2

1.05

67.2

1.07

66.3

1.06

Price increase similar to current rate

17.9

0.81

20.5

0.86

19.9

0.81

18.4

0.87

19.1

0.83

Price increase less than current rate

3.0

0.33

3.1

0.33

4.1

0.43

3.4

0.38

3.3

0.36

No changes in prices

5.7

0.43

8.6

0.57

9.6

0.59

8.4

0.56

8.2

0.55

Decline in prices

2.6

0.31

2.8

0.35

4.2

0.48

2.7

0.35

3.0

0.36

Food Product


Prices will increase

88.0

0.64

84.7

0.75

82.8

0.80

86.1

0.71

86.4

0.68

Price increase more than current rate

62.7

1.07

60.6

1.11

57.9

1.09

63.2

1.06

63.6

1.03

Price increase similar to current rate

20.7

0.87

20.1

0.85

19.7

0.82

18.4

0.83

18.2

0.77

Price increase less than current rate

4.5

0.42

4.0

0.38

5.3

0.48

4.5

0.41

4.7

0.43

No changes in prices

7.6

0.50

9.3

0.59

9.6

0.58

8.8

0.56

8.7

0.53

Decline in prices

4.4

0.39

6.0

0.48

7.6

0.60

5.1

0.44

4.9

0.43

Non- Food Product


Prices will increase

86.7

0.67

81.6

0.85

78.9

0.83

82.6

0.78

82.0

0.80

Price increase more than current rate

62.0

1.09

57.1

1.16

54.7

1.05

60.7

1.09

59.1

1.11

Price increase similar to current rate

20.5

0.83

20.6

0.83

19.7

0.78

17.4

0.80

18.6

0.79

Price increase less than current rate

4.3

0.41

3.9

0.38

4.5

0.44

4.5

0.42

4.4

0.41

No changes in prices

9.1

0.54

13.5

0.72

13.9

0.66

12.9

0.65

13.1

0.66

Decline in prices

4.1

0.39

4.8

0.48

7.2

0.57

4.5

0.43

4.8

0.45

Household Durables


Prices will increase

80.8

0.77

75.8

0.88

73.9

0.91

75.5

0.89

74.8

0.84

Price increase more than current rate

57.2

1.08

53.2

1.10

52.4

1.04

55.3

1.07

54.0

1.06

Price increase similar to current rate

19.3

0.79

18.4

0.80

17.3

0.71

16.3

0.77

16.7

0.69

Price increase less than current rate

4.3

0.41

4.2

0.38

4.1

0.42

3.9

0.39

4.1

0.41

No changes in prices

13.8

0.65

17.7

0.76

18.5

0.76

17.7

0.76

18.3

0.75

Decline in prices

5.4

0.43

6.5

0.48

7.7

0.56

6.8

0.50

6.9

0.49

Cost of Housing


Prices will increase

87.4

0.63

86.8

0.69

86.1

0.70

87.9

0.68

88.0

0.65

Price increase more than current rate

66.8

0.98

64.6

1.05

65.0

1.04

68.5

1.02

67.7

0.96

Price increase similar to current rate

17.2

0.77

18.5

0.79

16.9

0.73

16.3

0.78

16.7

0.74

Price increase less than current rate

3.5

0.36

3.8

0.37

4.2

0.42

3.1

0.36

3.6

0.40

No changes in prices

9.8

0.57

10.4

0.60

10.1

0.56

9.4

0.61

9.1

0.55

Decline in prices

2.8

0.30

2.7

0.34

3.8

0.43

2.7

0.34

2.9

0.34

Cost of Services


Prices will increase

84.0

0.72

80.9

0.80

78.4

0.86

80.8

0.81

79.5

0.78

Price increase more than current rate

60.2

1.08

57.3

1.12

56.2

1.05

59.2

1.08

58.8

1.03

Price increase similar to current rate

19.7

0.80

19.6

0.83

18.0

0.70

17.6

0.80

16.6

0.72

Price increase less than current rate

4.2

0.41

4.0

0.39

4.2

0.43

4.0

0.40

4.1

0.40

No changes in prices

13.1

0.65

15.5

0.72

17.1

0.74

16.3

0.74

17.0

0.72

Decline in prices

2.8

0.33

3.5

0.37

4.4

0.48

2.9

0.36

3.5

0.37

Note:

1. The table provides estimates and standard errors for qualitative responses.

2. Constituent items may not add up to the corresponding total, due to rounding off.


Table 2: Inflation Expectations of Various Groups: Jan-24


Current Perception

Three Months ahead Expectation

One Year ahead Expectation

Mean

Median

Mean

Median

Mean

Median

Estimate

SE

Estimate

SE

Estimate

SE

Estimate

SE

Estimate

SE

Estimate

SE

Overall

8.8

0.09

8.1

0.12

9.7

0.09

9.2

0.17

9.6

0.10

10.0

0.13

Gender-wise


Male

8.9

0.13

8.3

0.18

9.8

0.13

9.4

0.27

9.7

0.15

10.0

0.18

Female

8.6

0.12

8.0

0.16

9.6

0.13

9.1

0.21

9.5

0.14

9.9

0.20

Category-wise


Financial Sector Employees

8.0

0.44

7.3

0.54

8.6

0.43

7.9

0.72

9.4

0.71

9.2

0.75

Other Employees

8.9

0.18

8.3

0.23

9.7

0.19

9.3

0.34

9.5

0.23

10.0

0.22

Self Employed

9.2

0.19

8.7

0.31

9.9

0.20

9.8

0.33

9.5

0.24

9.9

0.34

Homemaker

8.6

0.14

8.1

0.17

9.7

0.14

9.2

0.23

9.6

0.17

10.0

0.18

Retired Persons

9.0

0.33

8.0

0.33

10.0

0.35

9.3

0.50

10.3

0.38

10.3

0.36

Daily Workers

8.9

0.23

8.4

0.37

9.7

0.26

9.3

0.47

9.3

0.31

9.7

0.51

Other category

8.1

0.21

7.5

0.22

8.9

0.22

8.2

0.27

9.1

0.26

9.0

0.34

Age Group-wise


Up to 25 years

7.9

0.17

7.3

0.19

8.8

0.18

8.2

0.21

9.1

0.21

9.0

0.22

25 to 30 years

8.6

0.18

8.0

0.23

9.4

0.18

8.9

0.27

9.6

0.22

9.6

0.35

30 to 35 years

8.9

0.19

8.3

0.21

9.8

0.20

9.5

0.34

9.9

0.24

10.2

0.15

35 to 40 years

9.0

0.19

8.4

0.23

9.8

0.20

9.3

0.30

9.6

0.25

10.1

0.22

40 to 45 years

9.0

0.23

8.5

0.36

9.9

0.24

9.7

0.37

9.7

0.29

10.2

0.18

45 to 50 years

9.1

0.22

8.6

0.30

10.0

0.24

9.6

0.46

9.6

0.30

10.0

0.34

50 to 55 years

8.7

0.29

8.0

0.31

9.7

0.31

9.4

0.66

9.5

0.36

9.9

0.52

55 to 60 years

8.8

0.30

8.1

0.55

9.8

0.30

9.7

0.43

9.3

0.35

9.7

0.63

60 years and above

8.9

0.29

8.2

0.35

9.7

0.29

9.5

0.49

9.6

0.34

10.0

0.43

City-wise


Ahmedabad

7.6

0.32

7.1

0.29

8.5

0.37

8.0

0.26

7.8

0.45

7.8

0.26

Bengaluru

7.7

0.21

6.0

0.31

8.7

0.20

7.5

0.43

9.5

0.25

9.3

0.62

Bhopal

7.9

0.45

6.8

0.83

8.6

0.50

7.7

0.93

7.9

0.58

7.8

0.99

Bhubaneswar

8.9

0.70

9.4

0.31

10.7

0.71

11.0

1.03

11.0

0.85

12.3

1.58

Chennai

9.2

0.32

9.6

0.60

10.4

0.39

10.4

0.40

11.6

0.42

12.3

1.27

Delhi

9.4

0.23

9.3

0.55

10.1

0.24

10.2

0.21

10.1

0.25

10.3

0.19

Guwahati

8.0

0.69

7.5

0.78

8.6

0.65

8.2

0.80

9.2

0.57

9.1

0.60

Hyderabad

7.5

0.24

6.9

0.30

8.5

0.27

7.9

0.23

8.2

0.34

8.8

0.48

Jaipur

8.2

0.66

7.9

0.70

8.7

0.57

8.3

0.51

7.6

0.68

7.6

0.84

Jammu

9.9

0.81

9.1

1.57

9.6

0.70

8.8

1.23

8.6

0.92

8.0

1.49

Kolkata

10.1

0.32

9.9

0.58

11.0

0.31

10.6

0.45

11.1

0.30

11.1

0.60

Lucknow

9.1

0.42

8.4

0.68

9.9

0.47

9.4

0.81

10.0

0.49

9.9

0.69

Mumbai

8.8

0.21

8.2

0.17

9.9

0.20

9.5

0.33

9.0

0.27

9.8

0.40

Nagpur

9.7

0.42

9.2

0.49

10.9

0.46

10.4

0.36

10.3

0.66

10.9

0.62

Patna

7.8

0.50

7.7

0.67

8.2

0.50

8.0

0.64

8.3

0.51

8.2

0.60

Thiruvananthapuram

7.5

0.75

7.0

0.93

8.8

0.73

8.3

0.81

10.3

0.94

10.3

0.89

Chandigarh

10.1

0.56

10.2

0.49

9.9

0.71

9.9

0.95

9.9

0.68

10.3

0.79

Ranchi

9.2

0.34

8.7

0.30

9.6

0.37

9.3

0.35

9.5

0.45

9.7

0.43

Raipur

9.9

0.61

9.7

0.80

10.6

0.57

10.5

0.52

10.8

0.64

11.3

0.82

Note: The table provides estimates and standard errors for quantitative responses.


Table 3: Household Inflation Expectations – Current Perception, Three Months and One Year Ahead Expectations


Current Perception

Three Months ahead Expectation

One Year ahead Expectation

Mean

Median

Mean

Median

Mean

Median

Estimate

SE

Estimate

SE

Estimate

SE

Estimate

SE

Estimate

SE

Estimate

SE

Jan-23

9.7

0.09

9.6

0.30

10.8

0.10

10.5

0.08

10.8

0.11

10.8

0.09

Jul-23

9.3

0.09

8.9

0.14

10.2

0.09

10.0

0.15

10.0

0.11

10.3

0.07

Sep-23

9.0

0.09

8.4

0.11

9.7

0.09

9.1

0.17

9.3

0.11

9.9

0.17

Nov-23

8.9

0.09

8.2

0.12

9.7

0.09

9.1

0.18

9.6

0.10

10.1

0.10

Jan-24

8.8

0.09

8.1

0.12

9.7

0.09

9.2

0.17

9.6

0.10

10.0

0.13

Note: The table provides estimates and standard errors for quantitative responses.


Table 4: Households Expecting General Price Movements in Coherence with Movements in Price Expectations of Various Product Groups: Three Months Ahead and One Year Ahead

(Percentage of Respondents)

Survey period ended

Food

Non-Food

Households durables

Housing

Cost of services

Three Months Ahead

Jan-23

65.6

67.3

62.6

66.2

66.5

Jul-23

63.1

65.5

60.9

64.5

65.7

Sep-23

62.0

64.3

60.7

63.2

66.3

Nov-23

66.5

61.8

57.0

60.7

66.4

Jan-24

65.2

65.4

60.8

64.2

65.8

One Year Ahead

Jan-23

75.2

74.8

68.4

74.7

74.0

Jul-23

73.4

73.0

66.9

73.4

73.6

Sep-23

69.8

71.2

66.8

72.2

71.5

Nov-23

74.8

73.9

68.1

75.3

73.9

Jan-24

76.5

74.1

67.9

74.9

74.6

Note: Figures are based on sample observations


  1. यह सर्वेक्षण भारतीय रिज़र्व बैंक के द्वारा द्विमाही अंतरालों पर संचालित किया जाता है; यह निकट भविष्य में मुद्रास्फीतिकारी दबावों पर उत्तरदाताओं से प्राप्त निदेशात्मक जानकारी प्रदान करता है और उनकी स्वयं की खपत प्रवृत्ति को प्रतिबिंबित करता है। सर्वेक्षण के परिणाम उत्तरदाताओं के विचारों को दर्शाते हैं, जो जरूरी नहीं कि रिज़र्व बैंक द्वारा मान्यता प्राप्त हों।
  2. मुद्रास्फीति प्रत्याशाओं के सभी अनुमान मीडियन के रूप में दिए गए हैं, जब तक अन्यथा न कहा गया हो।  
  3. पिछले सर्वेक्षण चक्र के परिणाम बैंक की वेबसाइट पर दिसंबर 08, 2023 को जारी किए गए थे। सर्वेक्षण के पिछले चक्रों के लिए यूनिट-स्तर के डेटा, बैंक के भारतीय अर्थव्यवस्था पर डेटाबेस (DBIE) पोर्टल (वेबलिंक : https://dbie.rbi.org.in/#/dbie/home) पर 'यूनिट-स्तर डेटा' शीर्षक के अंतर्गत उपलब्ध हैं |

RbiTtsCommonUtility

प्ले हो रहा है
सुनें

संबंधित एसेट

आरबीआई-इंस्टॉल-आरबीआई-सामग्री-वैश्विक

RbiSocialMediaUtility

आरबीआई मोबाइल एप्लीकेशन इंस्टॉल करें और लेटेस्ट न्यूज़ का तुरंत एक्सेस पाएं!

Scan Your QR code to Install our app

RbiWasItHelpfulUtility

क्या यह पेज उपयोगी था?