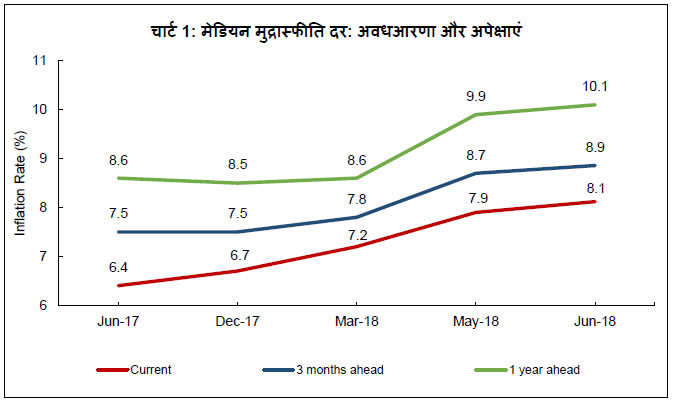
आज, रिजर्व बैंक ने जून 2018 चक्र की मुद्रास्फीति पर घरेलू अपेक्षाओं के सर्वेक्षण (IESH)1 के परिणाम जारी किए। सर्वेक्षण 18 शहरों में आयोजित किया गया था और इसके परिणाम विभिन्न व्यावसायिक श्रेणियों (तालिका 1) को कवर करते हुए 5,189 शहरी परिवारों के प्रत्युत्तरों पर आधारित है। विशेष: i. ऐसे उत्तरदाताओं का अनुपात जो आगे के तीन महीनों में कीमतों में वृद्धि वर्तमान दर से अधिक रहने की अपेक्षा करते थे, मई 2018 के चक्र की भांति बना रहा। तथापि आगे के एक साल के लिए इस अनुपात में मामूली गिरावट आई है (तालिका 2)। ii. जहां तक उत्पाद समूहों संबंध है, आगामी तीन महीनों में और आगामी एक वर्ष में घरेलू टिकाऊ वस्तुओं की कीमतों में होनेवाली वृद्धि को वर्तमान दर के मुकाबले अधिक तेज़ी से होने की अपेक्षा करनेवाले उत्तरदाताओं के अनुपात में उल्लेखनीय गिरावट देखी गई। iii. मई 2018 चक्र की तुलना में आगे के तीन महीनों और आगे के एक वर्ष की मेडियन मुद्रास्फीति की अपेक्षाओं, प्रत्येक में, 20 आधार अंकों (बीपीएस) अंक की वृद्धि दर्ज़ हुई (चार्ट 1, तालिका 4) । iv. जून 2017 चक्र की तुलना में तीन महीने आगे और एक वर्ष आगे की मेडियन मुद्रास्फीति अपेक्षाओं में क्रमशः 140 और 150 बीपीएस की वृद्धि हुई। नोट : कृपया टाइम सिरीज़ डेटा के लिए एक्सेल फ़ाइल देखें। | Table 1: Respondents’ Profile (Category): Share in Total Sample - Jun 2018 | | Category of Respondents | Share in Total (%) | Target Share (%) | | Financial Sector Employees | 9.9 | 10.0 | | Other Employees | 15.6 | 15.0 | | Self-employed | 20.3 | 20.0 | | Homemakers | 29.2 | 30.0 | | Retired Persons | 9.5 | 10.0 | | Daily Workers | 9.8 | 10.0 | | Others | 5.7 | 5.0 |
| Table 2: Product-wise Expectations of Prices for Three Months ahead and One Year ahead | | (Percentage of Respondents) | | Round | Jun-17 | Dec-17 | Mar-18 | May-18 | Jun-18 | Jun-17 | Dec-17 | Mar-18 | May-18 | Jun-18 | | Options: General | Three Months Ahead | One Year Ahead | | Prices will increase | 77.2 | 80.6 | 80.2 | 82.3 | 83.8 | 82.4 | 92.7 | 90.8 | 91.1 | 91.6 | | Price increase more than current rate | 39.9 | 49.8 | 45.4 | 50.5 | 50.1 | 44.1 | 63.0 | 56.7 | 62.6 | 59.8 | | Price increase similar to current rate | 26.6 | 24.6 | 27.2 | 25.1 | 26.4 | 28.3 | 23.9 | 28.0 | 23.4 | 25.8 | | Price increase less than current rate | 10.7 | 6.2 | 7.5 | 6.7 | 7.3 | 10.1 | 5.8 | 6.2 | 5.0 | 6.0 | | No change in prices | 16.8 | 17.4 | 17.8 | 16.0 | 14.6 | 11.2 | 5.3 | 7.1 | 6.5 | 6.5 | | Decline in prices | 6.0 | 2.0 | 2.1 | 1.7 | 1.6 | 6.4 | 2.0 | 2.2 | 2.4 | 1.9 | | Options: Food Product | Three Months Ahead | One Year Ahead | | Prices will increase | 71.6 | 78.1 | 79.6 | 82.0 | 81.4 | 75.8 | 85.0 | 85.0 | 85.6 | 85.1 | | Price increase more than current rate | 39.1 | 45.8 | 44.0 | 48.3 | 47.8 | 38.0 | 52.1 | 47.4 | 53.4 | 51.4 | | Price increase similar to current rate | 21.8 | 23.4 | 24.9 | 24.5 | 24.8 | 26.8 | 24.9 | 28.9 | 25.2 | 26.5 | | Price increase less than current rate | 10.7 | 8.9 | 10.7 | 9.3 | 8.7 | 11.0 | 8.1 | 8.7 | 7.0 | 7.1 | | No change in prices | 14.2 | 15.5 | 15.4 | 13.5 | 13.3 | 12.4 | 10.4 | 10.2 | 9.4 | 9.7 | | Decline in prices | 14.3 | 6.4 | 5.0 | 4.5 | 5.3 | 11.8 | 4.6 | 4.8 | 5.0 | 5.3 | | Options: Non-Food Product | Three Months Ahead | One Year Ahead | | Prices will increase | 72.1 | 73.3 | 75.0 | 78.4 | 78.2 | 74.8 | 80.5 | 80.0 | 82.7 | 83.3 | | Price increase more than current rate | 36.9 | 41.2 | 39.6 | 45.8 | 44.5 | 36.3 | 48.8 | 44.2 | 51.1 | 49.1 | | Price increase similar to current rate | 23.6 | 23.3 | 25.4 | 24.0 | 24.4 | 27.3 | 23.7 | 26.8 | 25.3 | 26.6 | | Price increase less than current rate | 11.6 | 8.8 | 10.0 | 8.6 | 9.3 | 11.2 | 7.9 | 9.0 | 6.3 | 7.6 | | No change in prices | 18.1 | 21.9 | 20.8 | 18.1 | 17.7 | 16.3 | 15.4 | 15.8 | 13.2 | 12.7 | | Decline in prices | 9.8 | 4.8 | 4.2 | 3.6 | 4.1 | 9.0 | 4.2 | 4.3 | 4.1 | 4.0 | | Options: Household Durables | Three Months Ahead | One Year Ahead | | Prices will increase | 65.4 | 60.0 | 63.7 | 63.2 | 58.7 | 70.3 | 68.8 | 71.1 | 72.5 | 70.6 | | Price increase more than current rate | 34.7 | 35.0 | 34.7 | 36.7 | 32.6 | 35.7 | 42.3 | 40.1 | 45.2 | 41.6 | | Price increase similar to current rate | 20.6 | 18.6 | 20.7 | 19.9 | 19.1 | 24.3 | 19.8 | 23.4 | 21.5 | 21.8 | | Price increase less than current rate | 10.1 | 6.4 | 8.3 | 6.6 | 7.1 | 10.3 | 6.7 | 7.7 | 5.8 | 7.2 | | No change in prices | 20.6 | 28.8 | 26.2 | 26.8 | 30.9 | 17.5 | 21.7 | 19.9 | 19.2 | 21.2 | | Decline in prices | 14.0 | 11.3 | 10.1 | 10.0 | 10.4 | 12.2 | 9.5 | 9.0 | 8.3 | 8.2 | | Options: Housing Prices | Three Months Ahead | One Year Ahead | | Prices will increase | 64.3 | 69.5 | 70.0 | 71.6 | 71.6 | 73.4 | 78.4 | 80.2 | 79.8 | 81.0 | | Price increase more than current rate | 37.1 | 45.9 | 43.9 | 47.6 | 45.3 | 42.2 | 53.3 | 50.9 | 55.2 | 53.0 | | Price increase similar to current rate | 18.6 | 18.0 | 18.8 | 18.2 | 19.9 | 22.4 | 19.2 | 22.5 | 19.6 | 21.5 | | Price increase less than current rate | 8.7 | 5.6 | 7.3 | 5.8 | 6.4 | 8.8 | 5.9 | 6.8 | 5.0 | 6.5 | | No change in prices | 22.0 | 21.0 | 22.4 | 20.8 | 20.7 | 15.1 | 14.0 | 13.9 | 13.9 | 13.3 | | Decline in prices | 13.6 | 9.5 | 7.7 | 7.7 | 7.7 | 11.5 | 7.7 | 5.9 | 6.3 | 5.7 | | Options: Cost of Services | Three Months Ahead | One Year Ahead | | Prices will increase | 68.9 | 71.5 | 70.2 | 72.0 | 70.8 | 78.6 | 82.8 | 82.6 | 84.2 | 84.1 | | Price increase more than current rate | 35.1 | 41.4 | 38.3 | 42.9 | 40.8 | 38.8 | 50.5 | 45.3 | 52.9 | 49.5 | | Price increase similar to current rate | 23.7 | 23.2 | 23.5 | 22.6 | 22.8 | 27.8 | 24.3 | 28.6 | 24.4 | 26.6 | | Price increase less than current rate | 10.2 | 6.8 | 8.3 | 6.6 | 7.3 | 12.0 | 8.0 | 8.7 | 6.9 | 8.0 | | No change in prices | 25.3 | 25.6 | 26.6 | 25.6 | 26.5 | 15.6 | 14.2 | 14.9 | 13.5 | 13.7 | | Decline in prices | 5.8 | 3.0 | 3.3 | 2.4 | 2.6 | 5.9 | 3.0 | 2.5 | 2.4 | 2.2 | | Note: Constituent items may not add up to totals, due to rounding off. |
| Table 3: Households Expecting General Price Movements in Coherence with Movements in Price Expectations of Various Product Groups: Three Months Ahead and One Year Ahead | | (Percentage of Respondents) | | Survey period ended | Food | Non-Food | Households durables | Housing | Cost of services | | Three Months Ahead | | Jun-17 | 62.0 | 64.3 | 57.2 | 57.6 | 63.4 | | Dec-17 | 64.9 | 64.1 | 55.5 | 58.4 | 63.8 | | Mar-18 | 63.7 | 63.2 | 55.6 | 57.8 | 62.7 | | May-18 | 67.5 | 65.6 | 56.6 | 60.0 | 65.0 | | Jun-18 | 65.6 | 64.7 | 53.8 | 60.0 | 63.7 | | One Year Ahead | | Jun-17 | 68.2 | 67.7 | 62.0 | 63.2 | 70.0 | | Dec-17 | 70.1 | 69.0 | 58.8 | 65.1 | 70.5 | | Mar-18 | 69.0 | 66.3 | 59.6 | 64.3 | 69.2 | | May-18 | 72.4 | 70.8 | 62.5 | 67.4 | 72.1 | | Jun-18 | 71.9 | 71.4 | 60.9 | 67.4 | 71.9 |
| Table 4: Household Inflation Expectations – Current, Three Months and One Year Ahead | | Survey Period Ended | Inflation rate in Per cent | | Current | Three Months Ahead | One Year Ahead | | Mean | Median | Std. Dev. | Mean | Median | Std. Dev. | Mean | Median | Std. Dev. | | Jun-17 | 7.3 | 6.4 | 3.8 | 8.1 | 7.5 | 3.9 | 9.1 | 8.6 | 4.1 | | Dec-17 | 7.9 | 6.7 | 4.2 | 8.4 | 7.5 | 4.3 | 8.9 | 8.5 | 4.8 | | Mar-18 | 8.2 | 7.2 | 4.0 | 8.6 | 7.8 | 4.1 | 8.9 | 8.6 | 4.7 | | May-18 | 8.7 | 7.9 | 4.3 | 9.4 | 8.7 | 4.4 | 9.7 | 9.9 | 5.1 | | Jun-18 | 8.9 | 8.1 | 4.4 | 9.5 | 8.9 | 4.4 | 9.8 | 10.1 | 5.0 |
| Table 5: Factors that Explain the Total Variability | | Survey Period Ended | Current | Three Months Ahead | One Year Ahead | | Jun-17 | City, Age-Group, Category | City, Age-Group, Category | City, Age-Group, Category | | Dec-17 | City, Category, Age-Group, Gender | City, Category, Age-Group | City, Category | | Mar-18 | City, Age-Group, Gender | City, Category, Age-Group, Gender | City, Category | | May-18 | City, Category, Age-Group | City, Category | City, Gender, Category | | Jun-18 | City, Age-Group, Category | City, Age-Group, Category | City, Age-Group, Category |
| Table 6 : Various Group-wise Inflation Expectations: June 2018 | | | Current | Three Months Ahead | One Year Ahead | | Mean | Median | Std. Dev. | Mean | Median | Std. Dev. | Mean | Median | Std. Dev. | | Overall | 8.9 | 8.1 | 4.4 | 9.5 | 8.9 | 4.4 | 9.8 | 10.1 | 5.0 | | Gender-wise | | Male | 9.0 | 8.2 | 4.4 | 9.5 | 8.9 | 4.5 | 9.8 | 10.0 | 5.1 | | Female | 8.8 | 8.0 | 4.3 | 9.5 | 8.8 | 4.3 | 9.9 | 10.2 | 4.9 | | Category-wise | | Financial Sector Employees | 8.5 | 7.6 | 4.2 | 9.2 | 8.5 | 4.3 | 9.4 | 9.1 | 4.8 | | Other Employees | 9.0 | 8.1 | 4.4 | 9.5 | 8.7 | 4.5 | 9.8 | 10.1 | 5.0 | | Self Employed | 8.9 | 8.1 | 4.5 | 9.5 | 8.9 | 4.5 | 9.7 | 10.0 | 5.2 | | Homemakers | 9.0 | 8.2 | 4.3 | 9.6 | 8.9 | 4.4 | 10.0 | 10.2 | 4.9 | | Retired Persons | 9.2 | 8.5 | 4.4 | 9.9 | 9.4 | 4.6 | 10.2 | 10.3 | 5.0 | | Daily Workers | 9.2 | 8.7 | 4.4 | 9.8 | 9.5 | 4.4 | 10.1 | 10.3 | 5.0 | | Other category | 8.2 | 7.3 | 4.0 | 8.7 | 7.9 | 4.2 | 9.4 | 9.2 | 4.6 | | Age Group-wise | | Up to 25 years | 8.0 | 7.1 | 3.9 | 8.7 | 7.9 | 4.1 | 9.2 | 8.9 | 4.7 | | 25 to 30 years | 8.6 | 7.7 | 4.2 | 9.2 | 8.4 | 4.3 | 9.6 | 9.7 | 4.9 | | 30 to 35 years | 8.9 | 8.2 | 4.3 | 9.5 | 8.8 | 4.3 | 9.8 | 10.2 | 4.9 | | 35 to 40 years | 9.1 | 8.2 | 4.4 | 9.7 | 9.1 | 4.5 | 9.9 | 10.1 | 5.0 | | 40 to 45 years | 8.9 | 8.3 | 4.4 | 9.4 | 9.0 | 4.6 | 9.5 | 10.0 | 5.1 | | 45 to 50 years | 9.6 | 9.0 | 4.6 | 10.1 | 10.1 | 4.6 | 10.2 | 10.5 | 5.2 | | 50 to 55 years | 9.7 | 9.8 | 4.4 | 10.1 | 10.1 | 4.4 | 10.5 | 10.5 | 4.8 | | 55 to 60 years | 9.4 | 8.9 | 4.7 | 10.1 | 9.8 | 4.7 | 10.6 | 10.6 | 4.9 | | 60 years and above | 9.4 | 8.7 | 4.5 | 10.1 | 9.7 | 4.7 | 10.5 | 10.4 | 5.1 | | City-wise | | Ahmedabad | 10.3 | 10.1 | 4.2 | 11.3 | 10.7 | 4.2 | 11.3 | 10.8 | 4.4 | | Bengaluru | 5.6 | 5.2 | 2.9 | 6.2 | 5.9 | 2.9 | 6.8 | 6.9 | 3.6 | | Bhopal | 6.7 | 5.8 | 3.6 | 7.4 | 6.6 | 3.8 | 6.8 | 6.8 | 4.6 | | Bhubaneswar | 8.3 | 7.3 | 3.6 | 9.8 | 8.9 | 3.4 | 11.7 | 10.8 | 3.2 | | Chennai | 8.6 | 8.3 | 3.8 | 9.2 | 9.0 | 3.9 | 10.6 | 10.7 | 4.4 | | Delhi | 8.8 | 8.4 | 4.1 | 9.3 | 8.9 | 4.3 | 9.8 | 9.5 | 4.6 | | Guwahati | 10.4 | 10.5 | 5.3 | 9.9 | 10.1 | 5.3 | 9.2 | 9.0 | 5.8 | | Hyderabad | 9.8 | 8.3 | 4.8 | 10.8 | 10.1 | 4.6 | 12.1 | 12.5 | 4.4 | | Jaipur | 7.9 | 8.2 | 3.0 | 8.4 | 8.7 | 3.1 | 9.0 | 9.7 | 4.0 | | Kolkata | 10.5 | 10.3 | 4.6 | 11.1 | 10.7 | 4.6 | 11.4 | 11.0 | 4.8 | | Lucknow | 9.1 | 8.5 | 4.5 | 10.0 | 9.7 | 4.6 | 10.2 | 10.3 | 5.2 | | Mumbai | 11.4 | 10.8 | 4.7 | 11.8 | 12.2 | 4.6 | 11.6 | 12.5 | 5.3 | | Nagpur | 7.7 | 6.7 | 4.1 | 8.8 | 8.3 | 4.1 | 9.2 | 10.0 | 4.7 | | Patna | 7.9 | 7.2 | 3.3 | 8.2 | 7.8 | 3.6 | 8.5 | 8.5 | 4.1 | | Thiruvananthapuram | 9.0 | 7.6 | 4.7 | 10.1 | 9.6 | 4.9 | 10.6 | 10.5 | 5.4 | | Chandigarh | 9.7 | 9.2 | 4.2 | 8.6 | 8.5 | 4.6 | 9.2 | 8.7 | 4.7 | | Ranchi | 7.9 | 7.4 | 3.3 | 8.8 | 8.2 | 3.8 | 8.6 | 8.6 | 4.9 | | Raipur | 7.2 | 5.9 | 3.4 | 7.6 | 6.2 | 3.7 | 6.0 | 5.4 | 5.2 |
| Table 7: Cross-tabulation of Current and Three Months Ahead Inflation Expectations: June 2018 | | (Number of Respondents) | | Three Months Ahead Inflation Rate (per cent) | | Current Inflation Rate (per cent) | | <1 | 1-<2 | 2-<3 | 3-<4 | 4-<5 | 5-<6 | 6-<7 | 7-<8 | 8-<9 | 9-<10 | 10-<11 | 11-<12 | 12-<13 | 13-<14 | 14-<15 | 15-<16 | >=16 | No idea | Total | | <1 | 22 | 4 | 4 | 2 | 0 | 5 | 0 | 0 | 0 | 0 | 2 | 0 | 1 | 0 | 1 | 0 | 3 | 0 | 44 | | 1-<2 | 2 | 28 | 7 | 3 | 0 | 1 | 0 | 0 | 0 | 0 | 0 | 0 | 0 | 0 | 0 | 0 | 0 | 0 | 41 | | 2-<3 | 6 | 14 | 103 | 46 | 18 | 8 | 2 | 0 | 0 | 0 | 0 | 0 | 0 | 0 | 0 | 0 | 0 | 1 | 198 | | 3-<4 | 3 | 6 | 12 | 79 | 68 | 32 | 6 | 1 | 1 | 0 | 0 | 0 | 0 | 0 | 0 | 1 | 0 | 0 | 209 | | 4-<5 | 7 | 1 | 7 | 23 | 127 | 87 | 52 | 10 | 8 | 1 | 1 | 0 | 1 | 0 | 0 | 0 | 0 | 1 | 326 | | 5-<6 | 7 | 1 | 11 | 20 | 24 | 421 | 158 | 199 | 77 | 6 | 38 | 0 | 1 | 0 | 0 | 1 | 0 | 1 | 965 | | 6-<7 | 4 | 0 | 1 | 3 | 10 | 5 | 148 | 78 | 62 | 15 | 12 | 1 | 3 | 0 | 0 | 1 | 0 | 0 | 343 | | 7-<8 | 3 | 1 | 0 | 1 | 0 | 16 | 2 | 188 | 93 | 62 | 45 | 2 | 3 | 1 | 2 | 1 | 0 | 0 | 420 | | 8-<9 | 2 | 0 | 1 | 1 | 2 | 3 | 8 | 9 | 161 | 88 | 99 | 9 | 15 | 3 | 3 | 2 | 1 | 0 | 407 | | 9-<10 | 3 | 0 | 0 | 1 | 0 | 4 | 3 | 2 | 3 | 112 | 58 | 23 | 12 | 4 | 3 | 2 | 2 | 1 | 233 | | 10-<11 | 4 | 0 | 2 | 7 | 3 | 23 | 3 | 14 | 16 | 2 | 363 | 64 | 156 | 29 | 8 | 100 | 34 | 2 | 830 | | 11-<12 | 0 | 0 | 0 | 0 | 0 | 1 | 0 | 0 | 2 | 1 | 0 | 34 | 12 | 9 | 4 | 8 | 2 | 0 | 73 | | 12-<13 | 0 | 0 | 0 | 1 | 0 | 1 | 0 | 2 | 0 | 0 | 4 | 0 | 34 | 5 | 12 | 15 | 2 | 0 | 76 | | 13-<14 | 0 | 0 | 0 | 0 | 0 | 0 | 0 | 0 | 0 | 0 | 0 | 0 | 0 | 13 | 4 | 6 | 2 | 0 | 25 | | 14-<15 | 0 | 0 | 0 | 0 | 1 | 0 | 1 | 1 | 0 | 0 | 0 | 0 | 0 | 0 | 16 | 9 | 12 | 0 | 40 | | 15-<16 | 1 | 0 | 0 | 3 | 0 | 3 | 0 | 1 | 1 | 1 | 7 | 0 | 2 | 2 | 4 | 62 | 80 | 1 | 168 | | >=16 | 2 | 0 | 0 | 1 | 1 | 6 | 1 | 2 | 1 | 0 | 23 | 2 | 1 | 0 | 1 | 20 | 724 | 6 | 791 | | Total | 66 | 55 | 148 | 191 | 254 | 616 | 384 | 507 | 425 | 288 | 652 | 135 | 241 | 66 | 58 | 228 | 862 | 13 | 5189 |
| Table 8: Cross-tabulation of Current and One Year Ahead Inflation Expectations: June 2018 | | (Number of Respondents) | | One Year Ahead Inflation Rate (per cent) | | Current Inflation Rate (per cent) | | <1 | 1-<2 | 2-<3 | 3-<4 | 4-<5 | 5-<6 | 6-<7 | 7-<8 | 8-<9 | 9-<10 | 10-<11 | 11-<12 | 12-<13 | 13-<14 | 14-<15 | 15-<16 | >=16 | No idea | Total | | <1 | 24 | 2 | 3 | 4 | 0 | 5 | 0 | 0 | 1 | 0 | 0 | 0 | 0 | 0 | 0 | 1 | 4 | 0 | 44 | | 1-<2 | 11 | 14 | 3 | 5 | 4 | 3 | 0 | 0 | 0 | 1 | 0 | 0 | 0 | 0 | 0 | 0 | 0 | 0 | 41 | | 2-<3 | 42 | 4 | 60 | 20 | 37 | 22 | 8 | 1 | 3 | 0 | 0 | 0 | 0 | 0 | 0 | 0 | 0 | 1 | 198 | | 3-<4 | 26 | 3 | 5 | 41 | 36 | 53 | 17 | 10 | 10 | 1 | 4 | 0 | 0 | 1 | 0 | 1 | 1 | 0 | 209 | | 4-<5 | 42 | 1 | 5 | 10 | 86 | 51 | 47 | 30 | 22 | 13 | 10 | 2 | 3 | 0 | 0 | 1 | 1 | 2 | 326 | | 5-<6 | 85 | 1 | 4 | 7 | 12 | 256 | 64 | 169 | 107 | 48 | 159 | 9 | 13 | 5 | 1 | 14 | 4 | 7 | 965 | | 6-<7 | 30 | 0 | 0 | 2 | 3 | 5 | 93 | 36 | 77 | 21 | 40 | 8 | 12 | 4 | 4 | 1 | 3 | 4 | 343 | | 7-<8 | 28 | 0 | 0 | 2 | 0 | 7 | 3 | 124 | 39 | 60 | 85 | 18 | 29 | 5 | 3 | 11 | 4 | 2 | 420 | | 8-<9 | 21 | 0 | 1 | 3 | 1 | 4 | 2 | 3 | 101 | 31 | 114 | 19 | 66 | 10 | 8 | 13 | 9 | 1 | 407 | | 9-<10 | 20 | 0 | 0 | 0 | 0 | 3 | 0 | 5 | 4 | 61 | 32 | 34 | 29 | 12 | 12 | 13 | 8 | 0 | 233 | | 10-<11 | 45 | 0 | 2 | 1 | 1 | 16 | 0 | 13 | 10 | 3 | 252 | 17 | 102 | 40 | 39 | 178 | 108 | 3 | 830 | | 11-<12 | 2 | 0 | 0 | 0 | 0 | 0 | 1 | 0 | 2 | 1 | 1 | 32 | 3 | 8 | 4 | 9 | 10 | 0 | 73 | | 12-<13 | 5 | 0 | 0 | 0 | 0 | 1 | 0 | 0 | 1 | 0 | 2 | 0 | 26 | 3 | 7 | 12 | 19 | 0 | 76 | | 13-<14 | 4 | 0 | 0 | 0 | 0 | 0 | 0 | 0 | 0 | 0 | 0 | 0 | 0 | 9 | 0 | 4 | 8 | 0 | 25 | | 14-<15 | 0 | 0 | 0 | 0 | 0 | 0 | 0 | 1 | 0 | 1 | 0 | 0 | 1 | 0 | 8 | 5 | 24 | 0 | 40 | | 15-<16 | 8 | 0 | 0 | 0 | 0 | 1 | 0 | 1 | 1 | 0 | 7 | 1 | 1 | 0 | 0 | 49 | 98 | 1 | 168 | | >=16 | 46 | 0 | 0 | 0 | 2 | 3 | 1 | 1 | 1 | 1 | 16 | 1 | 1 | 0 | 1 | 22 | 681 | 14 | 791 | | Total | 439 | 25 | 83 | 95 | 182 | 430 | 236 | 394 | 379 | 242 | 722 | 141 | 286 | 97 | 87 | 334 | 982 | 35 | 5189 |
|
 IST,
IST,