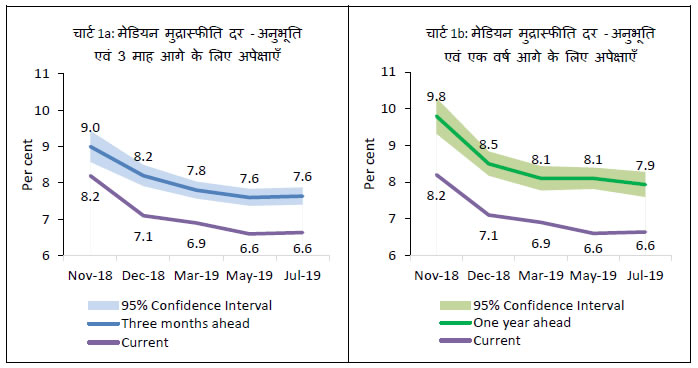
आज, रिजर्व बैंक ने जुलाई 2019 चक्र के मुद्रास्फीति पर घरेलू अपेक्षाओं के सर्वेक्षण (IESH)1 के परिणाम जारी किए। सर्वेक्षण 18 प्रमुख शहरों में आयोजित किया गया था और इसके परिणाम 5,870 शहरी परिवारों के प्रत्युत्तरों पर आधारित हैं।
विशेष:
i. तीन महीने आगे के परिवारों की मेडियन मुद्रास्फीति अपेक्षाएं, मई 2019 के चक्र के सर्वेक्षण की तरह 7.6 प्रतिशत पर अपरिवर्तित रही; एक वर्ष की मेडियन मुद्रास्फीति अपेक्षाएं, 20 आधार अंक से गिरकर 7.9 प्रतिशत हो गई (चार्ट 1a, 1b, तालिका 2)।
ii. मई 2019 की तुलना में, कम परिवारों को साल भर में मुद्रास्फीति बढ़ने की उम्मीद है (तालिका 1b)।
Table 1(a): Product-wise Expectations of Prices for Three Months ahead
(Percentage of Respondents)
Survey period ended
Jun-18
Dec-18
Mar-19
May-19
Jul-19
General
Estimate
SE
Estimate
SE
Estimate
SE
Estimate
SE
Prices will increase
83.8
72.9
1.04
74.8
1.02
78.3
1.01
77.9
0.95
Price increase more than current rate
50.1
46.2
1.14
44.1
1.08
50.0
1.22
49.8
1.15
Price increase similar to current rate
26.4
23.3
0.96
26.9
0.97
25.6
1.01
24.7
0.98
Price increase less than current rate
7.3
3.4
0.39
3.8
0.41
2.8
0.32
3.4
0.38
No changes in prices
14.6
21.2
0.98
21.9
0.98
18.4
0.96
18.5
0.88
Decline in prices
1.6
5.8
0.46
3.4
0.36
3.3
0.35
3.6
0.39
Food Product
Prices will increase
81.4
70.7
0.98
73.7
0.96
78.5
0.87
80.0
0.87
Price increase more than current rate
47.8
42.7
1.08
43.6
1.06
48.5
1.13
48.5
1.09
Price increase similar to current rate
24.8
22.4
0.87
24.1
0.88
24.7
0.94
25.7
1.01
Price increase less than current rate
8.7
5.7
0.48
6.0
0.49
5.4
0.46
5.8
0.47
No changes in prices
13.3
17.2
0.79
17.5
0.84
15.0
0.77
13.8
0.75
Decline in prices
5.3
12.0
0.65
8.8
0.56
6.5
0.47
6.2
0.52
Non- Food Product
Prices will increase
78.2
67.6
1.00
71.3
0.94
75.8
0.91
73.8
0.97
Price increase more than current rate
44.5
40.8
1.08
41.0
1.02
45.2
1.15
43.1
1.14
Price increase similar to current rate
24.4
21.6
0.89
24.5
0.86
25.3
0.91
25.2
0.93
Price increase less than current rate
9.3
5.3
0.47
5.7
0.48
5.4
0.44
5.5
0.46
No changes in prices
17.7
20.5
0.85
21.9
0.87
18.1
0.81
20.4
0.90
Decline in prices
4.1
11.9
0.63
6.8
0.47
6.0
0.47
5.8
0.48
Household Durables
Prices will increase
58.7
56.8
1.08
59.5
1.05
61.3
1.12
57.9
1.07
Price increase more than current rate
32.6
34.8
1.08
35.2
0.99
37.0
1.12
33.7
1.05
Price increase similar to current rate
19.1
17.9
0.85
19.3
0.79
19.9
0.85
19.6
0.81
Price increase less than current rate
7.1
4.1
0.39
5.0
0.41
4.3
0.41
4.6
0.41
No changes in prices
30.9
24.8
0.91
27.7
0.96
27.2
1.01
28.2
0.96
Decline in prices
10.4
18.4
0.77
12.8
0.62
11.5
0.64
13.9
0.67
Cost of Housing
Prices will increase
71.6
69.1
1.03
68.1
0.98
70.9
1.06
68.6
1.01
Price increase more than current rate
45.3
46.5
1.06
44.2
0.97
46.9
1.13
45.2
1.04
Price increase similar to current rate
19.9
18.2
0.79
19.5
0.76
19.8
0.83
19.4
0.82
Price increase less than current rate
6.4
4.5
0.41
4.4
0.41
4.2
0.39
4.0
0.38
No changes in prices
20.7
22.2
0.94
22.4
0.88
21.7
0.96
22.8
0.90
Decline in prices
7.7
8.6
0.57
9.5
0.60
7.3
0.52
8.6
0.58
Cost of Services
Prices will increase
70.8
65.7
1.10
66.4
1.02
68.6
1.03
66.1
1.03
Price increase more than current rate
40.8
40.2
1.11
39.2
1.00
42.6
1.14
39.8
1.07
Price increase similar to current rate
22.8
21.2
0.82
21.9
0.84
21.7
0.89
21.6
0.83
Price increase less than current rate
7.3
4.3
0.41
5.3
0.45
4.3
0.41
4.7
0.42
No changes in prices
26.5
28.2
1.02
28.9
0.99
27.7
0.99
28.7
0.94
Decline in prices
2.6
6.1
0.45
4.7
0.42
3.8
0.37
5.3
0.46
Note: 1. The table provides estimates and standard errors for qualitative responses from the December 2018 round onwards. For earlier rounds, the results are based on sample proportions.
2. Constituent items may not add up to the corresponding total, due to rounding off.
Table 1(b): Product-wise Expectations of Prices for One Year ahead
(Percentage of Respondents)
Survey period ended
Jun-18
Dec-18
Mar-19
May-19
Jul-19
General
Estimate
SE
Estimate
SE
Estimate
SE
Estimate
SE
Prices will increase
91.6
83.8
0.82
84.4
0.90
86.3
0.77
83.8
0.87
Price increase more than current rate
59.8
57.5
1.15
54.6
1.08
58.5
1.19
56.8
1.15
Price increase similar to current rate
25.8
23.3
1.00
26.6
0.93
24.9
1.03
24.1
1.01
Price increase less than current rate
6.0
3.0
0.37
3.2
0.38
3.0
0.32
2.9
0.35
No changes in prices
6.5
11.3
0.73
12.6
0.83
10.2
0.70
12.6
0.78
Decline in prices
1.9
4.9
0.43
3.0
0.33
3.5
0.37
3.6
0.40
Food Product
Prices will increase
85.1
80.0
0.82
80.1
0.87
83.1
0.76
81.9
0.80
Price increase more than current rate
51.4
50.6
1.08
47.2
1.06
50.4
1.19
49.3
1.16
Price increase similar to current rate
26.5
24.7
0.93
28.0
0.88
27.6
0.97
27.7
0.98
Price increase less than current rate
7.1
4.7
0.43
5.0
0.44
5.1
0.43
4.8
0.42
No changes in prices
9.7
12.1
0.68
14.0
0.76
11.4
0.64
12.0
0.67
Decline in prices
5.3
7.9
0.52
5.9
0.45
5.5
0.43
6.1
0.49
Non- Food Product
Prices will increase
83.3
76.4
0.92
78.2
0.89
81.3
0.81
78.1
0.89
Price increase more than current rate
49.1
47.5
1.09
45.7
1.05
49.7
1.18
46.1
1.11
Price increase similar to current rate
26.6
24.2
0.92
27.5
0.89
26.8
0.99
27.1
0.97
Price increase less than current rate
7.6
4.7
0.43
5.0
0.41
4.9
0.44
4.9
0.44
No changes in prices
12.7
15.8
0.78
16.9
0.80
13.7
0.72
16.6
0.80
Decline in prices
4.0
7.7
0.54
5.0
0.41
5.0
0.43
5.3
0.47
Household Durables
Prices will increase
70.6
66.9
1.02
68.3
0.99
68.8
1.04
66.2
1.01
Price increase more than current rate
41.6
42.0
1.09
41.3
1.02
42.9
1.14
39.8
1.08
Price increase similar to current rate
21.8
20.4
0.84
22.6
0.81
21.9
0.88
22.0
0.91
Price increase less than current rate
7.2
4.5
0.40
4.4
0.41
4.0
0.40
4.3
0.39
No changes in prices
21.2
20.1
0.91
21.9
0.89
21.5
0.91
23.0
0.89
Decline in prices
8.2
13.0
0.69
9.8
0.57
9.7
0.59
10.9
0.61
Cost of Housing
Prices will increase
81.0
79.6
0.85
77.6
0.86
79.8
0.84
76.9
0.89
Price increase more than current rate
53.0
55.9
1.00
51.0
1.01
54.3
1.05
52.1
1.00
Price increase similar to current rate
21.5
19.8
0.78
22.9
0.77
21.9
0.84
21.5
0.83
Price increase less than current rate
6.5
3.9
0.39
3.8
0.36
3.6
0.37
3.4
0.34
No changes in prices
13.3
13.7
0.74
15.2
0.75
14.3
0.77
15.3
0.75
Decline in prices
5.7
6.7
0.50
7.2
0.53
5.9
0.45
7.8
0.55
Cost of Services
Prices will increase
84.1
77.9
0.88
78.8
0.87
80.9
0.83
77.1
0.93
Price increase more than current rate
49.5
49.0
1.11
47.5
1.02
50.3
1.12
47.2
1.12
Price increase similar to current rate
26.6
24.1
0.90
26.4
0.87
25.3
0.94
25.2
0.95
Price increase less than current rate
8.0
4.8
0.44
4.8
0.42
5.3
0.49
4.6
0.43
No changes in prices
13.7
17.1
0.82
17.4
0.81
15.5
0.77
17.8
0.82
Decline in prices
2.2
5.0
0.44
3.9
0.37
3.6
0.36
5.2
0.47
Note: 1. The table provides estimates and standard errors for qualitative responses from the December 2018 round onwards. For earlier rounds, the results are based on sample proportions.
2. Constituent items may not add up to the corresponding total, due to rounding off.
Table 2: Inflation Expectations of Various Groups: July 2019
Current Perception
Three Months ahead Expectation
One Year ahead Expectation
Mean
Median
Mean
Median
Mean
Median
Estimate
SE
Estimate
SE
Estimate
SE
Estimate
SE
Estimate
SE
Estimate
SE
Overall
7.9
0.10
6.6
0.15
8.6
0.10
7.6
0.12
8.3
0.13
7.9
0.18
Gender-wise
Male
8.0
0.13
6.9
0.19
8.8
0.14
7.9
0.16
8.4
0.16
8.0
0.23
Female
7.9
0.13
6.5
0.20
8.7
0.14
7.6
0.15
8.4
0.17
8.0
0.21
Category-wise
Financial Sector Employees
8.4
0.47
8.1
0.70
9.7
0.62
8.7
0.71
9.1
0.83
8.9
0.90
Other Employees
7.9
0.19
6.7
0.18
8.6
0.20
7.7
0.19
8.2
0.23
7.9
0.28
Self Employed
8.2
0.19
7.0
0.32
8.9
0.21
7.9
0.33
8.5
0.25
8.3
0.38
Homemaker
7.8
0.15
6.4
0.22
8.6
0.16
7.6
0.16
8.3
0.18
7.9
0.23
Retired Persons
8.7
0.35
8.0
0.50
9.4
0.37
8.8
0.47
9.2
0.43
9.7
0.59
Daily Workers
8.1
0.27
7.1
0.51
8.8
0.28
8.2
0.29
8.5
0.30
8.2
0.37
Other category
7.5
0.21
6.6
0.27
8.4
0.23
7.6
0.25
8.3
0.29
8.2
0.34
Age Group-wise
Up to 25 years
7.3
0.16
6.2
0.20
8.2
0.17
7.3
0.17
8.1
0.22
7.7
0.25
25 to 30 years
7.7
0.19
6.4
0.22
8.4
0.20
7.4
0.23
8.4
0.23
8.0
0.26
30 to 35 years
7.9
0.20
6.7
0.25
8.6
0.20
7.6
0.18
8.1
0.24
7.6
0.35
35 to 40 years
7.9
0.19
6.6
0.31
8.7
0.20
7.6
0.20
8.1
0.23
7.7
0.31
40 to 45 years
8.1
0.21
7.0
0.34
8.9
0.21
7.9
0.26
8.5
0.25
8.1
0.34
45 to 50 years
8.2
0.22
7.1
0.45
8.8
0.23
7.9
0.25
8.5
0.27
8.3
0.36
50 to 55 years
8.3
0.28
6.9
0.37
9.0
0.28
7.8
0.37
8.0
0.34
7.3
0.38
55 to 60 years
7.8
0.26
6.6
0.38
8.7
0.28
7.6
0.34
8.3
0.32
7.8
0.56
60 years and above
8.4
0.29
7.4
0.46
9.0
0.30
8.4
0.37
8.8
0.34
8.9
0.67
City-wise
Ahmedabad
7.7
0.31
6.7
0.55
8.9
0.38
8.0
0.45
8.6
0.43
7.9
0.52
Bengaluru
6.0
0.26
5.3
0.17
7.2
0.25
6.3
0.33
8.0
0.32
7.7
0.49
Bhopal
7.3
0.42
6.5
0.51
8.5
0.47
7.9
0.67
8.4
0.49
9.4
0.83
Bhubaneswar
6.2
0.46
5.8
0.35
7.1
0.60
6.8
0.48
8.0
1.19
8.1
1.02
Chennai
8.8
0.47
8.2
0.89
9.9
0.50
9.5
0.90
10.8
0.55
11.2
1.27
Delhi
7.5
0.20
6.4
0.24
7.9
0.23
6.9
0.29
6.9
0.32
6.4
0.39
Guwahati
6.1
0.42
5.7
0.32
6.9
0.58
6.9
0.94
6.8
0.83
6.8
1.24
Hyderabad
10.9
0.44
11.0
1.12
12.1
0.40
14.2
1.69
12.7
0.34
15.4
1.08
Jaipur
6.3
0.51
6.2
0.55
6.8
0.60
6.8
0.82
6.1
0.98
6.2
1.91
Kolkata
9.2
0.31
8.6
0.50
10.1
0.34
9.4
0.57
10.1
0.38
10.2
0.49
Lucknow
8.3
0.57
8.0
0.67
9.3
0.69
9.2
0.67
9.0
0.88
9.6
0.89
Mumbai
8.1
0.28
6.9
0.43
8.6
0.31
7.6
0.36
6.7
0.36
6.3
0.60
Nagpur
5.5
0.55
4.6
0.61
6.2
0.49
5.4
0.33
6.0
0.59
5.7
0.41
Patna
7.0
0.31
6.6
0.53
7.2
0.33
6.8
0.58
7.3
0.50
6.9
0.64
Thiruvananthapuram
6.1
0.46
5.5
0.41
7.6
0.50
6.9
0.82
9.6
0.58
9.5
0.89
Chandigarh
7.8
0.82
6.5
0.94
7.5
0.68
6.4
0.66
7.4
0.88
6.5
0.72
Ranchi
6.6
0.46
6.5
0.62
6.9
0.47
6.8
0.62
5.5
0.70
6.3
0.77
Raipur
6.7
0.56
5.6
0.49
7.0
0.46
5.8
0.56
5.5
0.74
5.1
0.64
Note: The table provides estimates and standard errors for quantitative responses for the July 2019 round.
Table 3: Household Inflation Expectations – Current Perception, Three Months and One Year Ahead Expectations
Current Perception
Three Months ahead Expectation
One Year ahead Expectation
Mean
Median
Mean
Median
Mean
Median
Estimate
SE
Estimate
SE
Estimate
SE
Estimate
SE
Estimate
SE
Estimate
SE
Jun-18
8.9
--
8.1
--
9.5
--
8.9
--
9.8
--
10.1
--
Dec-18
8.3
0.11
7.1
0.18
9.1
0.11
8.2
0.15
8.6
0.13
8.5
0.17
Mar-19
8.0
0.09
6.9
0.14
8.7
0.10
7.8
0.12
8.3
0.12
8.1
0.17
May-19
7.8
0.10
6.6
0.15
8.6
0.10
7.6
0.12
8.4
0.12
8.1
0.16
Jul-19
7.9
0.10
6.6
0.15
8.6
0.10
7.6
0.12
8.3
0.13
7.9
0.18
‘--‘ Calculation of Standard Error was initiated from the September 2018 round onwards.
Note: The table provides estimates and standard errors for quantitative responses.
Table 4: Households Expecting General Price Movements in Coherence with Movements in Price Expectations of Various Product Groups: Three Months Ahead and One Year Ahead
(Percentage of Respondents)
Survey period ended
Food
Non-Food
Households durables
Housing
Cost of services
Three Months Ahead
Jun-18
65.6
64.7
53.8
60.0
63.7
Dec-18
62.9
64.0
55.3
62.4
64.3
Mar-19
62.6
62.3
54.9
58.8
63.4
May-19
66.4
65.4
56.8
62.0
66.2
Jul-19
66.1
65.5
55.3
60.8
65.0
One Year Ahead
Jun-18
71.9
71.4
60.9
67.4
71.9
Dec-18
72.5
71.7
62.5
70.3
72.9
Mar-19
70.2
68.8
61.8
66.0
69.9
May-19
71.6
71.3
62.7
70.7
72.5
Jul-19
72.3
71.2
61.5
70.0
72.4
Note: Figures are based on sample observations
Table 5(a): Cross-tabulation of Number of Respondents by Current Inflation Perception and Three Months Ahead Inflation Expectations: July 2019
Three Months Ahead Inflation Rate (per cent)
Current Inflation Rate (per cent)
<1
1-<2
2-<3
3-<4
4-<5
5-<6
6-<7
7-<8
8-<9
9-<10
10-<11
11-<12
12-<13
13-<14
14-<15
15-<16
>=16
No idea
Total
<1
33
3
5
0
1
4
0
0
0
0
2
0
0
0
0
0
1
0
49
1-<2
2
36
22
6
1
2
0
0
0
0
0
0
0
0
0
0
0
0
69
2-<3
1
12
155
95
64
21
1
0
1
0
0
0
0
0
0
0
0
0
350
3-<4
1
4
18
180
102
86
14
5
3
0
0
0
0
0
0
0
0
0
413
4-<5
0
1
15
32
260
129
75
15
8
1
1
0
1
0
0
1
0
0
539
5-<6
1
3
15
24
26
569
217
243
68
7
67
1
0
1
0
3
1
0
1246
6-<7
0
0
0
3
8
9
218
120
80
19
19
1
1
0
0
0
1
0
479
7-<8
0
0
2
3
2
17
11
216
84
49
35
4
6
0
1
0
0
1
431
8-<9
0
0
0
2
3
1
5
2
196
61
87
9
13
2
0
3
5
0
389
9-<10
0
0
0
0
1
0
1
2
8
59
41
15
9
3
1
8
2
0
150
10-<11
1
1
1
2
0
22
4
8
21
7
369
56
141
45
7
131
41
0
857
11-<12
0
0
0
0
0
0
0
0
0
0
2
34
16
6
4
2
1
0
65
12-<13
0
0
0
0
0
1
0
0
0
0
3
0
21
8
11
16
8
0
68
13-<14
0
0
0
0
0
0
0
1
0
0
1
0
0
2
3
8
3
0
18
14-<15
0
0
0
0
0
0
0
1
0
1
0
0
0
0
6
7
10
0
25
15-<16
0
0
0
1
0
5
0
0
1
0
5
0
1
0
0
82
92
1
188
>=16
2
0
0
1
0
4
0
0
0
0
12
0
1
1
1
12
498
2
534
Total
41
60
233
349
468
870
546
613
470
204
644
120
210
68
34
273
663
4
5870
Note: Figures are based on sample observations
Table 5(b): Cross-tabulation of Number of Respondents by Current Inflation Perception and One Year Ahead Inflation Expectations: July 2019
One Year Ahead Inflation Rate (per cent)
Current Inflation Rate (per cent)
<1
1-<2
2-<3
3-<4
4-<5
5-<6
6-<7
7-<8
8-<9
9-<10
10-<11
11-<12
12-<13
13-<14
14-<15
15-<16
>=16
No idea
Total
<1
28
4
3
1
1
3
4
0
0
0
5
0
0
0
0
0
0
0
49
1-<2
12
26
12
9
5
2
1
0
1
0
1
0
0
0
0
0
0
0
69
2-<3
69
3
84
34
67
59
13
7
6
0
6
0
0
0
0
1
0
1
350
3-<4
95
0
3
82
31
115
44
19
10
2
10
0
2
0
0
0
0
0
413
4-<5
130
1
3
11
131
67
93
37
34
7
17
1
2
0
2
2
1
0
539
5-<6
175
0
3
11
15
358
135
172
118
46
158
11
11
5
1
18
9
0
1246
6-<7
73
1
0
0
4
0
119
72
80
36
62
6
15
0
3
6
2
0
479
7-<8
75
0
0
2
1
4
3
127
51
68
52
10
16
5
5
5
7
0
431
8-<9
62
0
0
0
0
2
3
2
104
35
98
14
35
5
4
11
14
0
389
9-<10
19
0
0
1
0
0
0
2
1
32
34
21
16
2
0
14
8
0
150
10-<11
85
0
1
0
1
3
3
3
4
3
279
30
82
27
24
161
146
5
857
11-<12
15
0
0
0
0
0
0
0
0
0
2
14
16
3
1
8
6
0
65
12-<13
9
0
0
0
0
0
0
0
0
0
0
0
10
5
6
11
27
0
68
13-<14
4
0
0
0
0
0
0
0
0
0
0
0
0
2
0
7
5
0
18
14-<15
4
0
0
0
0
0
0
1
0
0
0
0
0
0
1
5
13
1
25
15-<16
18
0
0
0
0
0
0
0
0
0
3
0
1
0
0
63
103
0
188
>=16
53
0
0
0
0
2
1
0
0
0
8
0
2
1
0
6
455
6
534
Total
926
35
109
151
256
615
419
442
409
229
735
107
208
55
47
318
796
13
5870
Note: Figures are based on sample observations
1 सर्वेक्षण, जो रिजर्व बैंक द्वारा द्विमासिक अंतराल पर आयोजित किया जाता है, उत्तरदाताओं के अपेक्षित निकट भविष्य में मुद्रास्फीतिकारी दबाव पर उपयोगी निदेशात्मक जानकारी प्रदान करता है और उनकी स्वयं की खपत प्रवृत्ति को प्रतिबिंबित करती हैं। अतः इन्हे मुद्रास्फीति पर परिवारिक इकाइयो की भावनाओं के रूप में माना जाना चाहिए।
RbiTtsCommonUtility
प्ले हो रहा है
सुनें
LOADING...
0:062:49
संबंधित एसेट
आरबीआई-इंस्टॉल-आरबीआई-सामग्री-वैश्विक
RbiSocialMediaUtility
इस पेज को शेयर करें:
आरबीआई मोबाइल एप्लीकेशन इंस्टॉल करें और लेटेस्ट न्यूज़ का तुरंत एक्सेस पाएं!
RbiWasItHelpfulUtility
क्या यह पेज उपयोगी था?धन्यवाद!
अधिक जानकारी देना चाहेंगे?
प्रतिक्रिया के लिए आपका धन्यवाद!प्रतिक्रिया के लिए आपका धन्यवाद!