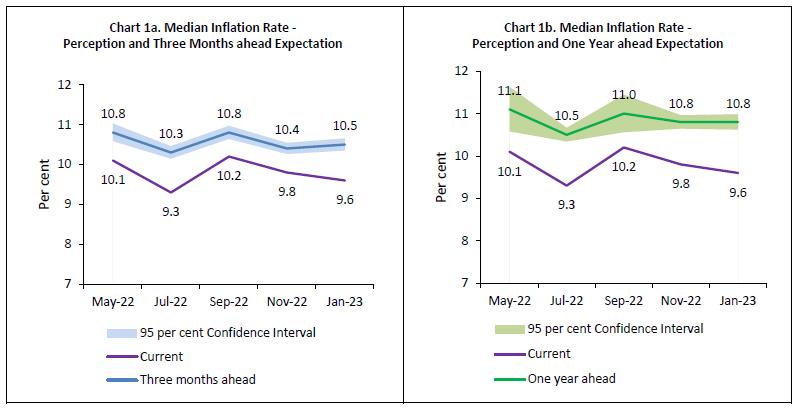
आज रिज़र्व बैंक ने अपने द्विमासिक मुद्रास्फीति पर घरेलू अपेक्षाओं का सर्वेक्षण (IESH)12 के जनवरी 2023 दौर के परिणाम जारी किए। सर्वेक्षण 2 से 11 जनवरी, 2023 के दौरान 19 प्रमुख शहरों में 6,024 शहरी परिवारों से प्रतिक्रिया के साथ किया गया था। इस नमूने में महिला उत्तरदाताओं की हिस्सेदारी 49.7 प्रतिशत थी। मीडियन के संदर्भ में परिणामों को संक्षेपित किया गया है।
मुख्य विशेषताएं:
जनवरी 2023 में मौजूदा अवधि के लिए परिवारों की मुद्रास्फीति धारणा 20 आधार अंकों (बीपीएस) से घटकर 9.6 प्रतिशत हो गई।
तीन महीने आगे की अवधि के लिए परिवारों की मुद्रास्फीति अपेक्षाएं 10 बीपीएस बढ़ी, जबकि सर्वेक्षण के नवंबर 2022 के दौर से उनकी एक साल आगे की उम्मीदें अपरिवर्तित रहीं [चार्ट 1ए और 1बी; सारणी 3]।
खपत श्रेणियों के बीच, मूल्य वृद्धि की अपेक्षा रखने वाले उत्तरदाताओं का अनुपात दोनों सीमाओं के लिए खाद्य समूह के लिए उच्चतम था, जैसा कि पिछले दो सर्वेक्षण दौरों में भी देखा गया था [सारणी 1(ए) और 1(बी)]।
उत्तरदाताओं को पिछले सर्वेक्षण दौर की तुलना में अगले तीन महीनों में घरेलू टिकाऊ वस्तुओं और आवास की लागत के लिए अधिक कीमतों के दबाव की उम्मीद है [सारणी 1(ए)]।
शहर-वार, मुद्रास्फीति की अपेक्षाओं की सीमा तीन महीने के सीमाओं पर 7.4-12.8 प्रतिशत और एक वर्ष की सीमा पर 8.3-13.3 प्रतिशत थी [सारणी 2]।
Table 1(a): Product-wise Expectations of Prices for Three Months ahead
(Percentage of Respondents)
Survey period ended
Jan-22
Jul-22
Sep-22
Nov-22
Jan-23
General
Estimate
SE
Estimate
SE
Estimate
SE
Estimate
SE
Estimate
SE
Prices will increase
85.6
0.68
83.1
0.80
85.0
0.77
83.8
0.76
84.3
0.76
Price increase more than current rate
61.4
1.07
58.7
1.21
59.9
1.14
58.5
1.13
60.8
1.14
Price increase similar to current rate
20.5
0.87
21.1
0.97
20.9
0.85
20.8
0.89
20.2
0.86
Price increase less than current rate
3.7
0.40
3.3
0.36
4.2
0.44
4.4
0.43
3.4
0.36
No changes in prices
12.0
0.64
13.7
0.74
12.6
0.70
13.7
0.69
13.3
0.71
Decline in prices
2.4
0.30
3.2
0.38
2.4
0.33
2.5
0.32
2.3
0.30
Food Product
Prices will increase
83.7
0.71
83.7
0.77
85.3
0.69
85.0
0.72
84.6
0.72
Price increase more than current rate
61.0
1.01
59.6
1.13
61.9
1.09
62.0
1.04
61.1
1.08
Price increase similar to current rate
17.0
0.78
18.9
0.90
17.4
0.75
17.2
0.76
18.4
0.77
Price increase less than current rate
5.7
0.47
5.2
0.45
6.1
0.49
5.9
0.48
5.1
0.43
No changes in prices
10.5
0.58
10.1
0.64
9.3
0.55
9.9
0.58
10.2
0.59
Decline in prices
5.8
0.45
6.1
0.52
5.4
0.45
5.1
0.44
5.2
0.45
Non- Food Product
Prices will increase
80.4
0.73
80.8
0.84
82.3
0.74
81.1
0.77
81.8
0.77
Price increase more than current rate
55.4
1.02
55.7
1.14
55.8
1.08
57.2
1.05
56.4
1.08
Price increase similar to current rate
19.4
0.80
19.8
0.89
20.5
0.79
17.9
0.78
20.5
0.82
Price increase less than current rate
5.6
0.46
5.2
0.45
6.0
0.48
6.0
0.48
4.9
0.44
No changes in prices
14.1
0.64
13.2
0.72
13.1
0.67
14.4
0.70
13.4
0.67
Decline in prices
5.4
0.43
6.0
0.49
4.6
0.42
4.5
0.43
4.7
0.43
Household Durables
Prices will increase
69.9
0.88
68.7
0.95
70.2
0.89
68.3
0.93
72.4
0.90
Price increase more than current rate
48.6
1.03
46.6
1.11
48.0
1.03
47.2
1.07
50.3
1.07
Price increase similar to current rate
16.2
0.70
17.3
0.81
16.8
0.70
16.0
0.75
17.5
0.71
Price increase less than current rate
5.1
0.45
4.8
0.44
5.3
0.45
5.1
0.43
4.6
0.42
No changes in prices
23.1
0.82
23.7
0.88
22.8
0.84
24.5
0.87
21.2
0.84
Decline in prices
7.0
0.45
7.6
0.54
7.1
0.50
7.3
0.49
6.3
0.47
Cost of Housing
Prices will increase
71.5
0.88
74.8
0.88
75.7
0.92
76.5
0.88
78.0
0.86
Price increase more than current rate
51.3
1.07
54.2
1.10
53.2
1.07
55.4
1.09
58.4
1.08
Price increase similar to current rate
16.1
0.74
16.9
0.77
17.7
0.70
16.8
0.75
16.3
0.73
Price increase less than current rate
4.2
0.42
3.7
0.37
4.8
0.42
4.3
0.41
3.3
0.35
No changes in prices
21.3
0.80
20.3
0.82
20.2
0.88
19.3
0.83
18.9
0.84
Decline in prices
7.2
0.48
4.8
0.44
4.1
0.39
4.2
0.40
3.1
0.34
Cost of Services
Prices will increase
74.3
0.83
71.7
0.93
72.2
0.91
70.6
0.89
71.7
0.90
Price increase more than current rate
51.6
1.05
48.6
1.12
49.4
1.10
49.1
1.04
49.9
1.08
Price increase similar to current rate
18.0
0.79
19.0
0.88
17.9
0.75
16.9
0.73
17.6
0.71
Price increase less than current rate
4.6
0.43
4.1
0.41
5.0
0.41
4.5
0.41
4.1
0.40
No changes in prices
22.3
0.78
24.8
0.92
24.7
0.87
26.6
0.88
25.5
0.88
Decline in prices
3.4
0.34
3.4
0.38
3.1
0.36
2.9
0.33
2.7
0.30
Note:
1. The table provides estimates and standard errors for qualitative responses.
2. Constituent items may not add up to the corresponding total, due to rounding off.
Table 1(b): Product-wise Expectations of Prices for One Year ahead
(Percentage of Respondents)
Survey period ended
Jan-22
Jul-22
Sep-22
Nov-22
Jan-23
General
Estimate
SE
Estimate
SE
Estimate
SE
Estimate
SE
Estimate
SE
Prices will increase
89.6
0.58
88.4
0.70
90.8
0.59
90.8
0.57
91.6
0.53
Price increase more than current rate
68.2
1.05
66.2
1.23
68.1
1.12
69.5
1.08
70.8
1.02
Price increase similar to current rate
18.1
0.81
19.3
1.00
19.3
0.88
18.2
0.87
17.9
0.81
Price increase less than current rate
3.3
0.39
2.8
0.32
3.5
0.38
3.1
0.34
3.0
0.33
No changes in prices
7.8
0.50
8.1
0.61
6.6
0.49
6.4
0.45
5.7
0.43
Decline in prices
2.6
0.29
3.4
0.41
2.5
0.34
2.8
0.33
2.6
0.31
Food Product
Prices will increase
83.8
0.71
83.5
0.76
86.4
0.67
87.1
0.64
88.0
0.64
Price increase more than current rate
58.2
1.06
58.1
1.18
60.5
1.09
62.9
1.07
62.7
1.07
Price increase similar to current rate
20.4
0.86
21.3
0.98
21.0
0.84
19.6
0.83
20.7
0.87
Price increase less than current rate
5.2
0.45
4.1
0.40
4.9
0.42
4.7
0.42
4.5
0.42
No changes in prices
10.9
0.61
10.5
0.65
8.3
0.52
7.8
0.50
7.6
0.50
Decline in prices
5.3
0.40
6.0
0.55
5.3
0.45
5.0
0.41
4.4
0.39
Non- Food Product
Prices will increase
82.9
0.72
83.6
0.78
86.0
0.69
85.0
0.71
86.7
0.67
Price increase more than current rate
57.5
1.09
58.9
1.16
59.8
1.09
60.7
1.09
62.0
1.09
Price increase similar to current rate
20.5
0.86
20.8
0.92
20.9
0.83
19.9
0.84
20.5
0.83
Price increase less than current rate
4.9
0.44
3.9
0.38
5.4
0.45
4.5
0.41
4.3
0.41
No changes in prices
12.0
0.61
10.9
0.68
9.5
0.56
10.1
0.58
9.1
0.54
Decline in prices
5.0
0.41
5.4
0.54
4.4
0.41
4.8
0.42
4.1
0.39
Household Durables
Prices will increase
75.4
0.87
75.5
0.84
77.7
0.79
77.6
0.84
80.8
0.77
Price increase more than current rate
52.1
1.07
52.2
1.12
54.1
1.06
55.0
1.09
57.2
1.08
Price increase similar to current rate
18.7
0.81
19.3
0.88
18.9
0.79
18.2
0.80
19.3
0.79
Price increase less than current rate
4.6
0.45
4.0
0.39
4.6
0.41
4.3
0.39
4.3
0.41
No changes in prices
18.5
0.77
18.3
0.78
16.4
0.70
16.4
0.72
13.8
0.65
Decline in prices
6.1
0.44
6.1
0.49
6.0
0.45
6.0
0.47
5.4
0.43
Cost of Housing
Prices will increase
79.3
0.78
83.4
0.75
85.8
0.67
86.5
0.69
87.4
0.63
Price increase more than current rate
57.0
1.03
61.4
1.14
61.8
1.04
64.4
1.04
66.8
0.98
Price increase similar to current rate
18.1
0.78
18.6
0.87
19.6
0.79
18.5
0.80
17.2
0.77
Price increase less than current rate
4.2
0.43
3.4
0.36
4.5
0.41
3.7
0.38
3.5
0.36
No changes in prices
15.1
0.66
12.4
0.67
10.6
0.58
10.2
0.59
9.8
0.57
Decline in prices
5.6
0.43
4.1
0.42
3.6
0.38
3.3
0.37
2.8
0.30
Cost of Services
Prices will increase
82.0
0.75
81.1
0.84
84.2
0.74
84.2
0.74
84.0
0.72
Price increase more than current rate
57.5
1.04
57.4
1.17
58.6
1.08
60.1
1.10
60.2
1.08
Price increase similar to current rate
19.8
0.81
19.9
0.95
21.0
0.81
19.8
0.83
19.7
0.80
Price increase less than current rate
4.6
0.44
3.9
0.39
4.6
0.43
4.3
0.39
4.2
0.41
No changes in prices
15.1
0.68
15.0
0.80
12.9
0.65
12.9
0.67
13.1
0.65
Decline in prices
3.0
0.31
3.8
0.45
2.9
0.37
2.9
0.33
2.8
0.33
Note:
1. The table provides estimates and standard errors for qualitative responses.
2. Constituent items may not add up to the corresponding total, due to rounding off.
Table 2: Inflation Expectations of Various Groups: Jan-23
Current Perception
Three Months ahead Expectation
One Year ahead Expectation
Mean
Median
Mean
Median
Mean
Median
Estimate
SE
Estimate
SE
Estimate
SE
Estimate
SE
Estimate
SE
Estimate
SE
Overall
9.7
0.09
9.6
0.30
10.8
0.10
10.5
0.08
10.8
0.11
10.8
0.09
Gender-wise
Male
10.0
0.13
10.0
0.15
11.0
0.13
10.6
0.11
10.8
0.16
10.9
0.19
Female
9.5
0.13
9.2
0.34
10.7
0.13
10.4
0.09
10.8
0.15
10.8
0.09
Category-wise
Financial Sector Employees
9.8
0.61
9.5
0.76
10.8
0.66
10.6
0.73
11.3
0.84
11.5
1.03
Other Employees
9.9
0.17
9.9
0.25
11.0
0.17
10.6
0.12
11.0
0.20
11.0
0.26
Self Employed
10.1
0.18
10.1
0.11
11.1
0.18
10.7
0.18
10.8
0.24
10.9
0.30
Homemaker
9.6
0.15
9.4
0.38
10.7
0.15
10.4
0.09
11.0
0.18
10.9
0.21
Retired Persons
9.9
0.32
9.9
0.48
10.9
0.31
10.6
0.28
10.8
0.38
11.1
0.49
Daily Workers
9.6
0.26
9.3
0.60
10.8
0.27
10.4
0.28
10.5
0.34
10.6
0.22
Other category
9.1
0.22
8.6
0.29
10.1
0.23
9.9
0.29
10.2
0.27
10.5
0.22
Age Group-wise
Up to 25 years
8.9
0.19
8.3
0.23
10.1
0.20
9.5
0.34
10.2
0.23
10.2
0.21
25 to 30 years
9.5
0.17
9.3
0.40
10.6
0.18
10.4
0.13
10.9
0.21
10.9
0.24
30 to 35 years
9.9
0.21
9.9
0.30
11.0
0.21
10.6
0.14
11.1
0.24
11.2
0.39
35 to 40 years
9.8
0.20
9.9
0.30
11.0
0.20
10.7
0.16
11.0
0.24
11.1
0.38
40 to 45 years
10.0
0.22
10.1
0.23
11.0
0.21
10.6
0.17
10.8
0.26
10.8
0.29
45 to 50 years
10.6
0.24
10.3
0.10
11.3
0.23
10.9
0.36
11.4
0.27
12.4
0.62
50 to 55 years
10.2
0.28
10.1
0.29
11.1
0.28
10.7
0.28
11.2
0.32
11.6
0.67
55 to 60 years
9.5
0.30
9.1
0.54
10.6
0.32
10.4
0.20
10.6
0.36
10.7
0.19
60 years and above
10.1
0.26
10.0
0.34
11.1
0.26
10.7
0.23
10.4
0.35
10.8
0.31
City-wise
Ahmedabad
8.7
0.31
7.8
0.58
9.9
0.38
9.0
0.77
10.0
0.46
9.7
0.90
Bengaluru
9.1
0.27
9.5
0.74
10.3
0.26
10.3
0.29
10.9
0.30
11.2
0.58
Bhopal
9.2
1.02
8.0
1.82
10.2
1.02
9.7
1.66
9.8
0.90
10.1
1.97
Bhubaneswar
8.5
0.62
7.6
1.39
10.5
0.74
10.5
1.36
10.6
0.74
11.2
1.63
Chennai
9.6
0.36
9.9
0.53
11.6
0.40
11.4
0.73
12.3
0.38
13.3
1.10
Delhi
10.8
0.22
10.4
0.10
11.7
0.23
11.4
0.54
11.4
0.26
11.8
0.63
Guwahati
8.2
0.55
7.6
1.03
8.9
0.61
8.1
0.83
9.6
0.73
8.9
0.83
Hyderabad
8.7
0.39
7.9
0.70
9.6
0.43
9.2
0.61
9.8
0.52
10.4
0.65
Jaipur
7.8
0.33
7.4
0.42
8.4
0.37
8.1
0.45
8.3
0.36
8.3
0.46
Jammu
12.0
0.74
11.5
1.61
11.8
0.93
12.8
2.17
10.2
1.00
11.6
1.88
Kolkata
10.8
0.31
10.3
0.24
11.9
0.31
11.7
0.79
12.1
0.33
13.1
1.00
Lucknow
9.0
0.50
8.9
0.59
10.0
0.50
10.0
0.57
9.9
0.62
10.3
0.71
Mumbai
10.3
0.22
9.7
0.33
11.5
0.22
10.8
0.23
10.9
0.29
11.1
0.42
Nagpur
9.9
0.55
9.5
0.70
11.2
0.57
10.6
1.01
11.6
0.56
11.8
1.21
Patna
7.8
0.42
7.4
0.37
8.5
0.45
8.1
0.37
8.6
0.49
8.3
0.28
Thiruvananthapuram
6.8
0.51
5.5
0.20
8.3
0.49
7.4
0.58
9.3
0.57
8.8
0.97
Chandigarh
11.0
0.65
11.0
1.28
11.0
0.66
11.4
1.57
10.7
0.73
12.1
1.91
Ranchi
8.4
0.39
8.0
0.30
9.0
0.52
8.6
0.39
9.1
0.55
9.3
0.57
Raipur
8.5
0.65
8.2
0.78
9.4
0.63
9.1
0.84
10.0
0.97
10.6
0.80
Note: The table provides estimates and standard errors for quantitative responses.
Table 3: Household Inflation Expectations – Current Perception, Three Months and One Year Ahead Expectations
Current Perception
Three Months ahead Expectation
One Year ahead Expectation
Mean
Median
Mean
Median
Mean
Median
Estimate
SE
Estimate
SE
Estimate
SE
Estimate
SE
Estimate
SE
Estimate
SE
Jan-22
9.9
0.10
9.7
0.28
11.1
0.10
10.6
0.08
10.7
0.11
10.7
0.09
Jul-22
9.8
0.10
9.3
0.24
10.7
0.11
10.3
0.08
10.3
0.13
10.5
0.08
Sep-22
10.4
0.10
10.2
0.05
11.3
0.10
10.8
0.09
11.1
0.12
11.0
0.23
Nov-22
10.0
0.10
9.8
0.23
10.9
0.10
10.4
0.07
10.8
0.11
10.8
0.08
Jan-23
9.7
0.09
9.6
0.30
10.8
0.10
10.5
0.08
10.8
0.11
10.8
0.09
Note: The table provides estimates and standard errors for quantitative responses.
Table 4: Households Expecting General Price Movements in Coherence with Movements in Price Expectations of Various Product Groups: Three Months Ahead and One Year Ahead
(Percentage of Respondents)
Survey period ended
Food
Non-Food
Household durables
Housing
Cost of services
Three Months Ahead
Jan-22
66.8
65.8
60.5
61.7
66.0
Jul-22
66.9
67.8
62.3
63.7
66.9
Sep-22
67.1
66.9
61.1
62.0
66.6
Nov-22
66.6
67.1
60.2
64.7
66.0
Jan-23
65.6
67.3
62.6
66.2
66.5
One Year Ahead
Jan-22
71.7
72.4
65.2
67.5
72.9
Jul-22
74.3
75.5
69.2
73.2
75.8
Sep-22
73.8
74.3
67.7
71.7
74.6
Nov-22
74.4
74.8
68.6
73.7
75.0
Jan-23
75.2
74.8
68.4
74.7
74.0
Note: Figures are based on sample observations
Table 5(a): Cross-tabulation of Number of Respondents by Current Inflation Perception and Three Months Ahead Inflation Expectations: Jan-23
Three Months Ahead Inflation Rate (per cent)
Current Inflation Rate (per cent)
<1
1-<2
2-<3
3-<4
4-<5
5-<6
6-<7
7-<8
8-<9
9-<10
10-<11
11-<12
12-<13
13-<14
14-<15
15-<16
>=16
No idea
Total
<1
6
1
3
0
0
0
0
0
0
0
0
0
0
0
0
0
1
1
12
1-<2
2
19
8
2
1
3
0
0
0
0
0
0
0
0
0
0
0
0
35
2-<3
0
10
62
45
21
12
0
0
1
0
1
0
0
0
0
0
0
2
154
3-<4
1
0
5
56
45
49
14
0
0
1
0
0
0
0
0
0
0
3
174
4-<5
0
1
6
5
76
52
30
5
6
1
0
0
0
0
0
2
0
0
184
5-<6
1
2
7
23
23
357
142
196
90
10
117
2
2
0
0
11
1
5
989
6-<7
0
0
0
1
9
8
158
96
68
27
20
0
8
0
0
1
0
0
396
7-<8
0
0
0
0
3
12
7
174
122
63
55
3
8
0
4
1
1
0
453
8-<9
1
0
1
2
5
6
9
8
188
96
149
19
15
4
1
1
4
0
509
9-<10
0
0
0
0
0
3
2
0
4
68
70
23
25
4
1
3
1
0
204
10-<11
0
0
1
1
5
27
6
4
14
9
438
114
242
81
16
277
122
3
1360
11-<12
0
0
0
0
0
0
1
0
1
1
0
15
12
11
5
2
3
0
51
12-<13
0
0
0
0
1
0
0
0
2
0
1
0
47
19
18
27
10
0
125
13-<14
0
0
0
0
1
0
0
0
0
0
0
0
1
14
3
7
5
0
31
14-<15
0
0
0
0
0
0
0
0
0
0
1
1
1
1
11
4
10
1
30
15-<16
0
0
0
1
0
5
0
2
0
0
7
0
1
2
1
87
195
1
302
>=16
0
0
0
2
0
5
2
2
0
0
20
0
2
1
2
21
954
4
1015
Total
11
33
93
138
190
539
371
487
496
276
879
177
364
137
62
444
1307
20
6024
Note: Figures are based on sample observations
Table 5(b): Cross-tabulation of Number of Respondents by Current Inflation Perception and One Year Ahead Inflation Expectations: Jan-23
One Year Ahead Inflation Rate (per cent)
Current Inflation Rate (per cent)
<1
1-<2
2-<3
3-<4
4-<5
5-<6
6-<7
7-<8
8-<9
9-<10
10-<11
11-<12
12-<13
13-<14
14-<15
15-<16
>=16
No idea
Total
<1
6
0
3
1
1
0
0
0
0
0
0
0
0
0
0
0
1
0
12
1-<2
13
5
8
2
4
1
1
0
0
0
1
0
0
0
0
0
0
0
35
2-<3
18
6
31
36
29
21
1
4
3
2
1
0
0
0
0
0
0
2
154
3-<4
16
0
2
30
28
51
19
5
4
3
8
4
1
0
0
0
1
2
174
4-<5
24
0
2
1
37
41
37
11
17
3
6
1
2
0
0
2
0
0
184
5-<6
91
0
5
6
11
184
96
154
105
43
210
8
23
7
4
24
16
2
989
6-<7
32
0
0
0
1
5
90
76
91
19
47
10
11
2
1
7
4
0
396
7-<8
45
0
0
0
0
5
5
99
88
85
68
13
20
3
10
8
4
0
453
8-<9
34
0
1
0
2
4
3
4
99
63
150
40
63
15
6
11
14
0
509
9-<10
13
0
0
0
0
1
0
1
4
32
49
25
39
14
7
12
7
0
204
10-<11
93
0
0
0
0
9
5
3
6
4
246
70
198
60
51
329
283
3
1360
11-<12
4
0
0
0
0
0
0
0
0
1
0
10
9
11
8
3
5
0
51
12-<13
7
0
0
0
0
0
0
2
0
0
0
0
17
11
18
38
32
0
125
13-<14
3
0
0
0
0
0
0
0
0
0
1
0
0
5
3
13
6
0
31
14-<15
2
0
0
0
0
0
0
0
0
0
0
1
0
0
9
5
11
2
30
15-<16
18
0
0
1
0
1
0
0
0
0
8
0
1
0
2
53
216
2
302
>=16
88
0
0
0
0
1
0
1
1
0
12
0
1
0
2
16
885
8
1015
Total
507
11
52
77
113
324
257
360
418
255
807
182
385
128
121
521
1485
21
6024
Note: Figures are based on sample observations
1 सर्वेक्षण के परिणाम उत्तरदाताओं के विचारों को दर्शाते हैं, जो जरूरी नहीं कि रिज़र्व बैंक द्वारा मान्यताप्राप्त हों। पिछले सर्वेक्षण चक्र के परिणाम बैंक की वेबसाइट पर 07 दिसंबर 2022 को जारी किए गए थे।
2 यह सर्वेक्षण भारतीय रिज़र्व बैंक के द्वारा द्विमाही अंतरालों पर संचालित किया जाता है। यह सर्वेक्षण निकट भविष्य में मुद्रास्फीतिकारी दबावों पर उत्तरदाताओं से प्राप्त यथापेक्षित उपयोगी निदेशात्मक जानकारी प्रदान करता है और उनकी स्वयं की खपत प्रवृत्ति को प्रतिबिंबित करता है। अतः इन्हें मुद्रास्फीति पर पारिवारिक इकाइयो की भावनाओं के रूप में माना जाना चाहिए। मुद्रास्फीति प्रत्याशाओं के सभी अनुमान मीडियन के रूप में दिए गए हैं, अन्यथा जब तक न कहा गया हो।