 IST,
IST,


Results of the Survey of Professional Forecasters on Macroeconomic Indicators - Round 39
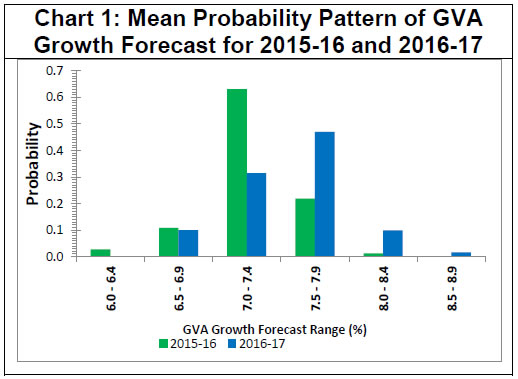
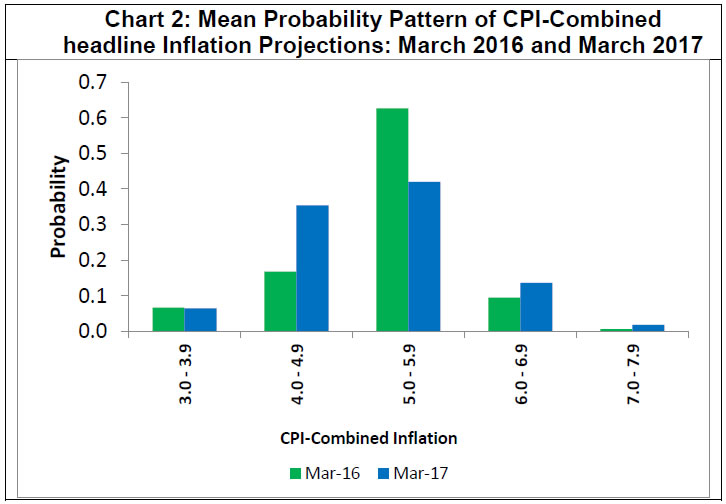
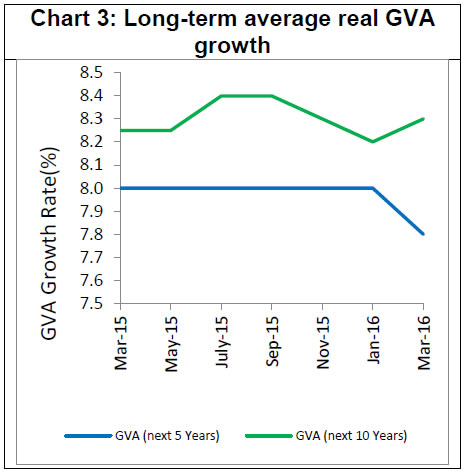
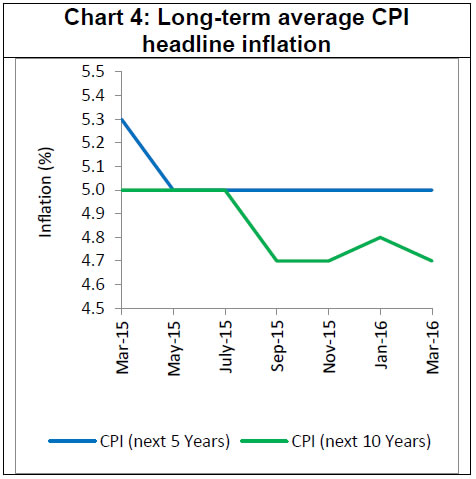
Output growth, measured using Gross Value Added at basic prices, is likely to improve marginally in 2015-16 and further in 2016-17. Quarterly growth projections for the next five quarters indicate that growth is likely to improve. CPI headline inflation is likely to remain in the range of 5.3 per cent to 5.5 per cent during FY: 2016-17. Medium term growth declined marginally and inflation expectations remained unchanged from the levels indicated in the last round of the survey. The Reserve Bank has been conducting the Survey of Professional Forecasters since September 2007. The results of the survey represent the views of the respondent forecasters and in no way reflect the views or forecasts of the Reserve Bank of India. Twenty Six professional forecasters participated in the latest survey round (Round 39) conducted in March 2016. The results of the survey are presented in the Annex in a tabular form. Highlights 1. Annual Forecasts (Median of forecasts of the respondents)
2. Quarterly Forecasts
3. Long Term Forecasts
1 Data for the previous survey round were released on February 5, 2016 on the RBI website. | ||||||||||||||||||||||||||||||||||||||||||||||||||||||||||||||||||||||||||||||||||||||||||||||||||||||||||||||||||||||||||||||||||||||||||||||||||||||||||||||||||||||||||||||||||||||||||||||||||||||||||||||||||||||||||||||||||||||||||||||||||||||||||||||||||||||||||||||||||||||||||||||||||||||||||||||||||||||||||||||||||||||||||||||||||||||||||||||||||||||||||||||||||||||||||||||||||||||||||||||||||||||||||||||||||||||||||||||||||||||||||||||||||||||||||||||||||||||||||||||||||||||||||||||||||||||||||||||||||||||||||||||||||||||||||||||||||||||||||||||||||||||||||||||||||||||||||||||||||||||||||||||||||||||||||||||||||||||||||||||||||||||||||||||||||||||||||||||||||||||||||||||||||||||||||||||||||||||||||||||||||||||||||||||||||||||||||||||||||||||||||||||||||||||||||||||||||||||||||||||||||||||||||||||||||||||||||||||||||||||||||||||||||||||||||||||||||||||||||||||||||||||||||||||||||||||||||||||||

इस पेज को शेयर करें:


आरबीआई मोबाइल एप्लीकेशन इंस्टॉल करें और लेटेस्ट न्यूज़ का तुरंत एक्सेस पाएं!
हमारा ऐप इंस्टॉल करने के लिए QR कोड स्कैन करें


पृष्ठ अंतिम बार अपडेट किया गया:


