 IST,
IST,


Results of the Survey of Professional Forecasters on Macroeconomic Indicators- Round 41
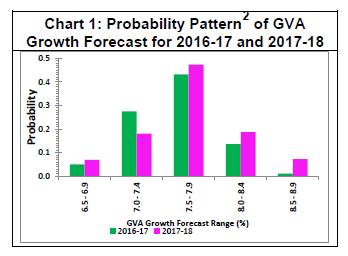
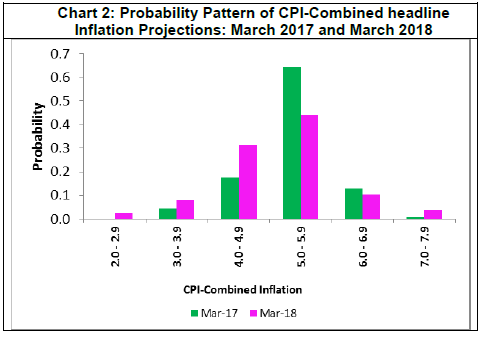
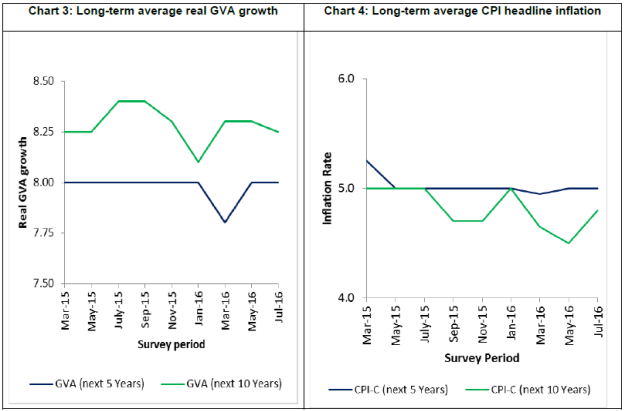
Output growth, measured using Gross Value Added at basic prices, is likely to improve gradually in 2016-17 and further in 2017-18. Quarterly growth projections for the next five quarters indicate that growth is likely to improve. CPI headline inflation is likely to come down at 5.1 per cent from Q3:2016-17. Medium term (5 years) growth expectation remained unchanged at 8 per cent and inflation forecast remained unchanged at 5 per cent as indicated in the last round of the survey. The Reserve Bank has been conducting the Survey of Professional Forecasters since September 2007. The results of the survey represent the views of the respondent forecasters and in no way reflect the views or forecasts of the Reserve Bank of India. Twenty Seven professional forecasters participated in the latest survey round (Round 41) conducted in July 2016. The results of the survey are presented in the Annex in a tabular form. Highlights 1. Annual Forecasts (Median of forecasts of the respondents)
2. Quarterly Forecasts
Variation observed in the forecast of the Indian Rupee ₹ against the US$ suggest Rupee to be volatile in the short-term. In terms of median of forecast, Indian Rupee is expected to move in the range of ₹ 67.88 to ₹ 68.75 per US$ till Q1:2017-18 (Annex Table A.3). 3. Long Term Forecasts
1 Data for the previous survey round were released on June 7, 2016 on the RBI website. 2 Forecasters were asked to assign probabilities in the fixed range | ||||||||||||||||||||||||||||||||||||||||||||||||||||||||||||||||||||||||||||||||||||||||||||||||||||||||||||||||||||||||||||||||||||||||||||||||||||||||||||||||||||||||||||||||||||||||||||||||||||||||||||||||||||||||||||||||||||||||||||||||||||||||||||||||||||||||||||||||||||||||||||||||||||||||||||||||||||||||||||||||||||||||||||||||||||||||||||||||||||||||||||||||||||||||||||||||||||||||||||||||||||||||||||||||||||||||||||||||||||||||||||||||||||||||||||||||||||||||||||||||||||||||||||||||||||||||||||||||||||||||||||||||||||||||||||||||||||||||||||||||||||||||||||||||||||||||||||||||||||||||||||||||||||||||||||||||||||||||||||||||||||||||||||||||||||||||||||||||||||||||||||||||||||||||||||||||||||||||||||||||||||||||||||||||||||||||||||||||||||||||||||||||||||||||||||||||||||||||||||||||||||||||||||||||||||||||||||||||||||||||||||||||||||||||||||||||||||||||||||||||||||||||||||||||||||||||||||||||

इस पेज को शेयर करें:


आरबीआई मोबाइल एप्लीकेशन इंस्टॉल करें और लेटेस्ट न्यूज़ का तुरंत एक्सेस पाएं!
हमारा ऐप इंस्टॉल करने के लिए QR कोड स्कैन करें


पृष्ठ अंतिम बार अपडेट किया गया:


