Today, the Reserve Bank released the results of the May 2022 round of the Inflation Expectations Survey of Households (IESH)1 2. The survey was conducted during May 2 to 11, 2022 in 19 major cities. The results are based on responses from 6,062 urban households. In view of the cut in the prices of petrol and diesel on May 21, 2022, a limited follow-up survey (hereinafter called the ‘extension survey’) was conducted during May 24-28, 2022, which covered around half of the households who had responded in the regular survey round. In all, 3,036 households gave their revised expectations of inflation (quantitative) in the extension survey. Highlights: A. Regular survey round -
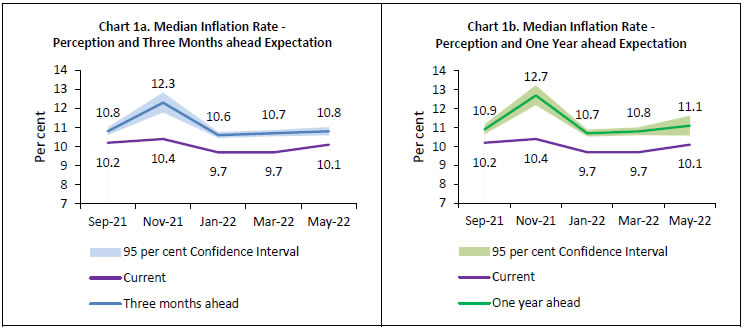
Households’ median inflation perception for the current period increased by 40 basis points (bps) when compared to March 2022 round of the survey, whereas it increased by 10 bps and 30 bps for three months and one year ahead periods, respectively [Charts 1a and 1b; Table 3]. -
Majority of the households expect general prices and inflation to remain high over three months and one year ahead horizons [Table 1a and 1b]. -
Expectations for overall price and inflation over next one year were in sync with those for non-food products and cost of services, while three months ahead expectations were generally more aligned to those for food products and non-food commodities [Table 4]. Note: Please see the excel file for time series data3. B. Extension survey In the extension survey round, inflation expectations for three months and one year ahead declined by 190 bps and 90 bps, respectively, when compared with the regular round (Table A below). | Table A: Median Inflation expectations: Regular vs. Extension round | | (in per cent) | | Sr. No. | Round Description | No. of Respondents | 3M Ahead Expectation | 1Y Ahead Expectation | | 1 | Regular survey round
(May 2-11, 2022) | 6,062 | 10.8 | 11.1 | | 2 | Common Respondents
(Regular and Extension rounds) | 3,036 | 10.8 | 11.0 | | 3 | Extension Round
(May 24-28, 2022) | 8.9 | 10.1 |
| Table 1(a): Product-wise Expectations of Prices for Three Months ahead | | (Percentage of Respondents) | | Survey period ended | May-21 | Nov-21 | Jan-22 | Mar-22 | May-22 | | General | Estimate | SE | Estimate | SE | Estimate | SE | Estimate | SE | Estimate | SE | | Prices will increase | 83.7 | 0.68 | 89.3 | 0.64 | 85.6 | 0.68 | 89.9 | 0.64 | 88.5 | 0.69 | | Price increase more than current rate | 58.3 | 0.91 | 66.9 | 1.16 | 61.4 | 1.07 | 67.2 | 1.27 | 66.1 | 1.10 | | Price increase similar to current rate | 21.3 | 0.76 | 19.2 | 0.94 | 20.5 | 0.87 | 19.3 | 0.96 | 18.9 | 0.83 | | Price increase less than current rate | 4.0 | 0.37 | 3.3 | 0.41 | 3.7 | 0.40 | 3.5 | 0.45 | 3.5 | 0.37 | | No changes in prices | 14.0 | 0.63 | 8.2 | 0.55 | 12.0 | 0.64 | 8.6 | 0.59 | 9.1 | 0.62 | | Decline in prices | 2.3 | 0.30 | 2.5 | 0.30 | 2.4 | 0.30 | 1.5 | 0.22 | 2.3 | 0.32 | | Food Product | | | | | | | | | | | | Prices will increase | 84.4 | 0.71 | 86.0 | 0.70 | 83.7 | 0.71 | 89.6 | 0.62 | 88.4 | 0.66 | | Price increase more than current rate | 60.0 | 0.92 | 63.6 | 1.16 | 61.0 | 1.01 | 68.2 | 1.14 | 65.6 | 1.04 | | Price increase similar to current rate | 19.6 | 0.74 | 17.2 | 0.82 | 17.0 | 0.78 | 16.2 | 0.88 | 17.4 | 0.78 | | Price increase less than current rate | 4.8 | 0.38 | 5.2 | 0.46 | 5.7 | 0.47 | 5.2 | 0.48 | 5.4 | 0.44 | | No changes in prices | 11.7 | 0.62 | 8.2 | 0.51 | 10.5 | 0.58 | 6.9 | 0.51 | 7.1 | 0.51 | | Decline in prices | 3.9 | 0.38 | 5.9 | 0.46 | 5.8 | 0.45 | 3.5 | 0.36 | 4.5 | 0.43 | | Non- Food Product | | | | | | | | | | | | Prices will increase | 78.6 | 0.78 | 86.3 | 0.67 | 80.4 | 0.73 | 88.4 | 0.63 | 87.5 | 0.70 | | Price increase more than current rate | 53.0 | 0.94 | 62.5 | 1.17 | 55.4 | 1.02 | 65.6 | 1.17 | 64.5 | 1.05 | | Price increase similar to current rate | 20.0 | 0.75 | 18.8 | 0.85 | 19.4 | 0.80 | 17.6 | 0.87 | 17.9 | 0.79 | | Price increase less than current rate | 5.6 | 0.44 | 4.9 | 0.48 | 5.6 | 0.46 | 5.2 | 0.49 | 5.1 | 0.44 | | No changes in prices | 17.1 | 0.71 | 8.9 | 0.54 | 14.1 | 0.64 | 8.7 | 0.56 | 8.2 | 0.54 | | Decline in prices | 4.3 | 0.42 | 4.8 | 0.43 | 5.4 | 0.43 | 2.9 | 0.31 | 4.2 | 0.43 | | Household Durables | | | | | | | | | | | | Prices will increase | 58.8 | 0.96 | 68.6 | 0.90 | 69.9 | 0.88 | 73.5 | 0.89 | 74.7 | 0.93 | | Price increase more than current rate | 37.6 | 0.93 | 47.7 | 1.11 | 48.6 | 1.03 | 51.9 | 1.20 | 53.4 | 1.13 | | Price increase similar to current rate | 16.5 | 0.70 | 16.0 | 0.77 | 16.2 | 0.70 | 16.0 | 0.83 | 16.3 | 0.78 | | Price increase less than current rate | 4.6 | 0.40 | 4.9 | 0.44 | 5.1 | 0.45 | 5.5 | 0.50 | 5.1 | 0.42 | | No changes in prices | 32.3 | 0.90 | 22.7 | 0.82 | 23.1 | 0.82 | 20.4 | 0.83 | 19.7 | 0.82 | | Decline in prices | 9.0 | 0.56 | 8.7 | 0.54 | 7.0 | 0.45 | 6.1 | 0.44 | 5.5 | 0.44 | | Cost of Housing | | | | | | | | | | | | Prices will increase | 54.9 | 0.94 | 74.3 | 0.94 | 71.5 | 0.88 | 75.8 | 0.94 | 78.5 | 0.90 | | Price increase more than current rate | 36.4 | 0.92 | 55.1 | 1.16 | 51.3 | 1.07 | 54.9 | 1.23 | 59.4 | 1.11 | | Price increase similar to current rate | 14.6 | 0.67 | 15.6 | 0.78 | 16.1 | 0.74 | 16.6 | 0.80 | 15.4 | 0.73 | | Price increase less than current rate | 3.9 | 0.36 | 3.7 | 0.39 | 4.2 | 0.42 | 4.3 | 0.40 | 3.7 | 0.35 | | No changes in prices | 30.6 | 0.88 | 19.0 | 0.82 | 21.3 | 0.80 | 18.9 | 0.86 | 17.1 | 0.82 | | Decline in prices | 14.6 | 0.68 | 6.7 | 0.50 | 7.2 | 0.48 | 5.4 | 0.46 | 4.3 | 0.40 | | Cost of Services | | | | | | | | | | | | Prices will increase | 67.7 | 0.89 | 76.5 | 0.86 | 74.3 | 0.83 | 76.3 | 0.88 | 78.5 | 0.88 | | Price increase more than current rate | 44.5 | 0.93 | 53.9 | 1.19 | 51.6 | 1.05 | 54.5 | 1.19 | 56.4 | 1.09 | | Price increase similar to current rate | 18.2 | 0.71 | 17.6 | 0.80 | 18.0 | 0.79 | 16.8 | 0.80 | 17.4 | 0.71 | | Price increase less than current rate | 4.9 | 0.40 | 5.0 | 0.49 | 4.6 | 0.43 | 5.0 | 0.47 | 4.8 | 0.42 | | No changes in prices | 29.2 | 0.86 | 20.2 | 0.80 | 22.3 | 0.78 | 21.2 | 0.86 | 18.6 | 0.82 | | Decline in prices | 3.2 | 0.35 | 3.3 | 0.34 | 3.4 | 0.34 | 2.4 | 0.29 | 2.8 | 0.32 | | Note: | | 1. The table provides estimates and standard errors for qualitative responses. | | 2. Constituent items may not add up to the corresponding total, due to rounding off. |
| Table 1(b): Product-wise Expectations of Prices for One Year ahead | | (Percentage of Respondents) | | Survey period ended | May-21 | Nov-21 | Jan-22 | Mar-22 | May-22 | | General | Estimate | SE | Estimate | SE | Estimate | SE | Estimate | SE | Estimate | SE | | Prices will increase | 86.9 | 0.65 | 90.4 | 0.59 | 89.6 | 0.58 | 91.5 | 0.58 | 91.3 | 0.60 | | Price increase more than current rate | 62.3 | 0.91 | 70.5 | 1.15 | 68.2 | 1.05 | 71.0 | 1.19 | 70.8 | 1.07 | | Price increase similar to current rate | 20.3 | 0.75 | 16.7 | 0.91 | 18.1 | 0.81 | 17.4 | 0.93 | 17.3 | 0.82 | | Price increase less than current rate | 4.2 | 0.38 | 3.3 | 0.39 | 3.3 | 0.39 | 3.1 | 0.41 | 3.1 | 0.36 | | No changes in prices | 10.4 | 0.58 | 6.4 | 0.46 | 7.8 | 0.50 | 6.1 | 0.48 | 5.8 | 0.47 | | Decline in prices | 2.7 | 0.33 | 3.1 | 0.35 | 2.6 | 0.29 | 2.4 | 0.29 | 2.8 | 0.36 | | Food Product | | | | | | | | | | | | Prices will increase | 81.7 | 0.75 | 84.5 | 0.74 | 83.8 | 0.71 | 85.3 | 0.72 | 86.7 | 0.72 | | Price increase more than current rate | 53.4 | 0.95 | 60.2 | 1.20 | 58.2 | 1.06 | 60.9 | 1.19 | 62.8 | 1.10 | | Price increase similar to current rate | 22.7 | 0.76 | 19.9 | 0.92 | 20.4 | 0.86 | 19.6 | 0.91 | 19.2 | 0.82 | | Price increase less than current rate | 5.5 | 0.43 | 4.4 | 0.42 | 5.2 | 0.45 | 4.8 | 0.47 | 4.7 | 0.41 | | No changes in prices | 12.5 | 0.64 | 9.4 | 0.57 | 10.9 | 0.61 | 9.8 | 0.59 | 8.1 | 0.52 | | Decline in prices | 5.8 | 0.46 | 6.1 | 0.47 | 5.3 | 0.40 | 5.0 | 0.41 | 5.2 | 0.48 | | Non- Food Product | | | | | | | | | | | | Prices will increase | 79.2 | 0.78 | 85.1 | 0.72 | 82.9 | 0.72 | 85.8 | 0.73 | 87.0 | 0.72 | | Price increase more than current rate | 51.6 | 0.95 | 61.7 | 1.20 | 57.5 | 1.09 | 62.4 | 1.18 | 63.7 | 1.09 | | Price increase similar to current rate | 21.9 | 0.75 | 19.0 | 0.87 | 20.5 | 0.86 | 18.9 | 0.89 | 19.1 | 0.82 | | Price increase less than current rate | 5.6 | 0.44 | 4.4 | 0.45 | 4.9 | 0.44 | 4.5 | 0.44 | 4.3 | 0.40 | | No changes in prices | 15.8 | 0.69 | 9.5 | 0.56 | 12.0 | 0.61 | 9.7 | 0.60 | 8.2 | 0.54 | | Decline in prices | 5.0 | 0.44 | 5.4 | 0.43 | 5.0 | 0.41 | 4.5 | 0.40 | 4.7 | 0.47 | | Household Durables | | | | | | | | | | | | Prices will increase | 64.8 | 0.94 | 75.0 | 0.87 | 75.4 | 0.87 | 77.3 | 0.84 | 78.7 | 0.84 | | Price increase more than current rate | 41.1 | 0.94 | 52.3 | 1.16 | 52.1 | 1.07 | 54.1 | 1.16 | 56.4 | 1.09 | | Price increase similar to current rate | 18.7 | 0.72 | 18.2 | 0.85 | 18.7 | 0.81 | 18.3 | 0.89 | 17.4 | 0.75 | | Price increase less than current rate | 4.9 | 0.39 | 4.5 | 0.45 | 4.6 | 0.45 | 4.8 | 0.48 | 4.9 | 0.42 | | No changes in prices | 26.7 | 0.86 | 18.0 | 0.75 | 18.5 | 0.77 | 17.1 | 0.74 | 15.9 | 0.72 | | Decline in prices | 8.5 | 0.55 | 7.0 | 0.48 | 6.1 | 0.44 | 5.6 | 0.43 | 5.3 | 0.46 | | Cost of Housing | | | | | | | | | | | | Prices will increase | 65.4 | 0.92 | 82.4 | 0.77 | 79.3 | 0.78 | 83.1 | 0.75 | 85.3 | 0.72 | | Price increase more than current rate | 43.4 | 0.96 | 60.6 | 1.15 | 57.0 | 1.03 | 61.1 | 1.17 | 64.2 | 1.07 | | Price increase similar to current rate | 17.6 | 0.71 | 17.9 | 0.86 | 18.1 | 0.78 | 17.6 | 0.88 | 17.2 | 0.77 | | Price increase less than current rate | 4.5 | 0.39 | 3.9 | 0.40 | 4.2 | 0.43 | 4.5 | 0.43 | 4.0 | 0.38 | | No changes in prices | 23.4 | 0.83 | 12.8 | 0.67 | 15.1 | 0.66 | 13.2 | 0.67 | 10.5 | 0.60 | | Decline in prices | 11.2 | 0.62 | 4.9 | 0.41 | 5.6 | 0.43 | 3.7 | 0.36 | 4.1 | 0.40 | | Cost of Services | | | | | | | | | | | | Prices will increase | 76.5 | 0.81 | 83.6 | 0.73 | 82.0 | 0.75 | 83.0 | 0.79 | 84.9 | 0.78 | | Price increase more than current rate | 49.9 | 0.94 | 59.5 | 1.20 | 57.5 | 1.04 | 59.2 | 1.25 | 62.2 | 1.10 | | Price increase similar to current rate | 21.4 | 0.75 | 19.1 | 0.88 | 19.8 | 0.81 | 18.8 | 0.93 | 17.8 | 0.78 | | Price increase less than current rate | 5.2 | 0.42 | 5.0 | 0.46 | 4.6 | 0.44 | 5.0 | 0.47 | 4.9 | 0.42 | | No changes in prices | 20.1 | 0.76 | 13.3 | 0.65 | 15.1 | 0.68 | 14.1 | 0.71 | 12.0 | 0.67 | | Decline in prices | 3.4 | 0.36 | 3.1 | 0.34 | 3.0 | 0.31 | 3.0 | 0.32 | 3.0 | 0.38 | | Note: | | 1. The table provides estimates and standard errors for qualitative responses. | | 2. Constituent items may not add up to the corresponding total, due to rounding off. |
| Table 2: Inflation Expectations of Various Groups: May-22 | | | Current Perception | Three Months ahead Expectation | One Year ahead Expectation | | Mean | Median | Mean | Median | Mean | Median | | Estimate | SE | Estimate | SE | Estimate | SE | Estimate | SE | Estimate | SE | Estimate | SE | | Overall | 10.3 | 0.11 | 10.1 | 0.08 | 11.4 | 0.11 | 10.8 | 0.11 | 11.1 | 0.12 | 11.1 | 0.27 | | Gender-wise | | | | | | | | | | | | | | Male | 10.7 | 0.14 | 10.3 | 0.08 | 11.6 | 0.14 | 11.2 | 0.40 | 11.4 | 0.16 | 11.8 | 0.49 | | Female | 10.0 | 0.15 | 9.9 | 0.23 | 11.2 | 0.15 | 10.8 | 0.14 | 10.9 | 0.17 | 10.9 | 0.25 | | Category-wise | | | | | | | | | | | | | | Financial Sector Employees | 10.4 | 0.67 | 9.8 | 0.87 | 11.3 | 0.75 | 11.3 | 1.33 | 11.2 | 0.90 | 11.4 | 1.64 | | Other Employees | 10.4 | 0.19 | 10.2 | 0.11 | 11.6 | 0.18 | 11.2 | 0.38 | 11.5 | 0.21 | 12.2 | 0.47 | | Self Employed | 10.9 | 0.21 | 10.4 | 0.11 | 11.8 | 0.20 | 11.8 | 0.63 | 11.5 | 0.24 | 12.0 | 0.72 | | Homemaker | 9.9 | 0.18 | 9.8 | 0.26 | 11.1 | 0.17 | 10.7 | 0.13 | 10.9 | 0.20 | 10.8 | 0.20 | | Retired Persons | 10.9 | 0.42 | 10.6 | 0.29 | 11.5 | 0.41 | 12.0 | 1.10 | 11.6 | 0.43 | 12.8 | 1.48 | | Daily Workers | 10.6 | 0.27 | 10.2 | 0.17 | 11.6 | 0.26 | 11.3 | 0.60 | 11.1 | 0.33 | 11.7 | 0.73 | | Other category | 9.7 | 0.23 | 9.0 | 0.40 | 10.8 | 0.23 | 10.5 | 0.20 | 10.6 | 0.29 | 10.6 | 0.29 | | Age Group-wise | | | | | | | | | | | | | | Up to 25 years | 9.6 | 0.20 | 9.1 | 0.29 | 10.9 | 0.19 | 10.5 | 0.14 | 10.8 | 0.22 | 10.7 | 0.22 | | 25 to 30 years | 10.0 | 0.20 | 10.0 | 0.21 | 11.3 | 0.20 | 10.8 | 0.20 | 11.3 | 0.23 | 11.4 | 0.57 | | 30 to 35 years | 10.2 | 0.22 | 9.9 | 0.28 | 11.3 | 0.21 | 10.8 | 0.26 | 11.0 | 0.25 | 11.0 | 0.36 | | 35 to 40 years | 10.4 | 0.21 | 10.2 | 0.15 | 11.4 | 0.20 | 10.9 | 0.29 | 11.0 | 0.25 | 11.2 | 0.46 | | 40 to 45 years | 10.2 | 0.25 | 9.8 | 0.44 | 11.3 | 0.25 | 10.8 | 0.42 | 10.8 | 0.29 | 10.7 | 0.35 | | 45 to 50 years | 10.8 | 0.24 | 10.4 | 0.13 | 11.8 | 0.23 | 11.6 | 0.79 | 11.1 | 0.30 | 11.5 | 0.69 | | 50 to 55 years | 10.6 | 0.27 | 10.3 | 0.17 | 11.8 | 0.26 | 11.6 | 0.70 | 11.4 | 0.33 | 12.2 | 0.87 | | 55 to 60 years | 11.3 | 0.32 | 10.6 | 0.16 | 12.1 | 0.31 | 13.2 | 1.14 | 11.3 | 0.40 | 12.5 | 1.04 | | 60 years and above | 11.1 | 0.32 | 10.6 | 0.32 | 11.9 | 0.32 | 12.9 | 1.24 | 11.5 | 0.36 | 13.3 | 1.24 | | City-wise | | | | | | | | | | | | | | Ahmedabad | 8.6 | 0.49 | 6.9 | 0.62 | 9.8 | 0.52 | 8.1 | 0.76 | 10.0 | 0.51 | 9.0 | 0.91 | | Bengaluru | 10.6 | 0.31 | 10.5 | 0.13 | 11.7 | 0.32 | 13.1 | 1.26 | 11.6 | 0.41 | 14.5 | 1.02 | | Bhopal | 8.7 | 1.12 | 7.7 | 1.59 | 9.7 | 1.04 | 9.4 | 1.12 | 9.3 | 0.83 | 9.5 | 0.97 | | Bhubaneswar | 8.6 | 0.52 | 8.4 | 1.11 | 10.6 | 0.58 | 10.1 | 1.19 | 11.1 | 0.56 | 10.9 | 0.88 | | Chennai | 10.9 | 0.40 | 10.5 | 0.20 | 12.4 | 0.35 | 13.3 | 1.18 | 12.4 | 0.35 | 15.1 | 0.71 | | Delhi | 10.4 | 0.24 | 10.2 | 0.19 | 11.6 | 0.24 | 11.2 | 0.63 | 11.4 | 0.26 | 11.4 | 0.75 | | Guwahati | 6.6 | 0.31 | 6.1 | 0.40 | 7.3 | 0.50 | 6.8 | 0.60 | 7.5 | 0.66 | 7.4 | 0.45 | | Hyderabad | 11.4 | 0.59 | 10.9 | 1.10 | 12.6 | 0.47 | 13.7 | 1.68 | 11.7 | 0.57 | 13.8 | 1.61 | | Jaipur | 10.8 | 0.61 | 10.3 | 0.49 | 11.3 | 0.60 | 11.1 | 0.75 | 11.0 | 0.63 | 11.1 | 0.77 | | Jammu | 11.7 | 1.11 | 12.1 | 2.18 | 13.1 | 0.87 | 14.9 | 1.45 | 12.3 | 0.88 | 14.6 | 1.65 | | Kolkata | 10.6 | 0.33 | 10.2 | 0.28 | 11.8 | 0.29 | 11.4 | 0.74 | 11.5 | 0.28 | 11.6 | 0.79 | | Lucknow | 11.2 | 0.74 | 11.0 | 1.45 | 11.6 | 0.76 | 12.4 | 1.86 | 11.5 | 0.89 | 13.1 | 2.05 | | Mumbai | 10.0 | 0.23 | 9.4 | 0.32 | 11.1 | 0.24 | 10.6 | 0.25 | 10.5 | 0.29 | 10.7 | 0.32 | | Nagpur | 10.8 | 0.70 | 10.4 | 0.49 | 12.3 | 0.76 | 13.6 | 1.72 | 11.2 | 1.11 | 13.5 | 1.98 | | Patna | 9.8 | 0.59 | 9.1 | 0.80 | 10.6 | 0.60 | 9.8 | 0.92 | 10.5 | 0.64 | 10.0 | 0.77 | | Thiruvananthapuram | 7.4 | 0.55 | 5.8 | 0.29 | 9.1 | 0.52 | 8.2 | 0.69 | 10.1 | 0.54 | 9.7 | 0.72 | | Chandigarh | 11.3 | 0.52 | 10.3 | 0.87 | 12.0 | 0.51 | 11.7 | 1.20 | 11.5 | 0.60 | 11.4 | 1.02 | | Ranchi | 6.8 | 0.22 | 6.5 | 0.28 | 7.3 | 0.26 | 7.0 | 0.34 | 7.2 | 0.36 | 7.7 | 0.52 | | Raipur | 7.9 | 0.46 | 7.7 | 0.77 | 8.6 | 0.62 | 8.5 | 1.18 | 9.7 | 1.06 | 10.5 | 2.07 | | Note: The table provides estimates and standard errors for quantitative responses. |
| Table 3: Household Inflation Expectations – Current Perception, Three Months and One Year Ahead Expectations | | | Current Perception | Three Months ahead Expectation | One Year ahead Expectation | | Mean | Median | Mean | Median | Mean | Median | | Estimate | SE | Estimate | SE | Estimate | SE | Estimate | SE | Estimate | SE | Estimate | SE | | May-21 | 10.4 | 0.09 | 10.2 | 0.04 | 11.3 | 0.09 | 10.8 | 0.07 | 10.7 | 0.11 | 10.8 | 0.09 | | Nov-21 | 10.7 | 0.11 | 10.4 | 0.05 | 11.9 | 0.11 | 12.3 | 0.27 | 11.5 | 0.12 | 12.7 | 0.27 | | Jan-22 | 9.9 | 0.10 | 9.7 | 0.28 | 11.1 | 0.10 | 10.6 | 0.08 | 10.7 | 0.11 | 10.7 | 0.09 | | Mar-22 | 9.8 | 0.12 | 9.7 | 0.31 | 11.1 | 0.12 | 10.7 | 0.09 | 10.9 | 0.13 | 10.8 | 0.11 | | May-22 | 10.3 | 0.11 | 10.1 | 0.08 | 11.4 | 0.11 | 10.8 | 0.11 | 11.1 | 0.12 | 11.1 | 0.27 | | Note: The table provides estimates and standard errors for quantitative responses. |
| Table 4: Households Expecting General Price Movements in Coherence with Movements in Price Expectations of Various Product Groups: Three Months Ahead and One Year Ahead | | (Percentage of Respondents) | | Survey period ended | Food | Non-Food | Household durables | Housing | Cost of services | | Three Months Ahead | | May-21 | 68.2 | 65.3 | 51.8 | 50.3 | 60.6 | | Nov-21 | 69.8 | 70.5 | 59.0 | 63.4 | 65.7 | | Jan-22 | 66.8 | 65.8 | 60.5 | 61.7 | 66.0 | | Mar-22 | 70.5 | 70.8 | 60.2 | 62.0 | 65.8 | | May-22 | 70.8 | 71.3 | 64.0 | 66.6 | 69.3 | | One Year Ahead | | May-21 | 68.2 | 67.1 | 57.7 | 57.1 | 67.3 | | Nov-21 | 73.8 | 74.8 | 66.2 | 70.4 | 73.2 | | Jan-22 | 71.7 | 72.4 | 65.2 | 67.5 | 72.9 | | Mar-22 | 73.1 | 74.2 | 67.5 | 69.4 | 74.4 | | May-22 | 75.6 | 76.6 | 69.8 | 73.4 | 76.2 | | Note: Figures are based on sample observations |
| Table 5(a): Cross-tabulation of Number of Respondents by Current Inflation Perception and Three Months Ahead Inflation Expectations: May-22 | | Three Months Ahead Inflation Rate (per cent) | | Current Inflation Rate (per cent) | | <1 | 1-<2 | 2-<3 | 3-<4 | 4-<5 | 5-<6 | 6-<7 | 7-<8 | 8-<9 | 9-<10 | 10-<11 | 11-<12 | 12-<13 | 13-<14 | 14-<15 | 15-<16 | >=16 | No idea | Total | | <1 | 5 | 0 | 1 | 1 | 0 | 1 | 0 | 1 | 0 | 0 | 0 | 0 | 0 | 0 | 0 | 0 | 0 | 0 | 9 | | 1-<2 | 0 | 12 | 16 | 5 | 1 | 0 | 0 | 0 | 0 | 0 | 0 | 0 | 0 | 0 | 0 | 0 | 0 | 0 | 34 | | 2-<3 | 0 | 8 | 49 | 44 | 22 | 11 | 0 | 1 | 0 | 0 | 2 | 0 | 0 | 0 | 0 | 0 | 0 | 0 | 137 | | 3-<4 | 0 | 1 | 12 | 51 | 50 | 47 | 11 | 1 | 3 | 0 | 0 | 0 | 0 | 1 | 0 | 0 | 0 | 0 | 177 | | 4-<5 | 0 | 4 | 8 | 4 | 82 | 69 | 45 | 16 | 8 | 2 | 1 | 0 | 1 | 0 | 1 | 0 | 0 | 1 | 242 | | 5-<6 | 1 | 4 | 7 | 24 | 23 | 278 | 155 | 189 | 78 | 15 | 130 | 2 | 2 | 1 | 0 | 10 | 2 | 0 | 921 | | 6-<7 | 0 | 0 | 1 | 0 | 7 | 8 | 108 | 104 | 70 | 15 | 17 | 3 | 5 | 1 | 2 | 0 | 1 | 0 | 342 | | 7-<8 | 0 | 0 | 1 | 3 | 0 | 7 | 2 | 135 | 89 | 46 | 68 | 7 | 3 | 0 | 3 | 4 | 1 | 0 | 369 | | 8-<9 | 0 | 0 | 2 | 1 | 1 | 4 | 6 | 4 | 152 | 83 | 134 | 13 | 17 | 7 | 5 | 4 | 4 | 0 | 437 | | 9-<10 | 0 | 1 | 0 | 0 | 1 | 2 | 1 | 7 | 6 | 84 | 74 | 51 | 25 | 8 | 3 | 8 | 4 | 0 | 275 | | 10-<11 | 0 | 1 | 1 | 2 | 1 | 18 | 2 | 10 | 17 | 5 | 319 | 70 | 176 | 65 | 26 | 262 | 148 | 1 | 1124 | | 11-<12 | 0 | 0 | 0 | 0 | 0 | 0 | 1 | 0 | 0 | 1 | 0 | 26 | 12 | 5 | 1 | 4 | 5 | 0 | 55 | | 12-<13 | 0 | 0 | 0 | 0 | 0 | 0 | 0 | 0 | 0 | 0 | 2 | 0 | 41 | 11 | 23 | 24 | 10 | 0 | 111 | | 13-<14 | 0 | 0 | 0 | 0 | 0 | 0 | 0 | 1 | 1 | 0 | 0 | 0 | 1 | 7 | 7 | 9 | 6 | 0 | 32 | | 14-<15 | 0 | 0 | 0 | 0 | 0 | 0 | 0 | 0 | 0 | 0 | 0 | 0 | 0 | 0 | 8 | 13 | 19 | 0 | 40 | | 15-<16 | 0 | 0 | 0 | 0 | 0 | 2 | 2 | 1 | 1 | 0 | 6 | 1 | 0 | 2 | 1 | 85 | 233 | 0 | 334 | | >=16 | 0 | 1 | 0 | 0 | 0 | 7 | 1 | 1 | 0 | 0 | 24 | 0 | 2 | 1 | 1 | 12 | 1366 | 7 | 1423 | | Total | 6 | 32 | 98 | 135 | 188 | 454 | 334 | 471 | 425 | 251 | 777 | 173 | 285 | 109 | 81 | 435 | 1799 | 9 | 6062 | | Note: Figures are based on sample observations |
| Table 5(b): Cross-tabulation of Number of Respondents by Current Inflation Perception and One Year Ahead Inflation Expectations: May-22 | | One Year Ahead Inflation Rate (per cent) | | Current Inflation Rate (per cent) | | <1 | 1-<2 | 2-<3 | 3-<4 | 4-<5 | 5-<6 | 6-<7 | 7-<8 | 8-<9 | 9-<10 | 10-<11 | 11-<12 | 12-<13 | 13-<14 | 14-<15 | 15-<16 | >=16 | No idea | Total | | <1 | 3 | 0 | 1 | 0 | 0 | 4 | 0 | 0 | 0 | 0 | 0 | 1 | 0 | 0 | 0 | 0 | 0 | 0 | 9 | | 1-<2 | 8 | 4 | 11 | 5 | 2 | 3 | 1 | 0 | 0 | 0 | 0 | 0 | 0 | 0 | 0 | 0 | 0 | 0 | 34 | | 2-<3 | 19 | 5 | 29 | 28 | 30 | 15 | 3 | 3 | 1 | 0 | 4 | 0 | 0 | 0 | 0 | 0 | 0 | 0 | 137 | | 3-<4 | 12 | 1 | 5 | 32 | 28 | 47 | 22 | 9 | 9 | 5 | 4 | 0 | 1 | 0 | 0 | 1 | 1 | 0 | 177 | | 4-<5 | 25 | 1 | 2 | 1 | 47 | 44 | 51 | 29 | 21 | 6 | 6 | 0 | 4 | 1 | 2 | 0 | 2 | 0 | 242 | | 5-<6 | 90 | 0 | 2 | 7 | 16 | 179 | 88 | 163 | 100 | 30 | 167 | 6 | 14 | 7 | 4 | 31 | 15 | 2 | 921 | | 6-<7 | 30 | 0 | 0 | 1 | 1 | 4 | 67 | 87 | 71 | 22 | 28 | 8 | 9 | 1 | 2 | 3 | 8 | 0 | 342 | | 7-<8 | 30 | 0 | 0 | 0 | 2 | 0 | 2 | 78 | 62 | 64 | 80 | 10 | 13 | 3 | 5 | 12 | 8 | 0 | 369 | | 8-<9 | 36 | 0 | 0 | 1 | 2 | 2 | 4 | 1 | 93 | 59 | 145 | 17 | 35 | 7 | 7 | 15 | 13 | 0 | 437 | | 9-<10 | 22 | 0 | 0 | 0 | 0 | 1 | 1 | 3 | 6 | 57 | 58 | 44 | 43 | 6 | 10 | 12 | 12 | 0 | 275 | | 10-<11 | 83 | 0 | 0 | 1 | 0 | 9 | 3 | 7 | 9 | 5 | 215 | 39 | 119 | 57 | 30 | 261 | 284 | 2 | 1124 | | 11-<12 | 7 | 0 | 0 | 0 | 0 | 0 | 0 | 0 | 0 | 0 | 1 | 14 | 13 | 4 | 2 | 8 | 6 | 0 | 55 | | 12-<13 | 10 | 0 | 0 | 0 | 0 | 0 | 0 | 0 | 0 | 0 | 2 | 0 | 23 | 8 | 20 | 20 | 28 | 0 | 111 | | 13-<14 | 3 | 0 | 0 | 0 | 0 | 0 | 0 | 0 | 1 | 0 | 0 | 0 | 1 | 1 | 6 | 9 | 11 | 0 | 32 | | 14-<15 | 2 | 0 | 0 | 0 | 0 | 0 | 0 | 0 | 0 | 0 | 0 | 0 | 0 | 1 | 4 | 11 | 22 | 0 | 40 | | 15-<16 | 29 | 0 | 0 | 0 | 0 | 0 | 0 | 0 | 1 | 0 | 5 | 0 | 1 | 1 | 0 | 57 | 240 | 0 | 334 | | >=16 | 122 | 0 | 0 | 0 | 0 | 1 | 0 | 0 | 0 | 0 | 13 | 1 | 2 | 0 | 0 | 10 | 1270 | 4 | 1423 | | Total | 531 | 11 | 50 | 76 | 128 | 309 | 242 | 380 | 374 | 248 | 728 | 140 | 278 | 97 | 92 | 450 | 1920 | 8 | 6062 | | Note: Figures are based on sample observations |
|
 IST,
IST,