The
macro overview of municipal finance in India, attempted in the preceding chapter,
brought out the significance of municipal finance for the overall financial well-being
of the economy and provided an insight into the sources, structure, composition
and trends of aggregate revenue and expenditure of the MCs in metropolitan cities
in India. It should be noted that many of the conclusions drawn at aggregate level
above may not hold good for individual ULBs and may not throw enough light on
the constraints faced by individual local bodies and the need for requisite policy
initiatives to address them. Therefore, the present chapter examines the financial
parameters of individual municipal bodies, to assess their ability to provide
the required civic amenities and to identify the constraints faced by them. 5.2
Analytical Framework
Fiscal assessment of any entity is generally
based on revenue and fiscal balance. Similarly, to assess qualitative aspects,
the ratio of revenue expenditure to total expenditure is considered. Any entity
generating surplus in revenue account (and if possible, in capital account) and
maintaining low proportion of revenue expenditure to total expenditure, is considered
to have sound financial health. However, this “standard approach”
for making assessment may not hold for the ULBs. Municipal authorities are constrained
by statutory mandates of balanced budgets4 and they are also notgranted liberal
permission by State Governments to incur debt [Mathur and Thakur (2004)] . However,
revenue expenditure is not undesirable, if a good proportion of this goes for
operation and maintenance of civic amenities provided by the ULBs. With
the above in the background, the assessment of ULBs needs to proceed on a different
track, making use of an alternate set of parameters. These parameters are normative
benchmarks which define the minimum level of expenditure that the ULBs are required
to incur, in order to ensure a minimum standard of living to the inhabitants.
A set of expenditure benchmarks, both for creating new assets, and for their maintenance
were derived by the Zakaria Committee in 1964 for core urban services. These expenditure
norms for service provision (capital) as well as operation & maintenance (O&M)
are for the cities that are divided into categories AA, A, B, C, D and E, based
on the population size. The expenditure norms for 5 core civic activities viz.,
water supply, roads, storm water drainage, sewerage and street lighting for 3
major city classes covered by this study (at the 1996-97 prices) are shown in
Table 25.
A comparison of municipal spending with these norms, after revising
them to the current period, would reveal the level of underspending by the ULBs.
There are a host of factors which could be responsible for the level of under-spending,
which can be divided into two broad categories. - exogenous and endogenous.
As the terms
Table
25: Zakaria Committee Norms of Expenditure on Services |
(Rupees
per capita at 1996-97 prices) | City
Class | Water
Supply | Sewerage | Storm
Drainage | Roads | Street
Lights | Capital | O
& M | Capital | O
& M | Capital | O
& M | Capital | O
& M | Capital | O
& M | AA | 968 | 161 | 1117 | 182 | 611 | - | 1207 | 37 | 447 | 45 |
A | 700 | 152 | 968 | 177 | 432 | - | 1043 | 33 | 372 | 42 |
B | 699 | 146 | 819 | 161 | 387 | - | 611 | 27 | 328 | 37 |
AA -More than
20 Lakhs population; A - 5-20 Lakhs population; B – 1-5 Lakhs population
Source: Mathur and Singh (1998) |
suggest, exogenous factors are those that are not
within the control of concerned ULB whereas endogenous factors refer
to those that have to do with the ULBs’ own operation Exogenous factors
include: delegation of revenue powers (decentralization) and dependency of ULB
for resources on upper tier of government (dependency ratio). Endogenous factors
include: revenue (tax) administration, cost recovery and quality of expenditure.
The framework of analysis proposed to be followed for assessment of ULB performance
is set out in Figure 5.
Thus the assessment of finances of ULBs is proposed
to proceed as follows:
• First, the ULBs have been assessed
in terms of “standard approach” using revenue balance,
fiscal balance and the ratio of revenue expenditure to total expenditure. 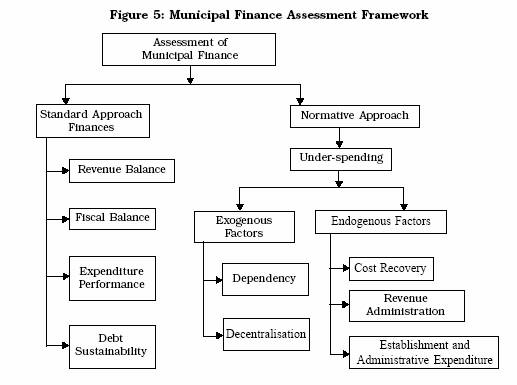
•
Secondly, ULBs were assessed in terms of “normative approach” by using
Zakaria Committee norms. The Zakaria Committee norms for civic amenities are adjusted
to the current prices of the period of 1999-2000 to 2003-2004, using an appropriate
inflation index, i.e. WPI. The performance of individual MCs is compared
against the respective norms, and, the level of under-spending is worked out.
This is followed by the identification of the factors responsible for the level
of under-spending. • Next section, deals with ‘use of debt’
and ‘debt sustainability’ of the MCs and ascertain the capacity of
the MCs to borrow for augmenting spending on provision of services. •
The subsequent section summarises the performance of individual MCs in terms of
different parameters and attempts to rank them. • In the last section,
estimates of resource requirements of the urban sector and the potential of revenues
of the ULBs in India have been attempted. 5.3 Major Inferences from
Analysis 5.3.1 Standard Approach i)
Revenue Balance Revenue balance, measured as revenue receipts net
of revenue or current expenditure, indicates whether a municipal corporation (MC)
is able to meet its revenue expenditure from its own resources including grants
from the upper tiers of Government. Table 26 reveals that all the MCs, barring
Pune and Patna, were able to generate revenue surplus5.
Table
26: Balance of Municipal Revenues and Expenditure |
(Average
of 1999-2000 to 2003-2004) | Sl.
No. | Municipal
Corporation | Revenue
Income
(Rs Crore) | Per
capita
Revenue
Income
(Rs) | Revenue
Expenditure
(Rs Crore)
(Rs) | Per
capita
Revenue
Expenditure
Deficit | Total
Revenue
Surplus/
deficit
(Rs Crore) | Per
capita
Revenue
surplus/ |
1 | Hyderabad
| 338.8 | 964.5 | 273.4 | 779.1 | 65.4 | 185.4 |
2 | Visakhapatnam
| 110.1 | 1093.3 | 74.6 | 742.5 | 35.5 | 350.8 |
3 | Vijayawada
| 61.7 | 705.6 | 44.5 | 509.8 | 17.2 | 195.7 |
4 | Patna
| 21.8 | 150.4 | 29.6 | 205.1 | -7.8 | -54.7 |
5 | Delhi
| 880.3 | 872.3 | 361.1 | 341.1 | 519.2 | 531.2 |
6 | Ahmedabad | 599.4 | 1668.5 | 556.7 | 1551.6 | 42.7 | 116.9 |
7 | Surat
| 662.3 | 2577.0 | 208.7 | 816.5 | 453.5 | 1760.4 |
8 | Vadodara | 159.3 | 1233.4 | 141.8 | 1099.1 | 17.4 | 134.3 |
9 | Rajkot
| NA | NA | NA | NA | NA | NA |
10 | Jamshedpur
| NA | NA | NA | NA | NA | NA |
11 | Dhanbad | NA | NA | NA | NA | NA | NA |
12 | Bangalore
| 369.5 | 810.4 | 296.4 | 643.5 | 73.2 | 166.8 |
13 | Kochi
| 51.7 | 858.8 | 25.8 | 430.4 | 25.8 | 428.4 |
14 | Indore
| 180.0 | 1029.6 | 81.4 | 464.9 | 98.6 | 564.7 |
15 | Bhopal
| 80.4 | 545.4 | 27.8 | 189.2 | 52.5 | 356.2 |
16 | Jabalpur
| 54.0 | 551.0 | 33.7 | 344.4 | 20.2 | 206.6 |
17 | Greater
Mumbai | 4162.0 | 3417.1 | 1560.2 | 1283.8 | 2601.8 | 2133.3 |
18 | Pune | 507.2 | 1890.3 | 697.9 | 2582.0 | -190.7 | -691.7 |
19 | Nagpur
| 249.6 | 1197.8 | 204.0 | 979.4 | 45.6 | 218.4 |
20 | Nashik | 268.3 | 2344.7 | 138.7 | 1221.2 | 129.6 | 1123.5 |
21 | Amritsar
| NA | NA | NA | NA | NA | NA |
22 | Ludhiana
| 194.7 | 1333.2 | 109.4 | 749.6 | 85.2 | 583.6 |
23 | Jaipur | 122.9 | 493.7 | 49.7 | 198.9 | 73.2 | 294.8 |
24 | Chennai | 591.0 | 1385.5 | 242.7 | 570.1 | 348.3 | 815.5 |
25 | Coimbatore
| 72.1 | 763.0 | 47.1 | 498.7 | 25.0 | 264.3 |
26 | Madurai
| 56.6 | 610.7 | 45.4 | 489.3 | 11.2 | 121.4 |
27 | Lucknow
| 84.6 | 369.0 | 62.8 | 274.8 | 21.8 | 94.2 |
28 | Kanpur
| 100.3 | 382.9 | 86.2 | 330.4 | 14.1 | 52.5 |
29 | Allahabad
| 36.4 | 365.0 | 25.8 | 259.0 | 10.5 | 106.0 |
30 | Agra
| 39.7 | 303.5 | 24.7 | 189.2 | 15.1 | 114.3 |
31 | Varanasi
| 36.5 | 325.4 | 21.8 | 195.8 | 14.7 | 129.6 |
32 | Meerut
| 40.9 | 365.3 | 31.6 | 283.0 | 9.4 | 82.3 |
33 | Faridabad
| 78.1 | 697.4 | 75.1 | 671.3 | 3.0 | 26.1 |
34 | Kolkata | 542.4 | 1178.5 | 387.1 | 841.4 | 155.3 | 337.1 |
35 | Asansol | 11.1 | 218.2 | 7.4 | 145.8 | 3.7 | 72.4 |
| Total
for35 MCs | 10228 | 1271 | 5456 | 678 | 4772 | 593 |
Source:
Budgets of Municipal Corporations. | ii) Fiscal
Balance
This measure reveals the overall resource gap, after
meeting both revenue and capital expenditure, that needs to be met through borrowings.
It can be observed from the above table that except 7 municipal corporations,
viz. Mumbai, Chennai, Visakhapatnam, Surat, Delhi, Coimbatore and Faridabad,
all other MCs had their revenue falling short of expenditure (having a negative
surplus). This is significant in that for maintaining the present level of expenditure,
revenues are inadequate and borrowed funds are used. Hence MCs are constrained
to raise the expenditure to the desired level for ensuring minimum level of civic
amenities. The level of shortfall ranges from Rs.3 per capita for Jabalpur MC
to Rs.1,411 per capita for Pune MC. However, the 7 MCs which are enjoying surplus
have the fiscal space and clear scope for improving the civic amenities in the
immediate future. There was a surplus of more than Rs.750 and Rs.500 per capita
in case of Surat and Mumbai, respectively6 (Table 27) .
iii)
Expenditure Performance
A proportion of revenue expenditure to
total expenditure reveals the quantum of funds spent for maintaining the current
assets and that available for creating new capital assets.
Table
28 shows categorisation of the MCs on this parameter. It indicates that many of
them have very high proportion of revenue expenditure as compared to the group
average of 56 per cent. Faridabad, Vishakhapatnam, Kolkata, Kanpur and Pune have
shown revenue expenditure constituting more than 70 per cent of their total expenditure,
while Kochi, Indore, Greater Mumbai, Jaipur and Chennai have shown it at less
than 40 per cent of total expenditure. The MCs with very a high proportion of
revenue expenditure need to prioritise their expenditure in favour of capital
expenditure.
Table
27: Resource Gap of the Municipal Corporations | Sl.
No. | Municipal
Corporation | Resource
Gap in Rupees per-Capita
(Average of 1999-2000 to 2003-2004) |
Revenue
Receipts | Total
Expenditure | Resource
Gap | 1 | Greater
Mumbai | 3417 | 2912 | -505 |
2 | Delhi
| 739 | 721 | -18 |
3 | Kolkata | 1178 | 1224 | 46 |
4 | Chennai | 1386 | 1216 | -170 |
5 | Hyderabad
| 964 | 984 | 19 |
6 | Ahmedabad | 1668 | 2040 | 372 |
7 | Kanpur
| 383 | 395 | 12 |
8 | Pune | 1890 | 3301 | 1411 |
9 | Surat
| 2577 | 1818 | -759 |
10 | Jaipur | 471 | 508 | 37 |
11 | Lucknow
| 369 | 449 | 80 |
12 | Vadodara | 1434 | 1678 | 244 |
13 | Agra
| 304 | 345 | 41 |
14 | Nashik | 2345 | 2711 | 366 |
15 | Meerut
| 365 | 398 | 32 |
16 | Faridabad
| 697 | 671 | -26 |
17 | Visakhapatnam
| 1093 | 941 | -152 |
18 | Allahabad
| 365 | 370 | 5 |
19 | Rajkot
| 1020 | 1325 | 305 |
20 | Jabalpur
| 551 | 554 | 3 |
21 | Coimbatore
| 763 | 700 | -63 |
22 | Madurai
| 624 | 874 | 249 |
23 | Vijayawada
| 706 | 772 | 66 |
24 | Kochi
| 813 | 1133 | 320 |
25 | Asansol | 218 | 367 | 149 |
| Total
for 25 MCs | 843 | 910 | 67 |
*: ‘-’
indicates fiscal surplus.
Source: Budgets of Municipal
Corporations. | 5.3.2 Normative Approach
i) Availability of Civic Amenities
The Municipal
Corporations are expected to provide certain minimum level of civic services to
the citizens, in accordance with their obligatory functions and mandates. The
availability of civic amenities in a MC could be approximated by the per capita
Table
28: Categorization of Municipal Corporations as per Revenue
Expenditure
to Total Expenditure Ratio (2003-04) | Parameter | Municipalities | Top
5 Municipalities | At
or Above Average | Hyderabad
| Faridabad (100%) |
Vishakhapatnam | | Vishakhapatnam
(83.69%) | Patna
| | Kolkata
(73.36%) | Ahmedabad | | Kanpur
(72.85%) | Jabalpur
| | Pune
(72.65%) | Pune | | |
Ludhiana | | |
Coimbatore | | |
Lucknow | | |
Kanpur | | |
Allahabad | | |
Meerut | | |
Faridabad | | |
Kolkata | | |
| | Bottom
5 Municipalities | Below
Average | Asansol | Kochi
(26.65%) | | Agra
| Indore (37.68%) |
| Chennai | Greater
Mumbai (38.03%) | | Greater
Mumbai | Jaipur (38.09%) |
| Indore
| Chennai (39.06%) |
| Jaipur | |
| Bhopal
| | | Madurai
| | | Nasik
| | | Kochi
| | | Bangalore
| | | Surat
| | | Vijayawada
| | Source:
Budgets of Municipal Corporations. | expenditure
made by the MC on various services. The adequacy of services
provided by the MCs is assessed by comparing the expenditure incurred by them
on core services, namely, water supply, sewerage, roads and street lighting with
Zakaria Committee expenditure norms7. Zakaria Committee norms were evolved in
1964. They were adjusted for inflation to arrive at norms for the period of 1999-2000
to 2003-2004. Since service-wise data for all the years have been available only
for 11 MCs, average proportion of service-wise expenditure to total expenditure
for these MCs was used to arrive at the expenditure incurred by remaining MCs
on these services. The results shown in Table 29 indicate that spending
on civic services of all the MCs has been lower than the Zakaria Committee norms.
The extent of under-spending varied between 30.78 per cent in the case of Pune
to 94.43 per cent in the case of Patna. The average level of under-spending for
the 30 MCs under the study works out to 76 per cent.
Table
29: Zakaria Committee Norms and Under-spending of the Municipal
Corporations (Averages of 1999-2000 to 2003-2004) |
Sl. No. | Municipal
Corporation | Average
Zakaria
Norm
(Rupees per capita) | Average
Expenditure
of the MC on Core
Services
capita) | Average
Under
Spending of the MC
(As Percentage
of Zakaria Norm) | 1 | Hyderabad
| 861.71 | 207.41 | -76.01 |
2 | Visakhapatnam
| 786.21 | 198.76 | -74.73 |
3 | Vijayawada
| 791.06 | 147.67 | -81.40 |
4 | Patna
| 856.56 | 47.56 | -94.43 |
5 | Delhi
| 920.78 | 137.35 | -85.38 |
6 | Surat
| 986.12 | 370.61 | -62.24 |
7 | Vadodara | 804.18 | 384.21 | -50.43 |
8 | Bangalore
| 983.77 | 249.24 | -74.92 |
9 | Kochi
| 747.95 | 277.34 | -63.65 |
10 | Indore
| 843.88 | 210.63 | -75.54 |
11 | Bhopal
| 823.74 | 127.53 | -84.50 |
12 | Jabalpur
| 808.08 | 115.18 | -85.79 |
13 | Greater
Mumbai | 873.37 | 597.17 | -31.64 |
14 | Pune | 985.55 | 684.89 | -30.78 |
15 | Nagpur
| 892.33 | 289.08 | -67.50 |
16 | Nashik | 883.52 | 571.11 | -35.52 |
17 | Ludhiana
| 744.84 | 281.92 | -62.77 |
18 | Jaipur | 979.17 | 114.32 | -88.48 |
19 | Chennai | 839.69 | 250.84 | -70.11 |
20 | Coimbatore
| 771.71 | 146.19 | -81.06 |
21 | Madurai
| 726.77 | 187.30 | -74.75 |
22 | Lucknow
| 921.07 | 93.38 | -89.88 |
23 | Kanpur
| 917.65 | 82.45 | -91.01 |
24 | Allahabad
| 795.23 | 78.08 | -90.17 |
25 | Agra
| 837.94 | 72.70 | -91.31 |
26 | Varanasi
| 783.51 | 76.58 | -90.17 |
27 | Meerut
| 840.60 | 82.84 | -90.15 |
28 | Faridabad
| 896.00 | 141.14 | -84.25 |
29 | Kolkata | 819.73 | 255.82 | -68.75 |
30 | Asansol | 788.63 | 77.26 | -90.21 |
ii) Factors influencing Under-spending
There
are a host of factors which influence the level of underspending by local bodies.
These could broadly be categorized as ‘exogenous’ or ‘endogenous’
in nature.
Exogenous Factors
The exogenous
factors are essentially those factors over which the MCs do not have any control.
Since the level of spending depends upon the level of resources available with
the MC, the delegation of revenue powers (fiscal decentralization) and grants
(intergovernmental transfers), which determine the resources of the local bodies,
would be the key exogenous factors influencing the ability of the MC to spend
and provide these services. These factors could be captured in the form of ‘dependency
ratio’ and ‘decentralization ratio’, defined as below: •
Dependency ratio refers to the share of grants a MC receives to its total
expenditure.
• Decentralisation ratio refers to the delegation
of autonomy in decision-making with respect to the finances of the MC. Revenue
decentralization ratio is measured by ratio of MC’s per capita revenue to
State per capita revenue receipt.
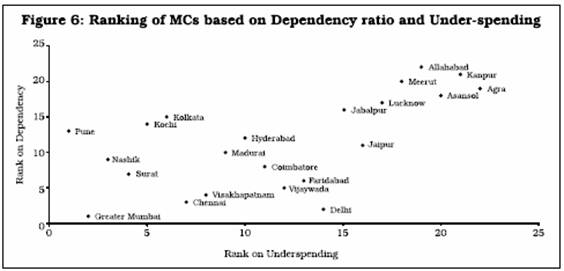
(a) Dependency and Under-spending
Table 30 juxtaposes the extent of under-spending with the dependency ratio of
the MCs. The rank correlation coefficient between these two series works out to
0.61. The coefficient is statistically significant at 1 per cent level of significance.
Figure 6 presents the scatter diagram between under-spending and dependency on
grants from higher level of governments. This indicates a significant positive
relationship, implying that higher dependency would lead to higher under-spending.
Table
30: Dependency ratio and Under-spending of the
Municipal
Corporations | Sl.
No. | Municipal
Corporation | Under
Spending (%) | Dependency
Ratio (%) | 1 | Greater
Mumbai | 31.64 | 0.69 |
2 | Delhi
| 85.38 | 2.35 |
3 | Kolkata | 68.75 | 46.50 |
4 | Chennai | 70.11 | 3.97 |
5 | Hyderabad
| 76.01 | 16.42 |
6 | Kanpur
| 91.01 | 72.28 |
7 | Pune | 30.78 | 22.45 |
8 | Surat
| 62.24 | 7.69 |
9 | Jaipur | 88.48 | 14.53 |
10 | Lucknow
| 89.88 | 61.50 |
11 | Agra
| 91.31 | 67.18 |
12 | Nashik | 35.52 | 8.98 |
13 | Meerut
| 90.15 | 67.46 |
14 | Faridabad
| 84.25 | 7.58 |
15 | Visakhapatnam
| 74.73 | 4.03 |
16 | Allahabad
| 90.17 | 72.67 |
17 | Jabalpur
| 85.79 | 60.43 |
18 | Coimbatore
| 81.06 | 8.01 |
19 | Madurai
| 74.75 | 9.31 |
20 | Vijayawada
| 81.40 | 4.80 |
21 | Kochi
| 63.65 | 43.03 |
22 | Asansol | 90.21 | 62.07 |
Table
31: Categorization of Municipal Corporations as per Dependency Ratio
(Average of 1999-00 to 2003-04) | Parameter | Municipal
Corporations | Top
5 Municipal Corporations | At
or Above Average | Kolkata | Kanpur
(0.72) | (High
dependency) | Kanpur | Allahabad
(0.72) | | Pune | Agra
(0.67) | | Lucknow
| Meerut (0.67) |
| Agra
| Asansol (0.62) |
| Meerut
| | | Jabalpur
| | | Kochi
| | | Ahmedabad | |
| Allahabad
| | | Asansol | |
| | Bottom
5 Municipal Corporations | Below
Average | Greater Mumbai | Greater
Mumbai (0.069) | (Low
dependency) | Delhi | Delhi
(0.023) | | Chennai | Chennai
(0.004) | | Hyderabad
| Vishakhapatnam (0.04) |
| Surat
| Vijayawada (0.05) |
| Jaipur | |
| Vadodara | |
| Nashik | |
| Faridabad
| | | Vishakhapatnam
| | | Rajkot
| | | Coimbatore
| | | Madurai
| | | Vijayawada
| | The
MCs falling above and below the group average of the average dependency ratio
(over the period 1999-2000 to 2003-2004) are shown in Table 31.
(b) Decentralisation and Under-spending
Table
32 compares the extent of under-spending and decentralization, a measure of delegation
of tax powers to the MCs. Here, decentralization ratio has been measured as proportion
of the MC’s per capita revenue to State per capita revenue, over the time
period of 1999-2000 to 2003-2004.
Table
32: Decentralisation and Under-Spending of the Municipal Corporations
(Average of 1999-2000 to 2003-2004) | Sl.
No. | Municipal
Corporation | Under
Spending (%) | Revenue
Decentralisation Ratio (%) | 1 | Greater
Mumbai | 31.64 | 110.61 |
2 | Delhi
| 85.38 | 18.03 |
3 | Kolkata | 68.75 | 67.65 |
4 | Chennai | 70.11 | 45.07 |
5 | Hyderabad
| 76.01 | 34.43 |
6 | Kanpur
| 91.01 | 24.67 |
7 | Pune | 30.78 | 61.19 |
8 | Surat
| 62.24 | 79.92 |
9 | Jaipur | 88.48 | 21.69 |
10 | Lucknow
| 89.88 | 23.77 |
11 | Agra
| 91.31 | 19.55 |
12 | Nashik | 35.52 | 75.90 |
13 | Meerut
| 90.15 | 23.53 |
14 | Faridabad
| 84.25 | 19.82 |
15 | Visakhapatnam
| 74.73 | 39.02 |
16 | Allahabad
| 90.17 | 23.52 |
17 | Jabalpur
| 85.79 | 25.67 |
18 | Coimbatore
| 81.06 | 24.82 |
19 | Madurai
| 74.75 | 20.31 |
20 | Vijayawada
| 81.40 | 25.18 |
21 | Kochi
| 63.65 | 26.76 |
22 | Asansol | 90.21 | 12.53 |
The results shown in Table 31 and the scatter diagram in
Figure 7 confirm our a priori view that higher the revenue 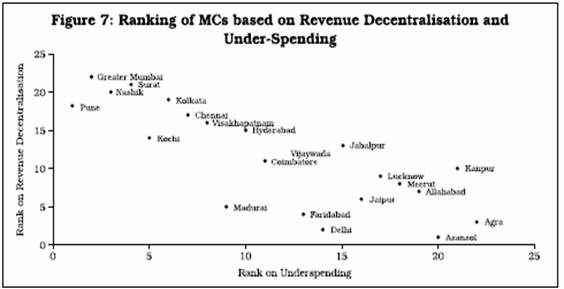
Table
33: Categorization of Municipal Corporations as per Revenue
Decentralisation
Ratio (Average of 1999-00 to 2003-04) | Parameter | Municipal
Corporations | Top
5 Municipal Corporations | At
or Above Average | Greater
Mumbai | Greater Mumbai (110.61%) |
(Highly decentralized) | Surat
| Surat (79.92%) |
| Nashik | Nashik
(75.9%) | | Pune | Kolkata
(67.65 %) | | Kolkata | Pune
(61.19%) | | Chennai | Surat
(38.99%) | | Visakhapatnam
| | | | Bottom
5 Municipal Corporations | Below
Average | Hyderabad | Asansol
(12.53%) | (Lowly
decentralized) | Kanpur | Delhi
(18.03%) | | Jaipur | Agra
(19.55%) | | Lucknow
| Faridabad (19.82%) |
| Agra
| Madurai (20.31%) |
| Delhi
| | | Kochi
| | | Madurai
| | | Vijayawada
| | | Jabalpur
| | | Meerut
| | | Coimbatore
| | | Faridabad
| | | Allahabad
| | | Asansol | |
decentralization, lower the level of under-spending. The
rank correlation computed as per Spearman’s rank correlation works out to
be - 0.81 and has a desired negative sign. It is highly significant at 1 per cent
level of significance.
Table 33 provides the list of MCs that fall above
or below the group average decentralization ratio.
Endogenous
Factors
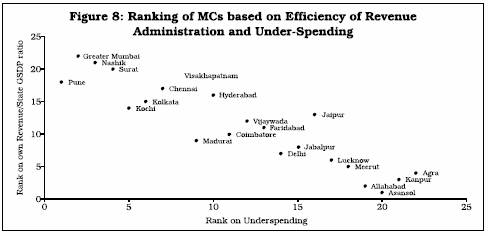
(a) Revenue Administration
This parameter refers to local body’s efficiency in levying and collecting
revenues which falls in its jurisdiction i.e, own sources of revenue of the MC.
Although not a very accurate measure, it aims at measuring MC’s performance
with regard to own revenue. The ratio of per capita own revenue of MC to
State GDP (GSDP) per capita could be taken as a close approximation of the efficiency
of revenue administration8. Table 34 provides a comparative scenario of under-spending
and efficiency of revenue administration.
With efficient revenue administration
reflected by own revenue as a proportion to GSDP, the availability of resources
with the MC improves and level of under-spending is accordingly lower. Rank correlation
among the two parameters works out to -0.913, which is statisticallysignificant
at 1 per cent level.
The scatter diagram in Figure 8 clearly reveals a negative
relationship between efficiency of revenue administration and level of under-spending.
Table
34: Efficiency of Revenue Administration and Under-Spending of the
Municipal Corporations | Sl.
No. | Name
of the Municipal Corporation | Under
Spending (%) | Ratio
of Per capita Own Revenue to GSDP per capita (%) | 1 | Greater
Mumbai | 31.64 | 18.45 |
2 | Delhi
| 85.38 | 2.30 |
3 | Kolkata | 68.75 | 5.36 |
4 | Chennai | 70.11 | 6.61 |
5 | Hyderabad
| 76.01 | 5.75 |
6 | Kanpur
| 91.01 | 1.44 |
7 | Pune | 30.78 | 6.66 |
8 | Surat
| 62.24 | 9.69 |
9 | Jaipur | 88.48 | 4.43 |
10 | Lucknow
| 89.88 | 1.90 |
11 | Agra
| 91.31 | 1.50 |
12 | Nashik | 35.52 | 12.26 |
13 | Meerut
| 90.15 | 1.55 |
14 | Faridabad
| 84.25 | 3.82 |
15 | Visakhapatnam
| 74.73 | 7.25 |
16 | Allahabad
| 90.17 | 1.27 |
17 | Jabalpur
| 85.79 | 2.50 |
18 | Coimbatore
| 81.06 | 3.80 |
19 | Madurai
| 74.75 | 3.19 |
20 | Vijayawada
| 81.40 | 3.91 |
21 | Kochi
| 63.65 | 4.81 |
22 | Asansol | 90.21 | 0.73 |
A
comparison of the own revenue with performance on individual taxes that are levied
and collected by the Municipal Corporations would provide further insight into
tax efficiency of the urban local bodies. Table 35 provides a comparative position
of
Table
35: Own Revenue-GSDP Ratio and Performance on Individual Taxes |
Sl.
No. | Municipal
Corporation | Own
Revenue to GSDP | Property
tax | Profession
tax | Advertisement
tax | Octroi
Ratio | High
Own Tax | 1 | Greater
Mumbai | 8.63 | × | | × | v |
2 | Surat
| 9.93 | v | | | v |
3 | Chennai | 3.41 | v | v | × | |
4 | Visakhapatnam
| 8.24 | v | v | × | |
5 | Vijayawada
| 4.45 | v | v | | |
6 | Hyderabad
| 6.53 | v | v | v | |
Lower Own
Tax | 7 | Kochi
| 1.55 | v | v | | |
8 | Jabalpur
| 1.02 | × | × | | × |
9 | Nashik | 1.30 | × | | | v |
10 | Coimbatore
| 1.38 | × | × | | |
11 | Jaipur | .50 | × | | v | × |
12 | Madurai
| .93 | × | | | |
13 | Faridabad
| 1.11 | × | | × | |
Notes :
v : represents equal or above average performance,
× : represents
lower than average performance. In the case of blank cells, no information is
available. | different tax sources in order to
identify the corporations with potential for improving tax administration
It is pertinent to note that all MCs, barring Mumbai, with above average own tax
revenue have performed well in case of property tax and/or profession tax. In
case of Mumbai, it has done well in case of Octroi. On the other hand, except
Kochi, all MCs falling in the below average category have not done well in either
of the major taxes.
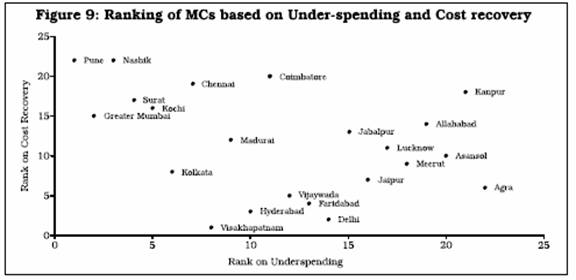
(b) Recovery of Cost
Cost
recovery of services is an important measure, which is used to assess the health
of municipal finances. It can be broadly measured as a ratio of municipal fees
and user charges to revenue expenditure incurred by an MC for the provision of
respective services viz., water supply, sanitation, health services,
education and street lighting. As detailed data on service-wise user charges and
fees are not available, the broad indicator of ratio of municipal fees and user
charges to aggregate revenue expenditure has been used as a proxy. Table 36 makes
a comparison of under-spending and cost recovery of the MCs. None of the MCs,
barring Delhi, Visakhapatnam and Bhopal show a high proportion of cost recovery.
It is less than 10 per cent in the MCs of Kerala and Tamil Nadu. Cost recovery
has to be an integral part of service provision, especially when services can
be measured and beneficiaries identified, as in case of water supply, education
and health.
The scattered diagram in Figure 9 indicates a negative
but relatively weak relationship between under-spending and cost recovery. In
case of MCs such as Kanpur, Allahabad and Lucknow, despite higher cost recovery,
under-spending has not been lower. Rank correlation for these two series is -0.39,
which is significant at 10 per cent level. (c) Quality of Expenditure
The expenditure structure of Municipal Corporations throws some light on the relative
importance assigned to each component in the total expenditure and it also has
a bearing on the financial position and service delivery.
Table
36: Under-spending and Cost recovery of the Municipal Corporations |
Sl. No. | Municipal
Corporation | Under
Spending
of the MC (%) | Average
Cost
recovery (%) | 1 | Hyderabad
| 76.01 | 38.88 |
2 | Visakhapatnam
| 74.73 | 81.91 |
3 | Vijayawada
| 81.40 | 37.48 |
4 | Delhi
| 85.38 | 94.13 |
5 | Surat
| 62.24 | 11.11 |
6 | Bangalore
| 74.92 | 14.41 |
7 | Kochi
| 63.65 | 7.76 |
8 | Indore
| 75.54 | 31.83 |
9 | Bhopal
| 84.50 | 62.85 |
10 | Jabalpur
| 85.79 | 7.20 |
11 | Greater
Mumbai | 31.64 | 11.16 |
12 | Ludhiana
| 62.77 | 9.18 |
13 | Jaipur | 88.48 | 33.61 |
14 | Chennai | 70.11 | 7.74 |
15 | Coimbatore
| 81.06 | 4.47 |
16 | Madurai
| 74.75 | 4.79 |
17 | Lucknow
| 89.88 | 9.82 |
18 | Kanpur
| 91.01 | 3.90 |
19 | Allahabad
| 90.17 | 6.06 |
20 | Agra
| 91.31 | 23.25 |
21 | Varanasi
| 90.17 | 9.34 |
22 | Meerut
| 90.15 | 12.39 |
23 | Faridabad
| 84.25 | 28.15 |
24 | Kolkata | 68.75 | 15.17 |
25 | Asansol | 90.21 | 13.08 |
. 
Relative
shares of Capital, Maintenance and Establishment Expenditures
While a low proportion of spending on establishment is desirable, too low a proportion
may hamper the capacity for service delivery. Likewise, expenditure on capital
works is important as it provides future sources of revenue; but very high proportion
on it would have a bearing on the finances available for provision of services
and even necessitate external support, in the form of either grants or borrowings.
Table 37 presents the relative shares of various expenditure components of the
MCs. It indicates that some of the MCs have an unsustainably high proportion of
(more than 50 per cent) total expenditure on establishment and administration,
which affects the future of their finance and their service delivery capacity.
Likewise, some MCs have an abysmally low capital expenditure (less than 10 per
cent to almost zero), which is equally detrimental to the health of civic finance
and its long-term sustainability. It is, therefore, desirable to develop certain
guidelines/norms for the municipal corporations towards spending on capital and
its maintenance works, as well for rationalizing the staffing pattern so as to
ensure that excessive amounts are not spent on staff.
Establishment
& Administration Expenditure and Under-spending
The revenue
expenditure, which comprises expenditures on (i) establishment and administration
and (ii) operations and maintenance, assumes critical importance, as it relates
to the provision of civic services to the people and their maintenance. However,
a very high proportion of expenditure on establishment and administration can
be detrimental to both the expansion of capital assets and maintenance of existing
facilities. Thus, with a relatively lower proportion of expenditure devoted to
establishment and administration, the MCs would be better equipped to provide
Table
37: Relative Share of Expenditure Components of the MCs
(Average
of the Shares during 1999-2003) | Sl.
No. | Municipal
Corporation | Share
of Establishment
& Administration
Expenditure
in Total
Expenditure (%) | Share
of Operations & Maintenance
Expenditure in Total
Expenditure (%) | Share
of Capital
Expenditure in Total
Expenditure
(%) | 1 | Hyderabad
| 56.95 | 22.19 | 19.82 |
2 | Visakhapatnam
| 46.55 | 32.38 | 18.74 |
3 | Vijaywada | 46.55 | 32.38 | 18.74 |
4 | Patna
| 53.09 | 26.46 | N.A. |
5 | Delhi
| 43.71 | 2.18 | 6.08 |
6 | Ahmedabad | 0.00 | 0.00 | 23.82 |
7 | Surat
| 37.61 | 8.01 | 39.47 |
8 | Vadodara | 41.53 | 20.03 | 13.48 |
9 | Bangalore
| 49.00 | 4.72 | N.A. |
10 | Kochi
| 16.01 | 32.94 | 1.25 |
11 | Indore
| 28.61 | 12.15 | 25.96 |
12 | Bhopal
| 20.64 | 11.06 | 2.85 |
13 | Jabalpur
| 55.34 | 7.52 | N.A. |
14 | Greater
Mumbai | 36.79 | 8.30 | 0.06 |
15 | Pune | 20.06 | 58.62 | 21.32 |
16 | Nagpur
| 37.98 | 36.72 | 25.30 |
17 | Nashik | 25.03 | 20.56 | 42.29 |
18 | Ludhiana
| 42.75 | 13.19 | 1.37 |
19 | Jaipur | 31.53 | 5.17 | 36.03 |
20 | Chennai | 42.77 | 4.76 | 21.61 |
21 | Coimbatore
| 55.91 | 15.53 | 28.56 |
22 | Madurai
| 53.21 | 2.34 | 29.98 |
23 | Lucknow
| 48.83 | 14.12 | 23.96 |
24 | Kanpur
| 66.89 | 17.15 | 1.50 |
25 | Allahabad
| 51.03 | 18.89 | 0.24 |
26 | Agra
| 50.72 | 4.16 | 12.41 |
27 | Varanasi
| 50.93 | 6.05 | 0.11 |
28 | Meerut
| 58.45 | 13.03 | 21.34 |
29 | Faridabad
| 46.84 | 53.16 | N.A. |
30 | Kolkata | 61.30 | 7.39 | 8.72 |
31 | Asansol | 32.07 | 7.92 | 40.12 |
| Total | 36.25 | 14.43 | 12.37 |
Source:
Budgets of Municipal Corporations. | civic amenities.
Table 38 compares the establishment and administration expenditure and under-spending
of the MCs. The relationship of under-spending with the proportion of expenditure
on establishment and administration is shown in the scatter diagram in Figure
10. It indicates a positive relationship conforming to a priori expectations.
Rank correlation for these two series is 0.44 which is significant at 5 per cent
level
Table
38: Average Establishment and Administration Expenditure of
the
Municipal Corporations (1999-2000 to 2003-2004) | Sl.
No. | Municipal
Corporation | Under
Spending (%) | Expenditure
on Establishment and Administration to Total
Expenditure
(%) | 1 | Greater
Mumbai | 31.64 | 36.79 |
2 | Delhi
| 85.38 | 43.71 |
3 | Kolkata | 68.75 | 61.30 |
4 | Chennai | 70.11 | 42.77 |
5 | Hyderabad
| 76.01 | 56.95 |
6 | Kanpur
| 91.01 | 66.89 |
7 | Pune | 30.78 | 20.06 |
8 | Surat
| 62.24 | 37.61 |
9 | Jaipur | 88.48 | 31.53 |
10 | Lucknow
| 89.88 | 48.83 |
11 | Agra
| 91.31 | 50.71 |
12 | Nashik | 35.52 | 25.03 |
13 | Meerut
| 90.15 | 58.45 |
14 | Faridabad
| 84.25 | 46.84 |
15 | Visakhapatnam
| 74.73 | 46.55 |
16 | Allahabad
| 90.17 | 51.03 |
17 | Jabalpur
| 85.79 | 55.34 |
18 | Coimbatore
| 81.06 | 55.91 |
19 | Madurai
| 74.75 | 53.21 |
20 | Vijayawada
| 81.40 | 51.03 |
21 | Kochi
| 63.65 | 16.01 |
22 | Asansol | 90.21 | 32.05 |
Table 39 provides a summary position on relationship of underspending
with other major variables as discussed above. Under- 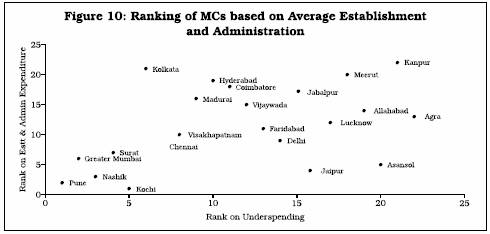
Table
39: Summary of the Assessment of Finances of Municipal Corporations |
Sl.
No. | Municipal
Corporation | Under-
Spending % | Depend-
ency | Decentra-
lisation | Revenue
(Tax)
Adminis-
tration | Quality
of
Expendi-
ture | Cost
Recovery | 1 | Pune | 30.78 | v | v | v | v | |
2 | Greater
Mumbai | 31.64 | v | v | v | v | × |
3 | Nazi | 35.52 | v | v | v | v | |
4 | Vadodara | 50.43 | v | v | | | |
5 | Surat
| 62.24 | v | v | v | v | × |
6 | Ludhiana
| 62.77 | | | | | × |
7 | Kochi
| 63.65 | × | × | × | | × |
8 | Nagpur
| 67.50 | | | | | |
9 | Kolkata | 68.75 | × | v | v | × | × |
10 | Chennai | 70.11 | v | v | v | v | × |
11 | Visakhapatnam
| 74.73 | v | × | v | v | v |
12 | Madurai
| 74.75 | v | × | × | | × |
13 | Bangalore
| 74.92 | | | | | × |
14 | Indore
| 75.54 | | | | | v |
15 | Hyderabad
| 76.01 | v | × | v | × | v |
16 | Coimbatore
| 81.06 | v | × | × | × | × |
17 | Vijayawada
| 81.40 | v | × | × | × | v |
18 | Faridabad
| 84.25 | v | × | × | × | v |
19 | Bhopal
| 84.50 | | | | | v |
20 | Jabalpur
| 85.79 | × | × | × | × | × |
21 | Jaipur | 88.48 | v | × | × | | v |
22 | Lucknow
| 89.88 | × | × | × | × | × |
23 | Meerut
| 90.15 | × | × | × | × | × |
24 | Allahabad
| 90.17 | | × | × | × | × |
25 | Varanasi
| 90.17 | | | | | × |
26 | Asansol | 90.21 | × | × | × | v | × |
27 | Kanpur
| 91.01 | × | × | × | × | × |
28 | Agra
| 91.31 | × | × | × | × | v |
29 | Patna
| 94.43 | | | | | |
v : Above average
performance. × : Below average performance. | spending
has been shown in the ascending order with the MC on the top being the best performer
(with highest per capita spending on core services). Subsequent columns indicate
status of individual MCs against various parameters that are expected to influence
the level of under-spending. With a majority of the tick marks being concentrated
towards the top, the influence of various factors on the level of underspending
is quite apparent. (d) Debt Position
The debt position
of MCs can be assessed in terms of the followings: a) use of debt and b) debt
sustainability. The former has been examined by computing debt to capital expenditure
ratio and the latter has been ascertained by computing interest coverage and debt
coverage ratios. Use of Debt
Borrowed funds
are intended for creation/development of infrastructure by a MC, resulting in
asset creation so that the returns generated from the assets can be utilized for
servicing the debt (here, it is implicitly assumed that either returns are designed
to be adequate or facilities are subsidized by upper tiers). The ratio of borrowings
to capital expenditure of the municipalities provides an indication of the extent
to which borrowed funds are spent on capital formation. A value of the ratio above
one (a proportion greater than 100 per cent) will indicate that a portion of the
borrowed funds is utilized for current consumption.
Table 40 indicates that
except three MCs belonging to Kochi, Ludhiana & Allahabad no other MC have
a borrowing to capital expenditure ratio of more than one, suggesting that the
borrowed funds have been utilized for capital expenditure only.
Table
40: Borrowings to Capital Expenditure Ratio of the MCs
(Average
of 1999-2003) | Municipal
Corporation | Loans
(Rs. Lakhs) | Capital
Expenditure
(Rs. Lakhs) | Borrowings/Capital
Expenditure ratio’ (%) | Vijaywada | 520 | 1495 | 34.74 |
Delhi | 1253 | 4807 | 26.06 |
Ahmedabad | 12205 | 17564 | 69.49 |
Surat | 5653 | 18169 | 31.11 |
Kochi | 1562 | 148 | 1053.03 |
Indore | 1643 | 5323 | 30.86 |
Bhopal | 16 | 283 | 5.66 |
Nagpur | 2737 | 5620 | 48.69 |
Ludhiana | 715 | 268 | 266.92 |
Jaipur | 375 | 4875 | 7.69 |
Chennai | 4244 | 11314 | 37.51 |
Coimbatore | 763 | 1898 | 40.18 |
Madurai | 1118 | 2666 | 41.92 |
Lucknow | 2026 | 2595 | 78.09 |
Allahabad | 124 | 37 | 333.78 |
Meerut | 405 | 924 | 43.85 |
Asansol | 26 | 755 | 3.38 |
Source:
Budget documents of Municipal Corporations. | |
Debt Sustainability
Apart from the
use of borrowings, debt sustainability of the MCs needs to be assessed, and this
can be done in terms of two indicators: ratio of outstanding debt to total revenues
and ratio of debt servicing to revenue receipts. As the outstanding debt details
of the MCs are not available in the budget documents, the second measure is used
in the study. It may be noted that debt repayments include both principal and
interest components.
Table 41 sets out the information relating to debt
repayment to revenue receipt ratio of the MCs. It reflects that the debt repayment
of 18 MCs has not been very high. Excepting the cases of MCs of Chennai, Madurai
and Vijayawada, wherein the debt repayment is over and above 10 per cent of their
revenue receipts, there is a potential for using debt wisely, by the MCs for capital
formation.
Table
41: Debt Repayment to Revenue receipts ratio of the MCs
(Average
of 1999-2003) | Municipal
Corporation | Debt
Repayment
Rs. Lakhs) | Revenue
Receipts(Rs. Lakhs) | Debt
Repayment to Revenue receipts (%) | Hyderabad
| 307 | 33882 | 0.91 |
Visakhapatnam | 217 | 11007 | 1.97 |
Vijaywada | 935 | 6165 | 15.17 |
Delhi | 309 | 88030 | 0.35 |
Bangalore | 2805 | 36954 | 7.59 |
Kochi | 60 | 5168 | 1.16 |
Indore | 304 | 17997 | 1.69 |
Greater Mumbai | 29549 | 416203 | 7.10 |
Pune | 216 | 50716 | 0.43 |
Nagpur | 1574 | 24961 | 6.31 |
Nashik | 2231 | 26830 | 8.32 |
Ludhiana | 328 | 19467 | 1.68 |
Jaipur | 301 | 12286 | 2.45 |
Chennai | 6762 | 59103 | 11.44 |
Coimbatore | 124 | 7210 | 1.72 |
Madurai | 962 | 5660 | 17.00 |
Kanpur | 68 | 10033 | 0.68 |
Kolkata | 655 | 54239 | 1.21 |
Source:
Budget documents of Municipal Corporations. | However,
apart from the measure of debt service in relation to the revenue receipts, debt
sustainability should be examined from the point of view of an MC’s capacity
to service debt. The capacity to service the debt refers to how easily and readily
the MC will be able to meet its commitment in respect of the contractual interest
payment and the repayment of debt. The MC’s ability to service the liabilities
can be measured with the help of coverage ratios. The coverage ratios establish
relationship between committed liabilities, and the MC’s surplus out of
which these claims are to be paid. These measures try to relate the MC’s
surplus to the level of debt repayments with a view to assessing the degree of
comfort with which the MC can meet these repayments. The following coverage ratios
may used to analyze a MC’s ability to service committed liabilities.
Interest Coverage Ratio
This ratio is also
called the “times interest earned” ratio and it measures the ability
of an MC to pay the interest liability on debts. This is calculated as the ratio
of operating surplus to interest payment*. The Interest Coverage (IC) Ratio,
therefore, measures how many times the interest liability of the MC is covered
with the MC’s operating surplus. The ratio gives an idea of how much fall
in surplus the MC can sustain, before it defaults or borrows to meet the interest
liability. Table 42 shows the performance of the MCs on this measure.
For the MCs whose interest payment details exist, the measure shows that they
are on the higher side. The higher the IC ratio, the better it is both for the
MC and for the lenders. For the MC, the probability of committing default is reduced
and for the lenders, the
Table
42: Interest Coverage Ratio of the Municipal Corporations
(Average
of 1999 – 2003) | Sl.
No. | Municipal
Corporation | Interest
repayment
(Rs Lakhs) | Operating
Surplus
(Rs Lakhs) | Times
Interest
Earned Ratio (%) | 1. | Hyderabad
| 307 | 6852 | 22.32 |
2. | Kochi
| 20 | 2604 | 130.18 |
3. | Indore
| 202 | 10064 | 49.82 |
4. | Nagpur
| 593 | 5155 | 8.69 |
5. | Nashik | 1607 | 14565 | 9.06 |
6. | Jaipur | 172 | 7489 | 43.54 |
7. | Chennai | 1798 | 36629 | 20.37 |
Source
: Budgets of Municipal Corporations. | | |
MC is considered to be less risky. A lower IC ratio indicates a low
surplus or a deficit of the MC in relation to its interest payment commitments.
Mathur and Ray (2003) provide criteria based on IC ratio as follows: a
ratio less than 1.5 is poor, 1.5 to 3 is moderate, 3 to 6 is good and greater
than 6 is favourable. Therefore, all the above MCs are on a favourable side of
the measure.
Debt Coverage Ratio
The debt coverage ratio shows the relationship between the operating surplus of
the MCs and the committed liability in respect of interest and principal. It is
calculated as the ratio of operating surplus and debt repayment (interest and
principal repayments). Table 43 provides the performance of the MCs on this measure.
A high debt coverage ratio is indicative of the MC’s ability to meet
its committed payment obligations easily, while a low ratio indicates its difficulty
to meet the obligations.
According to Mathur and Ray (2003), the
criteria laid down for this measure are as follows: a ratio less than 1 is poor,
1 to 2 is moderate, 2 to 4 is good and greater than 4 is favourable. For the MCs
under study whose debt repayment details exist, the measure shows that all MCs
except 4 fall in category of ‘favourable’. Vijaywada and Madurai fall
in ‘moderate’ category whereas Bangalore and Nagpur could be termed
as ‘good’.
Table
43: Debt Coverage Ratio to Operating Surplus of the MCs
(Average
of 1999-2003) | Sl.
No. | Municipal
Corporation | Debt
Payment
(Rs Lakhs) | Operating
Surplus
(Rs Lakhs) | Times
Debt Covered
(Operating surplus/
Debt
payment) | 1. | Hyderabad
| 307 | 6852 | 22.3 |
2. | Visakhapatnam
| 217 | 3551 | 16.4 |
3. | Vijaywada | 935 | 1715 | 1.8 |
4. | Delhi
| 309 | 51917 | 168 |
5. | Bangalore
| 2805 | 7317 | 2.6 |
6. | Kochi
| 60 | 2604 | 43.4 |
7. | Indore
| 304 | 10064 | 33.1 |
8. | Greater
Mumbai | 29549 | 260181 | 8.8 |
9. | Pune | 216 | -19072 | Negative |
10. | Nagpur
| 1574 | 5155 | 3.3 |
11. | Nashik | 2231 | 14565 | 6.5 |
12. | Ludhiana
| 328 | 8524 | 26 |
13. | Jaipur | 301 | 7489 | 24.9 |
14. | Chennai | 6762 | 36629 | 5.4 |
15. | Coimbatore
| 124 | 2500 | 20.2 |
16. | Madurai
| 962 | 1125 | 1.2 |
17. | Kanpur
| 68 | 1408 | 20.7 |
18. | Kolkata | 655 | 15531 | 23.7 |
Source
: Budgets of Municipal Corporations. | 5.4
Projection of Investment Requirement in Urban Areas
This section
attempts to project resource requirement for basic civic amenities via, water
supply, sewerage, roads, solid waste management and street lighting and for the
provision of mass urban transport systems as well as road infrastructure. For
making these projections, various norms have been used: Zakaria Committee Norms
(Basic amenities), Service cost Norms (Rail/ Road based mass transport) and the
Expected Service cost (Inner and Outer ring roads). The details of methodology
used for projections are provided below.
5.4.1 Basic Amenities
There would be need for resources for creating new infrastructure for the growing
population (including backlog) and for maintenance of current and future assets.
Thus, funds would be needed for: i) New infrastructure for backlog, ii) New infrastructure
for incremental population and iii) Operation and Maintenance expenditure. (i)
The investment needs for creating new assets for civic amenities viz.,
water supply, sewerage, roads and street lighting were worked out using Zakaria
Committee norms. In the case of solid waste management, the norms were worked
out from the estimates made in Arabi (2006). These norms were adjusted for inflation
assuming head line inflation of 5 per cent per annum during the projection period.
(ii) It was assumed that there was a service backlog of 33 per cent i.e.
one third of the population did not have service coverage9 .
(iii)
Zakaria Committee norms were used for working out the operation and maintenance
expenditure requirement for all the services mentioned at (i) except solid waste
management10. Thus, the resource requirement for incremental investment and
O&M worked out for each year as:
Incremental Investment Need = Zakaria
Norm (adj)* Incremental Population
O&M expenditure Needs =
Zakaria Norm (adj) * Population
Resource requirement for backlog population
worked out as:
Backlog Investment Needs = Zakaria Norm (adj)* Backlog
Population
The total resource needs for the provision of major civic
services can be estimated by adding up:
Incremental Investment Needs
+ O&M Investment Needs + Backlog Investment Needs
Using the above
estimates of total investment needs for the 35 MCs, the corresponding figure for
the entire urban population is estimated. 5.4.2 Urban Mass Transport
Systems
Urban areas require not only the basic civic amenities
but also other services like urban transport and similar public goods and services.
An attempt is made to estimate the investment needs of providing (i) mass urban
transport systems and (ii) major road infrastructure in the form of inner and
outer ring roads for providing faster movement of vehicles. As these services
are meant to be provided in metropolitan cities/agglomerations, the 35 MCs with
urban agglomeration population more than one million population are considered
and categorized into Class AA, A and B based on the prevalent city (MC) population
as on 2001.
(i) The mass urban transport systems considered include:
elevated metro system for class AA and A cities (with service length of 100 and
50 km respectively) and bus rapid transit system for Class B cities (with a service
length of 100 km). Therefore, for all the cities, according to their city class,
the mass urban transport investment needs are estimated using the capital investment
norms provided in Bandai and Coppice (2004) together with the assumed service
length.
Mass Rapid Transport System Investment Needs = Norm * Service
length
(ii) The major road infrastructure needs include: Outer
and Inner ring roads for all class AA cities (with a service length of 100 km),
Inner ring roads for class A cities (with a service length of 100 km) and Inner
ring roads for class B cities (with service length of 50 km). The norms for Outer
and Inner investment needs of the roads / expressways per km length in urban areas
are formed using the actual cost estimates of their provision in Hyderabad11 .
Using these norms and coverage length, the investment needs of the cities for
the provision of road infrastructure/ expressways is estimated.
Table
44: Projection of Investment Requirement in Urban Areas |
Sl. No. | Infrastructure
Component | Investment
Need for Ten Years (2004-05 to 2013-14) (Rs Crore)* |
1 | Urban
basic services | Rs
3,25,010 | 2 | Mass
urban transport services | Rs
2,53,700 | 3 | Road
infrastructure services | Rs
49,500 | 4 | Total
urban services | Rs
6,28,210 | *:
At 2004-05 prices. | Road infrastructure Investment
Needs = Norm * Service length
Therefore, the total investment needs
of providing urban infrastructure services can be expressed as:
Total
Urban Investment Needs =Basic Amenities Investment Needs + Mass Rapid Transport
System Investment Needs + Major Road Infrastructure Investment Needs
The estimate given in Table 44 shows that on an average investment requirement
is around Rs 62,821 crore per annum at constant prices of 2004-05, which comes
to 2.2 per cent of GDP in year 2004-05. Here, it may be noted that total revenues
of ULBs remained stable at around 0.75 per cent of GDP, which is much less than
the requirement.
5.5 Estimate of Potential for Revenue Mobilisation
by ULBs
As mentioned earlier, shortfall in resources is on account
of the vertical imbalance as well as the nature of ULBs’ own operations.
The present section attempts to estimate the potential growth in ULB revenues
assuming a status quo in fiscal federal relationship. Thus, it would indicate
the size of revenue gap which would necessarily have to be met through major structural
reforms in the nature of altering fiscal federal relationship.
i)
For working out potential revenue, separate estimates were made for tax and non-tax
revenues and grants were assumed to grow at historical growth rate. For
working out tax revenue, estimates were made for major taxes viz., property,
advertisement and professional tax. For each tax, best performer among the 35
MCs was taken as the benchmark12 and potential revenue was worked out assuming
all ULBs are able to catch up with the benchmark13,14 .
ii) For working
non-tax revenue, the optimal performer in terms of proportion of cost recovery
was chosen as benchmark15 . In the previous chapter, cost recovery has been defined
as the ratio of user charges to revenue expenditure. Thus, to work out the potential
non-tax collections, the proportion of cost recovery of the optimal performer
was applied to aggregate revenue expenditures of ULBs in the country.
The sum of all above estimates provides the potential resource mobilization. However,
the entire resources cannot be assumed exclusively available for the provision
of core urban services or basic infrastructure services. Therefore, we use the
proportion of these resources that would reach to these services16 that give us
utilisable
Table
45: Projection of Potential Revenues of ULBs (2004-05) |
Sl. No. | Revenue
Source | Projected
Revenues (Rs Crores) | 1 | Property
Tax | 10,577 |
2 | Profession
Tax | 2,389 |
3 | Advertisement
Tax | 510 |
4 | All
Major Taxes (1+2+3) | 13,476 |
5 | Non
Tax (User charges & fees) | 9,746 |
6 | Grants
in Aid | 4,064 |
7 | Total
Potential Revenue (4+5+6) | 27,285 |
8 | Total
Utilisable revenue for Core Service provision(best case – 65%) | 17,736 |
9 | Total
Utilisable revenue for Core Service provision(conservative case – 35%) | 9,550 |
resources for service provision in the best case and in the average
case senerios. The estimates that have been made as per the procedures delineated
above for the year 2004-05 are set out in Table 45.
The above Table shows
that if current status in fiscal federal relationship continues, ULBs in India
together have the potential to raise revenues only up to Rs.27,285 crore in 2004-05.
This amounts to about 1.0 per cent of the GDP. Of these funds, in a best case
scenario, only 2/3rd would be available for asset creation after meeting the current
expenditure. Thus, the utilizable resources of the ULBs only for core service
provision even after attaining the benchmark figures of resource mobilization
fall short of investment needs (Rs.28,000 crore) to the tune of Rs.10,000 crore
in the best scenario and Rs.18,000 crore in the conservative (average) scenario
for the year 2004-05, which are substantial amounts that cannot be raised by ULBs
assuming status quo in all respects. There is, therefore, urgent need for reforms
to mobilize the funds needed for investment in urban infrastructure as estimated
in the previous section. Given the magnitude of the problem, it is necessary to
have a Centre-State-Local-Private Partnership (CSLPP) for development of urban
infrastructure.
5.6 Some Observations
The
key conclusions that emerge from the foregoing aggregative and Municipal Corporation-wise
analysis of municipal finances are: • Analysis of the revenue and expenditure
of the MCs reveals that most of them are generating revenue surplus and overall
resource gaps are not very large. At the same time, assessment of municipal finance
reveals that spending by all the municipal bodies is lower than that required
for providing a minimum level of civic amenities. The study observes that this
apparent contradiction of sound fiscal health and high level of underspending
is due to statutory obligations, whereby ULBs are generally bound to restrict
their expenditure to the resources available to them and also are not granted
liberal permission by State Governments to incur debt [Mathur and Thakur (2004)].
• In view of the above observation, the study has undertaken an assessment
of municipal finance in “normative terms”, besides the “standard
approach” of revenue or fiscal balance.
• A comparison
of per capita spending on core services by MCs in terms of the Zakaria Committee
norms indicates that the level of under-spending on an average works out to be
about 76 percent. Significantly, MCs belonging to Bihar and Uttar Pradesh are
the ones that have highest level of under-spending whereas those belonging to
Maharashtra, Gujarat are among the best performers.
• Reasons
for under-spending could be traced to MCs’ own operations (endogenous) as
well as to policy issues related to the upper tiers of Governments (exogenous).
Exogenous factors include dependency for resources on upper tiers of the Government
and inadequate delegation of revenue powers. Endogenous factors include inefficient
revenue (tax) administration, low cost recovery and poor quality of expenditure.
• MCs which have lower level of under-spending levels or better performance
have fared well on 4 out of 5 criteria viz.,dependency, decentralization,
tax administration and expenditure quality. On the other hand, MCs with ranking
“below average” on these 4 parameters are also the ones which have
been spending less on core civic amenities. Thus, the analysis suggests that restructuring
of revenue powers may be given top priority by State Governments if urban amenities
are to be improved.
• Though delegation of revenue powers is
a key factor, need for efficient revenue (tax) administration cannot be underplayed.
Examination of various taxes across the local bodies reveals that property and
profession taxes are important sources. (Octroi is the most important source of
revenue in municipal corporations belonging to Maharashtra and Gujarat). The local
bodies need to adequately tap the existing avenues. Unit area system of computation,
based on self-assessment principle, with respect to property tax needs to be extended
to all MCs and in the case of MCs where Octroi has been a major source they should
be adequately compensated when Octroi is abolished. Other sources like entertainment
tax, development charges, betterment levies etc. need to be tapped.
• Quality of expenditure, measured as establishment and administrative
expenditure as a proportion of total expenditure also turns out to be a major
factor in determining the ability of MCs to provide core services. Lower spending
on administrative purposes would leave more resources with the MCs to provide
for civic amenities. This calls for rationalization of the work force and reduction
in spending on establishment and administration.
• There is
a very weak link between under-spending and cost recovery. Interestingly, MCs
such as Mumbai, Surat and Pune which are among the best performers in terms of
other financial parameters, have below average user charges. This is because the
municipalities are resorting to lower use of user charges than would be desirable.
In fact, on an average the cost recovery is below 1/4th of the expenditure incurred
by the MCs. Considering the benefit principle17, there is a large scope for improvement
in levying User Charges. • It is apparent from the analysis that there
is a need to substantially increase the spending by local bodies. Given the constraints
faced by State Governments, it is essential that the MCs be granted access to
borrowed funds. At least there are two convincing arguments in favour of MCs going
for borrowed funds. First, there is a scope for MCs to go in for borrowed funds
as their current level of indebtedness is not very large. Secondly, there is a
scope to raise the user charges which are abysmally low across the States. Enhancement
of user charges would make the new projects undertaken with borrowed funds economically
viable and ensure that MCs are debt-sustainable.
• Investment
requirement for urban infrastructure has been estimated at about Rs.63,000 crore
per annum for the next ten year period (2004-05 to 2013-14), which forms about
2.2 per cent of GDP. Assuming the current status quo in fiscal federal relationship,
the study has projected that ULBs together have the potential to raise revenues
only up to about 1.0 per cent of the GDP.
• Given the magnitude
of the resource gap of the municipal sector as a whole, it is necessary to have
a Centre-State-Local-Private Partnership (CSLPP) for development of urban infrastructure.
Revisiting revenue assignment is the first task of a partnership.
*
Operating surplus is defined as current revenue - operating expenditure (operation
& maintenance including material as well as staff salaries). Given that the
accounts are not segregated in a manner required to measure operating surplus,
current expenditure net of interest payments has been used as operating expenditure
for computation.
4 Statutorily, municipal bodies cannot run
deficit and their revenue receipts must exceed revenue expenditure while presenting
budgets. It is quite possible that MCs might be compressing its expenditure in
order to meet the statutory requirement. Therefore, the surplus cannot be termed
as a genuine surplus.
5 It has been pointed out that since
a part of Municipal body expenditure is absorbed directly by the state government,
particularly relating to deputed employees, expenditure shown by them (municipal
bodies) is an underestimate. But this issue is not relevant for the bigger MCs
considered in the study. For instance, proportion of deputed employees is miniscule
in the case of Bangalore, Chennai and Hyderabad. 6 Budget
documents for the year 2002-03 and 2004-05 of Brihat Mumbai MC state that surplus
has resulted on account of efforts made by various economy measures to control
the expenditure and augment the revenue.7 Here,
the expenditure norm for storm water drainage has not been included, which is
not shown in the expenditure on services of the MCs. 8
The ability of the local body to collect taxes also depends upon delegation of
revenue powers.9 NIUA study (1998) states a 30 per cent backlog
in the year 1997-98. Given that the availability of civic amenities has not improved
since then and backlog would have increased, a conservative estimate of 33 per
cent backlog has been assumed.
10 Norms were worked out
from Arabi (2006).
11 The Hyderabad Urban Development
Authority (HUDA) has undertaken this major project in Hyderabad city and it shared
the unit costs information, which form the norms used here.
12
The average of top performer MCs of class AA and A cities has been taken as benchmark.
13 Computation of potential revenue would, however, be quite
an involved exercise which needs to take into account myriad number of factors
such as tax rate, tax base and tax exemption. Ignoring the tax rate factor, there
could be many ways to enhance the tax base and reduce the exemptions granted.
There are possibilities such as changing the base of the property tax, trade licensing
fee, advertisement fee etc., imposing vacant land tax, premium on Floor
Space Index (FSI), rationalization of user charges, formulae for inter-governmental
transfers etc. Exploring those is beyond the scope of the present study.
14 In an emerging global scenario, sunrise industries such as
IT are contributing towards employment and income generation in cities. While
income, turnover and services generated through these activities do not fall within
the revenue powers of the municipal bodies, there could be some indirect positive
contributions in terms of profession and property tax. But these aspects could
not be quantified in this study due to lack of detailed data. 15
It may be noted that cost recovery to the tune of 90 per cent of revenue expenditure,
as is found in the case of best performer MC (Vijayawada) is ridden with difficulties
as it leaves little room for revenue expenditure on establishment and administration
for service provision. An optimal performer MC (Bhopal) with a cost recovery
of 60 per cent of revenue expenditure is, therefore, taken as an appropriate benchmark.
16 Here, the average proportions of spending on core urban services
to total expenditure of average and best performer MC (Kolkata) of the 11 MCs,
for which continuous data were available, stood at 35% and 65% respectively. These
have been used as proxies.17 Benefit principle imply that services
that local governments provide should be paid for by those who benefit from them
(Bird, 1976). |
 IST,
IST,


