 IST,
IST,


2020-21 की तीसरी तिमाही (2020-21-Q3) के लिए सेवा और आधारभूत संरचना परिदृश्य का सर्वेक्षण
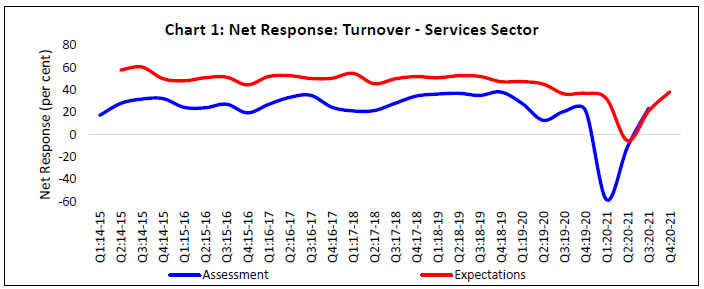
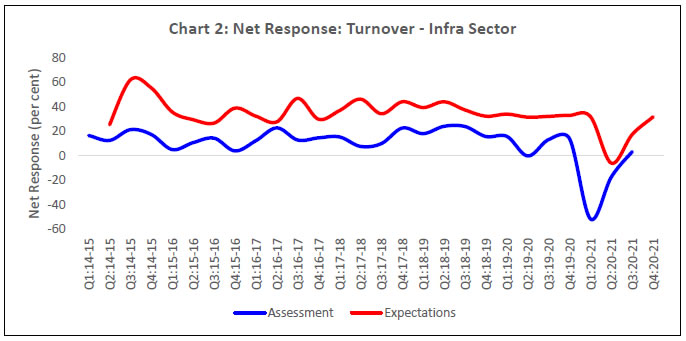
आज भारतीय रिज़र्व बैंक ने सेवा और आधारभूत संरचना परिदृश्य (एसआइओएस) के तिमाही सर्वेक्षण के 27वें चक्र का परिणाम जारी किया। इस आगे के सर्वेक्षण का संचालन 2014-15 की प्रथम तिमाही से किया जाता रहा है जिसमें सेवा और आधारभूत संरचना क्षेत्रों में संलग्न भारतीय कंपनियों का गुणात्मक मूल्यांकन और उनकी अपेक्षाओं की कैपचरिंग कारोबारी मानदंडों के एक सेट पर किया जाता है जो मांग स्थितियों, मूल्य स्थितियों और अन्य कारोबार की शर्तों से संबंधित होता है । सर्वेक्षण के इस चक्र में, जिसका संचालन अक्तूबर-दिसंबर 20201 में किया गया था, 526 कंपनियों ने 2020-21 की तीसरी तिमाहीके लिए अपना मूल्यांकन तथा 2020-21 की चौथी तिमाही के लिए अपेक्षाएं दीं। विशेष: क. सेवा क्षेत्र Q3:2020-21 की तीसरी तिमाही का मूल्यांकन
Q4:2020-21 के लिए अपेक्षाएं
 ख. आधारभूत संरचना क्षेज्ञ Q3:2020-21 की तीसरी तिमाही के लिए मूल्यांकन
Q4:2020-21 की चौथी तिमाही के लिए अपेक्षाएं
Note: Please see the excel file for time series data Services Sector
Infrastructure Sector
1 सर्वेक्षण की पृष्ठभूमि और उसकी विधियों के पक्ष का प्रकाशन आरबीआइ बुलेटिन के दिसंबर 2020 अंक में ‘सर्विसेज एंड इन्फ्रास्ट्रक्चर आउटलुक सर्वे-रीसेंट ट्रेंड्स’ आर्टिकल में किया गया है (वेब लिंक: /en/web/rbi/-/publications/rbi-bulletin/services-and-infrastructure-outlook-survey-recent-trends-19962) सर्वेक्षण के परिणाम उत्तरदाताओं के अभिमतों का प्रदर्शन करते हैं, जिन्हें भारतीय रिज़र्व बैंक साझा करे इसकी कोई अनिवार्यता नहीं है। 2 निवल उत्तर वह अंतर है जो आशावादिता रिपोर्ट करनेवाले उत्तरदाताओं और निराशावादिता रिपोर्ट करनेवाले उत्तरदाताओं के प्रतिशत के बीच में है। इसकी रेंज -100 से 100 के बीच है। शून्य से अधिक कोई भी मूल्य विस्तार/ आशावादिता का द्योतक है और शून्य से कम कोई भी मूल्य संकुचन/ निराशावादिता का द्योतक है। अन्य शब्दों में निवल उत्तर(नेट रिस्पॉन्स)=(I – D) जहाँ I ‘वृद्धि/ आशावादिता’ का प्रतिशत दर्शाता है और D ‘कमी/ निराशावादिता’ का प्रतिशत व्यक्त करता है और E ‘अपरिवर्तित/ समान’ का प्रतिशत दर्शाता है (अर्थात I+D+E=100)। उदाहरणार्थ, उत्पादन में वृद्धि आशावादिता का द्योतक है जबकि कच्ची सामग्री की लागत में कमी आसाशावादिता का द्योतक है। | |||||||||||||||||||||||||||||||||||||||||||||||||||||||||||||||||||||||||||||||||||||||||||||||||||||||||||||||||||||||||||||||||||||||||||||||||||||||||||||||||||||||||||||||||||||||||||||||||||||||||||||||||||||||||||||||||||||||||||||||||||||||||||||||||||||||||||||||||||||||||||||||||||||||||||||||||||||||||||||||||||||||||||||||||||||||||||||||||||||||||||||||||||||||||||||||||||||||||||||||||||||||||||||||||||||||||||||||||||||||||||||||||||||||||||||||||||||||||||||||||||||||||||||||||||||||||||||||||||||||||||||||||||||||||||||||||||||||||||||||||||||||||||||||||||||||||||||||||||||||||||||||||||||||||||||||||||||||||||||||||||||||||||||||||||||||||||||||||||||||||||||||||||||||||||||||||||||||||||||||||||||||||||||||||||||||||||||||||||||||||||||||||||||||||||||||||||||||||||||||||||||||||||||||||||||||||||||||||||||||||||||||||||||||||||||||||||||||||||||||||||||||||||||||||||||||||||||||||||||||||||||||||||||||||||||||||||||||||||||||||||||||||||||||||||||||||||||||||||||||

इस पेज को शेयर करें:


आरबीआई मोबाइल एप्लीकेशन इंस्टॉल करें और लेटेस्ट न्यूज़ का तुरंत एक्सेस पाएं!
हमारा ऐप इंस्टॉल करने के लिए QR कोड स्कैन करें


पृष्ठ अंतिम बार अपडेट किया गया:


