RbiSearchHeader

Press escape key to go back

पिछली खोज

थीम
थीम
टेक्स्ट का साइज़
टेक्स्ट का साइज़
S3

RbiAnnouncementWeb

RBI Announcements
RBI Announcements

असेट प्रकाशक

110381895

बैंक ऋण वितरण सर्वेक्षण, Q4:2023-24

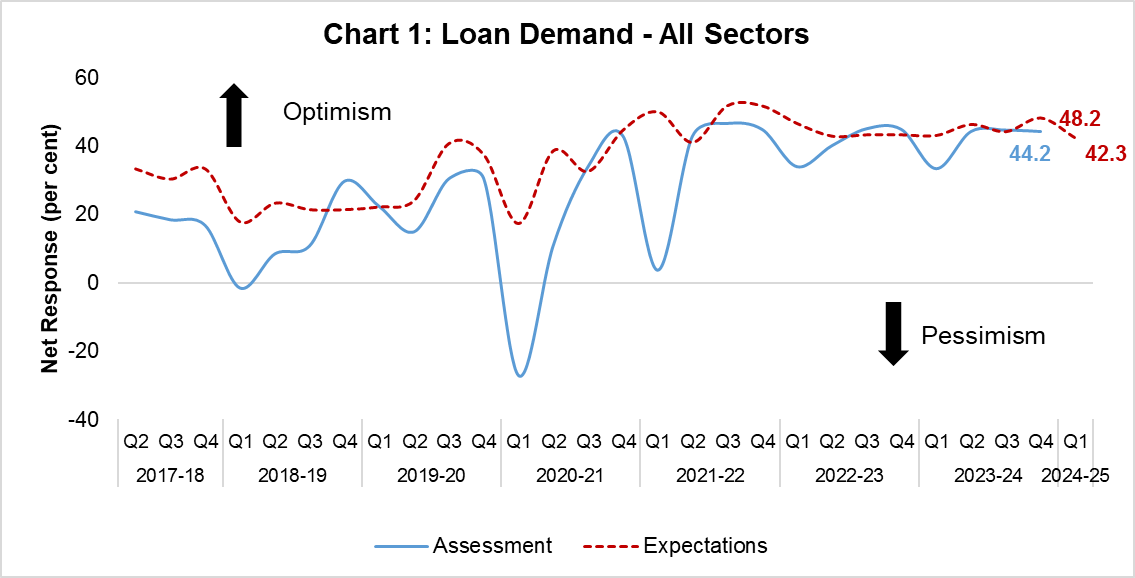
आज भारतीय रिज़र्व बैंक ने अपने तिमाही बैंक ऋण सर्वेक्षण के 27वें चक्र का परिणाम जारी किए[1], इसमें बड़े आर्थिक क्षेत्रों के लिए ऋण प्रतिमानों (जैसे-ऋण की मांग, ऋण के लिए नियम और शर्तें) के संबंध में बड़े अनुसूचित वाणिज्य बैंकों के गुणात्मक मूल्यांकन एवं प्रत्याशाओं को संग्रहित किया जाता है[2]। सर्वेक्षण के अद्यतन चक्र को 2023-24 की चौथी तिमाही में पूरा किया गया और वरिष्ठ ऋण अधिकारियों से ऋण के प्रतिमानों पर 2023-24 की चौथी तिमाही के लिए मूल्यांकन और 2024-25 की पहली, दूसरी तथा तीसरी तिमाही के लिए उनकी अपेक्षाओं को एकत्रित किया गया।

विशेष:

2023-24 की चौथी तिमाही के लिए मूल्यांकन

  • बैंकों ने 2023-24 की चौथी तिमाही में सभी मुख्य क्षेत्रों में सतत ऋण मांग का मूल्यांकन किया है (चार्ट 1और सारणी 1)
  • उत्तरदाताओं ने इस तिमाही में नियमों व शर्तों के आसान रहने का अनुमान किया है, जबकि व्यक्तिगत ऋणों की शर्तों मे थोड़ी सावधानी होने का मूल्यांकन किया है (सारणी 2)

. 2024-25 की पहली तिमाही के लिए अपेक्षाएं

  • बैंक 2024-25 की पहली तिमाही में ऋण की सम्पूर्ण मांग के प्रति अच्छी तरह से आशान्वित हैं, जिसमें पिछले तिमाही, जिसमे मौसमी चरम पर था, से थोड़ी कमी आने की आशा है ।    (सारणी 1).
  • वर्तमान आसान ऋण के नियमों एवं शर्तों के 2024-25 की पहली तिमाही में बरकरार रहने की उम्मीद है (सारणी 2)

. 2024-25 की दूसरी तथा तीसरी तिमाही के लिए अपेक्षाएं

  • बैंक वर्ष 2024 की अंत तक सभी मुख्य क्षेत्रों में ऋण की माँग के प्रति उत्साहित हैं (सारणी 3)
  • निवल आधार पर ऋण के नियमों एवं शर्तों में 2024-25 की तीसरी तिमाही आसान तक रहने की संभावना है। बहुसंख्यक बैंकों ने इसमें ‘कोई परिवर्तन न होने’ की आशा व्यक्त की है।  

Table 1: Sector-wise Loan Demand - Net Response[3]

(per cent)

Sector

Assessment Period

Expectations Period

Q3:2023-24

Q4:2023-24

Q4:2023-24

Q1:2024-25

All Sectors

44.6

44.2

48.2

42.3

Agriculture

26.7

35.0

31.7

31.7

Mining and Quarrying

13.8

13.3

17.2

6.7

Manufacturing

41.7

41.4

41.7

34.5

Infrastructure

33.3

35.0

35.0

26.7

Services

42.9

42.9

37.5

35.7

Retail/Personal

48.0

48.0

52.0

34.0


Table 2: Sector-wise Loan Terms and Conditions - Net Response

(per cent)

Sector

Assessment Period

Expectations Period

Q3:23-24

Q4:2023-24

Q4:2023-24

Q1:2024-25

All Sectors

16.1

14.8

19.6

18.5

Agriculture

13.3

15.5

18.3

17.2

Mining and Quarrying

-1.7

-5.2

5.2

-3.4

Manufacturing

17.2

15.0

20.7

13.3

Infrastructure

11.7

10.0

11.7

13.3

Services

14.3

14.3

17.9

16.1

Retail/Personal

20.0

16.7

18.0

16.7


Table 3: Sector-wise Expectations for Extended Period - Net Response

(per cent)

Sector

Loan Demand

Loan Terms and Conditions

Q2:2024-25

Q3:2024-25

Q2:2024-25

Q3:2024-25

All Sectors

38.9

44.4

18.5

20.4

Agriculture

36.7

38.3

18.3

18.3

Mining and Quarrying

3.4

17.2

-3.4

0.0

Manufacturing

35.0

40.0

16.7

16.7

Infrastructure

30.0

38.3

10.0

11.7

Services

33.9

44.6

10.7

14.3

Retail/Personal

32.8

41.4

10.3

12.1

Note: Please see the attached excel file for detailed time series data.


[1] पिछले सर्वेक्षण का प्रकाशन फ़रवरी 08, 2024 भारिबैं की वेबसाइट पर किया जा चुका है। सर्वेक्षण के परिणाम उत्तरदाताओं के अभिमतों का प्रदर्शन करते हैं, जो जरूरी नहीं कि भारतीय रिज़र्व बैंक के विचारों को दर्शाए।

[2] सर्वेक्षण प्रश्नावली का वितरण प्रमुख 30 अनुसूचित वाणिज्य बैंकों (एस.सी.बी) के बीच किया गया था,  जो भारत में एस.सी.बी द्वारा धारित क्रेडिट के 90 प्रतिशत के भागीदार हैं।

[3] Net Response (NR) is computed as the difference of percentage of banks reporting increase/optimism and those reporting decrease/pessimism in respective parameter. The weights of +1.0, 0.5, 0, -0.5 and -1.0 are assigned for computing NR from aggregate per cent responses on 5-point scale, i.e., substantial increase/ considerable easing, moderate increase/ somewhat easing, no change, moderate decrease/ somewhat tightening, substantial decrease/ considerable tightening for loan demand/loan terms and conditions parameters respectively. NR ranges between -100 to 100. Any value greater than zero indicates expansion/optimism and any value less than zero indicates contraction/pessimism. Increase in loan demand is considered optimism (Tables 1), while for loan terms and conditions, a positive value of net response indicates easy terms and conditions (Table 2).


RbiTtsCommonUtility

प्ले हो रहा है
सुनें

संबंधित एसेट

आरबीआई-इंस्टॉल-आरबीआई-सामग्री-वैश्विक

RbiSocialMediaUtility

आरबीआई मोबाइल एप्लीकेशन इंस्टॉल करें और लेटेस्ट न्यूज़ का तुरंत एक्सेस पाएं!

Scan Your QR code to Install our app

RbiWasItHelpfulUtility

क्या यह पेज उपयोगी था?