उपभोक्ता विश्वास सर्वेक्षण
|
आज, रिज़र्व बैंक ने अपने द्विमासिक उपभोक्ता विश्वास सर्वेक्षण (सीसीएस)[1] के मई 2024 दौर के परिणाम जारी किए। यह सर्वेक्षण 19 प्रमुख शहरों में सामान्य आर्थिक स्थिति, रोजगार परिदृश्य, समग्र मूल्य स्थिति और स्वयं की आय एवं व्यय पर वर्तमान धारणाएं (एक साल पहले की तुलना में) और एक वर्ष आगे की अपेक्षाएं प्राप्त करता है। सर्वेक्षण का नवीनतम दौर 2-11 मई, 2024 के दौरान आयोजित किया गया था, जिसमें 6,083 उत्तरदाताओं को शामिल किया गया था। इस सैंपल में महिला उत्तरदाताओं का हिस्सा 52.7 प्रतिशत रहा है।
Highlights:
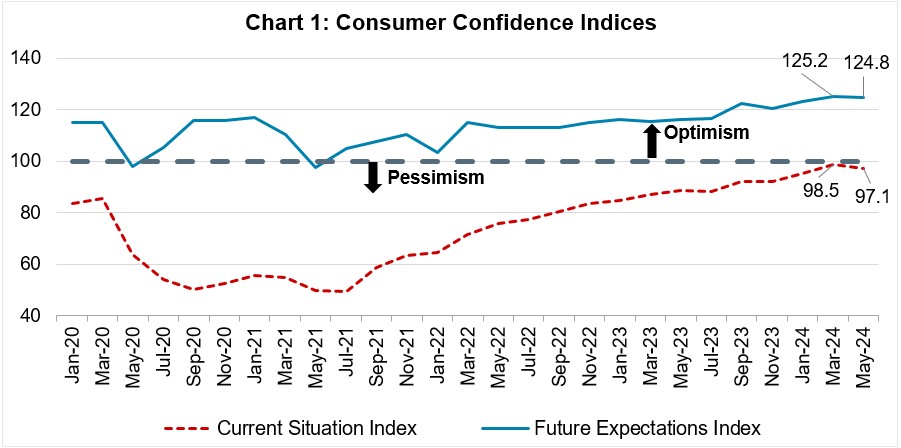
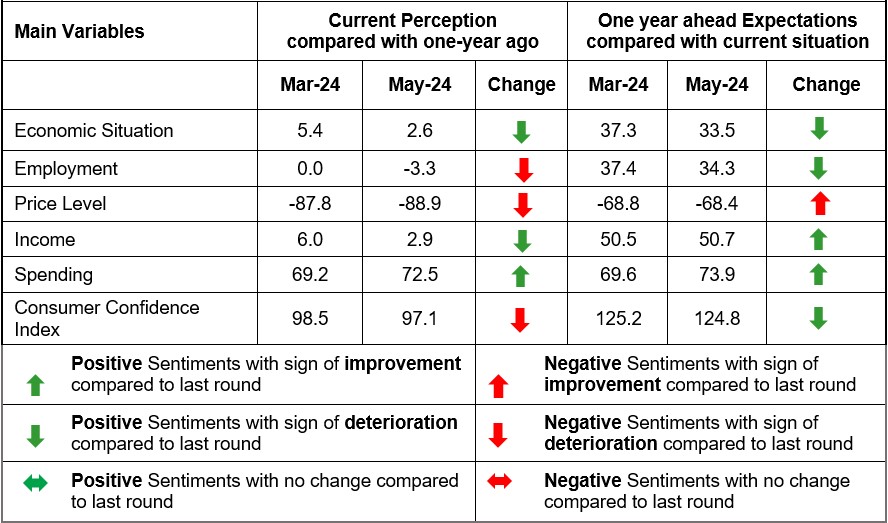
- वर्तमान अवधि के लिए उपभोक्ता विश्वास की उर्धगति में ठहराव देखा गया है, क्योंकि नवीनतम सर्वेक्षण दौर में खर्च को छोड़कर सभी मापदंडों पर धारणाओ में कुछ अवनति दर्ज की गई है; वर्तमान स्थिति सूचकांक (सीएसआई)[2]) दो महीने पहले के 98.5 से घटकर मई 2024 में 97.1 हो गया है (चार्ट 1; टेबल 1, 2, 3, 5 और 6)।
- ii. आगामी वर्ष के लिए, उपभोक्ता विश्वास आशावादी क्षेत्र में उच्च स्तर पर बना हुआ है, हालांकि सामान्य आर्थिक स्थिति और रोजगार परिदृश्य पर अपेक्षाकृत प्रशमित अपेक्षाओं के कारण इसमें मामूली गिरावट दर्ज की गयी है (टेबल 1 और 2)।
- iii. मई 2024 में भविष्य की अपेक्षा सूचकांक (एफईआई) 124.8 पर रहा है (पिछले सर्वेक्षण दौर में यह 125.2 पर था) (चार्ट 1)।
- उपभोक्ताओं को अपेक्षा है कि पिछले सर्वेक्षण दौर की तुलना में अगले एक वर्ष में कुल खर्च में अधिक वृद्धि होगी; अधिक उत्तरदाताओं को आवश्यक और गैर-आवश्यक दोनों तरह के खर्चों में वृद्धि की उम्मीद है (टेबल 6, 7 और 8)।
नोट: कृपया समय श्रृंखला डेटा के लिए एक्सेल फ़ाइल देखें[3]
| Summary based on Net Responses[4] |
|
|
|
Table 1: Perceptions and Expectations on the General Economic Situation
|
|
(Percentage responses)
|
|
Survey Round
|
Current Perception
|
One year ahead Expectation
|
|
Increased
|
Remained Same
|
Decreased
|
Net Response
|
Will Increase
|
Will Remain Same
|
Will Decrease
|
Net Response
|
|
May-23
|
32.1
|
19.0
|
48.9
|
-16.8
|
51.0
|
15.8
|
33.2
|
17.8
|
|
Jul-23
|
30.4
|
18.5
|
51.1
|
-20.7
|
51.1
|
15.1
|
33.8
|
17.2
|
|
Sep-23
|
36.1
|
19.9
|
44.0
|
-7.9
|
56.8
|
15.1
|
28.1
|
28.6
|
|
Nov-23
|
33.1
|
22.5
|
44.4
|
-11.3
|
54.3
|
17.2
|
28.5
|
25.7
|
|
Jan-24
|
37.5
|
22.3
|
40.2
|
-2.7
|
59.2
|
15.3
|
25.5
|
33.7
|
|
Mar-24
|
41.2
|
23.1
|
35.8
|
5.4
|
60.7
|
15.8
|
23.4
|
37.3
|
|
May-24
|
40.0
|
22.6
|
37.4
|
2.6
|
59.0
|
15.6
|
25.4
|
33.5
|
|
Table 2: Perceptions and Expectations on Employment
|
|
(Percentage responses)
|
|
Survey Round
|
Current Perception
|
One year ahead Expectation
|
|
Increased
|
Remained Same
|
Decreased
|
Net Response
|
Will Increase
|
Will Remain Same
|
Will Decrease
|
Net Response
|
|
May-23
|
32.1
|
20.2
|
47.7
|
-15.6
|
52.1
|
18.7
|
29.2
|
22.9
|
|
Jul-23
|
30.8
|
21.0
|
48.2
|
-17.5
|
51.4
|
18.3
|
30.3
|
21.1
|
|
Sep-23
|
34.0
|
21.8
|
44.2
|
-10.2
|
55.8
|
18.1
|
26.2
|
29.6
|
|
Nov-23
|
32.3
|
23.0
|
44.7
|
-12.4
|
53.6
|
19.7
|
26.8
|
26.9
|
|
Jan-24
|
35.3
|
23.4
|
41.3
|
-6.0
|
58.7
|
17.4
|
24.0
|
34.7
|
|
Mar-24
|
38.1
|
23.8
|
38.1
|
0.0
|
60.0
|
17.4
|
22.6
|
37.4
|
|
May-24
|
36.8
|
23.0
|
40.2
|
-3.3
|
58.0
|
18.3
|
23.7
|
34.3
|
|
Table 3: Perceptions and Expectations on Price Level
|
|
(Percentage responses)
|
|
Survey Round
|
Current Perception
|
One year ahead Expectation
|
|
Increased
|
Remained Same
|
Decreased
|
Net Response
|
Will Increase
|
Will Remain Same
|
Will Decrease
|
Net Response
|
|
May-23
|
92.2
|
6.4
|
1.4
|
-90.8
|
82.7
|
10.0
|
7.3
|
-75.4
|
|
Jul-23
|
92.7
|
6.0
|
1.3
|
-91.4
|
80.9
|
10.2
|
8.9
|
-72.0
|
|
Sep-23
|
91.8
|
6.4
|
1.8
|
-90.0
|
78.4
|
9.9
|
11.7
|
-66.8
|
|
Nov-23
|
91.3
|
7.3
|
1.4
|
-89.9
|
81.0
|
10.2
|
8.8
|
-72.3
|
|
Jan-24
|
90.8
|
7.2
|
2.0
|
-88.9
|
80.5
|
10.4
|
9.1
|
-71.4
|
|
Mar-24
|
89.2
|
9.3
|
1.4
|
-87.8
|
78.2
|
12.5
|
9.4
|
-68.8
|
|
May-24
|
90.5
|
7.8
|
1.6
|
-88.9
|
79.0
|
10.4
|
10.6
|
-68.4
|
|
Table 4: Perceptions and Expectations on Rate of Change in Price Level (Inflation)*
|
|
(Percentage responses)
|
|
Survey Round
|
Current Perception
|
One year ahead Expectation
|
|
Increased
|
Remained Same
|
Decreased
|
Net Response
|
Will Increase
|
Will Remain Same
|
Will Decrease
|
Net Response
|
|
May-23
|
84.0
|
12.5
|
3.4
|
-80.6
|
81.8
|
14.1
|
4.1
|
-77.8
|
|
Jul-23
|
84.5
|
11.8
|
3.7
|
-80.8
|
80.8
|
14.8
|
4.4
|
-76.4
|
|
Sep-23
|
82.5
|
13.4
|
4.2
|
-78.3
|
79.4
|
15.8
|
4.8
|
-74.6
|
|
Nov-23
|
81.8
|
13.6
|
4.6
|
-77.2
|
80.1
|
14.7
|
5.2
|
-75.0
|
|
Jan-24
|
79.5
|
15.7
|
4.8
|
-74.7
|
77.2
|
17.8
|
5.0
|
-72.2
|
|
Mar-24
|
77.0
|
17.6
|
5.4
|
-71.6
|
76.7
|
18.3
|
5.0
|
-71.7
|
|
May-24
|
77.8
|
15.1
|
7.1
|
-70.6
|
79.1
|
16.0
|
4.9
|
-74.3
|
|
*Applicable only for those respondents who felt price has increased/price will increase.
|
|
Table 5: Perceptions and Expectations on Income
|
|
(Percentage responses)
|
|
Survey Round
|
Current Perception
|
One year ahead Expectation
|
|
Increased
|
Remained Same
|
Decreased
|
Net Response
|
Will Increase
|
Will Remain Same
|
Will Decrease
|
Net Response
|
|
May-23
|
23.9
|
49.7
|
26.3
|
-2.4
|
53.8
|
39.4
|
6.9
|
46.9
|
|
Jul-23
|
25.4
|
49.9
|
24.8
|
0.6
|
54.7
|
38.6
|
6.7
|
48.0
|
|
Sep-23
|
25.0
|
49.8
|
25.2
|
-0.3
|
55.7
|
37.8
|
6.5
|
49.2
|
|
Nov-23
|
27.2
|
50.1
|
22.7
|
4.5
|
57.9
|
36.0
|
6.1
|
51.8
|
|
Jan-24
|
26.4
|
51.5
|
22.1
|
4.2
|
56.3
|
36.9
|
6.8
|
49.4
|
|
Mar-24
|
27.7
|
50.6
|
21.7
|
6.0
|
56.7
|
37.2
|
6.1
|
50.5
|
|
May-24
|
25.3
|
52.3
|
22.4
|
2.9
|
56.9
|
36.9
|
6.2
|
50.7
|
|
Table 6: Perceptions and Expectations on Spending
|
|
(Percentage responses)
|
|
Survey Round
|
Current Perception
|
One year ahead Expectation
|
|
Increased
|
Remained Same
|
Decreased
|
Net Response
|
Will Increase
|
Will Remain Same
|
Will Decrease
|
Net Response
|
|
May-23
|
73.4
|
21.3
|
5.3
|
68.1
|
73.8
|
21.7
|
4.6
|
69.2
|
|
Jul-23
|
74.5
|
20.5
|
5.0
|
69.6
|
73.8
|
21.3
|
4.8
|
69.0
|
|
Sep-23
|
74.6
|
20.2
|
5.2
|
69.4
|
75.2
|
20.3
|
4.6
|
70.6
|
|
Nov-23
|
74.8
|
20.6
|
4.6
|
70.1
|
75.0
|
21.0
|
4.1
|
70.9
|
|
Jan-24
|
73.2
|
22.3
|
4.5
|
68.6
|
74.2
|
20.9
|
5.0
|
69.2
|
|
Mar-24
|
73.1
|
23.1
|
3.8
|
69.2
|
73.9
|
21.7
|
4.3
|
69.6
|
|
May-24
|
76.2
|
20.1
|
3.8
|
72.5
|
77.9
|
18.1
|
4.0
|
73.9
|
|
Table 7: Perceptions and Expectations on Spending- Essential Items
|
|
(Percentage responses)
|
|
Survey Round
|
Current Perception
|
One year ahead Expectation
|
|
Increased
|
Remained Same
|
Decreased
|
Net Response
|
Will Increase
|
Will Remain Same
|
Will Decrease
|
Net Response
|
|
May-23
|
84.0
|
12.8
|
3.2
|
80.8
|
81.3
|
15.2
|
3.5
|
77.8
|
|
Jul-23
|
85.3
|
11.8
|
3.0
|
82.3
|
81.0
|
15.5
|
3.5
|
77.5
|
|
Sep-23
|
84.9
|
11.9
|
3.2
|
81.7
|
82.0
|
14.4
|
3.6
|
78.4
|
|
Nov-23
|
85.7
|
11.4
|
2.9
|
82.7
|
82.3
|
14.4
|
3.4
|
78.9
|
|
Jan-24
|
84.1
|
12.9
|
3.0
|
81.1
|
81.8
|
14.6
|
3.6
|
78.2
|
|
Mar-24
|
84.5
|
13.0
|
2.5
|
82.0
|
82.5
|
14.5
|
3.0
|
79.5
|
|
May-24
|
85.6
|
11.8
|
2.7
|
82.9
|
84.7
|
12.3
|
3.1
|
81.6
|
|
Table 8: Perceptions and Expectations on Spending- Non-Essential Items
|
|
(Percentage responses)
|
|
Survey Round
|
Current Perception
|
One year ahead Expectation
|
|
Increased
|
Remained Same
|
Decreased
|
Net Response
|
Will Increase
|
Will Remain Same
|
Will Decrease
|
Net Response
|
|
May-23
|
25.8
|
38.2
|
36.1
|
-10.3
|
35.3
|
37.5
|
27.2
|
8.2
|
|
Jul-23
|
26.6
|
36.9
|
36.5
|
-10.0
|
34.8
|
37.6
|
27.6
|
7.3
|
|
Sep-23
|
23.4
|
38.5
|
38.2
|
-14.8
|
33.0
|
38.2
|
28.8
|
4.2
|
|
Nov-23
|
25.2
|
36.6
|
38.2
|
-13.0
|
34.1
|
36.8
|
29.0
|
5.1
|
|
Jan-24
|
27.2
|
36.2
|
36.6
|
-9.4
|
34.6
|
36.4
|
29.0
|
5.5
|
|
Mar-24
|
29.2
|
37.6
|
33.2
|
-4.1
|
35.7
|
37.6
|
26.7
|
9.0
|
|
May-24
|
30.5
|
35.4
|
34.1
|
-3.7
|
37.4
|
35.2
|
27.4
|
9.9
|
[1] सर्वेक्षण के परिणाम उत्तरदाताओं के विचारों को दर्शाते हैं, जो जरूरी नहीं कि रिज़र्व बैंक द्वारा साझा किए गए हों। पिछले सर्वेक्षण चक्र के परिणाम बैंक की वेबसाइट पर अप्रैल 05, 2024को जारी किए गए थे।
[2] सीएसआई और एफईआई को क्रमशः आर्थिक स्थिति, आय, खर्च, रोजगार और वर्तमान अवधि (एक साल पहले की तुलना में) और एक साल आगे के लिए मूल्य स्तर पर शुद्ध प्रतिक्रियाओं के आधार पर संकलित किया जाता है। सीएसआई और एफईआई = 100 + उपरोक्त मापदंडों की शुद्ध प्रतिक्रियाओं का औसत।
[3] सर्वेक्षण के पिछले चक्रों के लिए यूनिट-स्तर के डेटा, बैंक के भारतीय अर्थव्यवस्था पर डेटाबेस (DBIE) पोर्टल (वेबलिंक : https://dbie.rbi.org.in/#/dbie/home) पर 'यूनिट-स्तर डेटा' शीर्षक के अंतर्गत उपलब्ध हैं )|
[4] ‘शुद्ध प्रतिक्रिया' आशावाद की रिपोर्ट करने वाले उत्तरदाताओं के प्रतिशत और निराशावाद की रिपोर्ट करने वालों के बीच का अंतर है। यह -100 और 100 के बीच होता है। शून्य से अधिक कोई भी मान विस्तार/आशावाद को दर्शाता है और शून्य से कम मान संकुचन/निराशावाद को दर्शाता है।
|
 IST,
IST,