RbiSearchHeader

Press escape key to go back

पिछली खोज

थीम
थीम
टेक्स्ट का साइज़
टेक्स्ट का साइज़
S3

RbiAnnouncementWeb

RBI Announcements
RBI Announcements

असेट प्रकाशक

111686570

मुद्रास्फीति पर घरेलू अपेक्षाओं का सर्वेक्षण

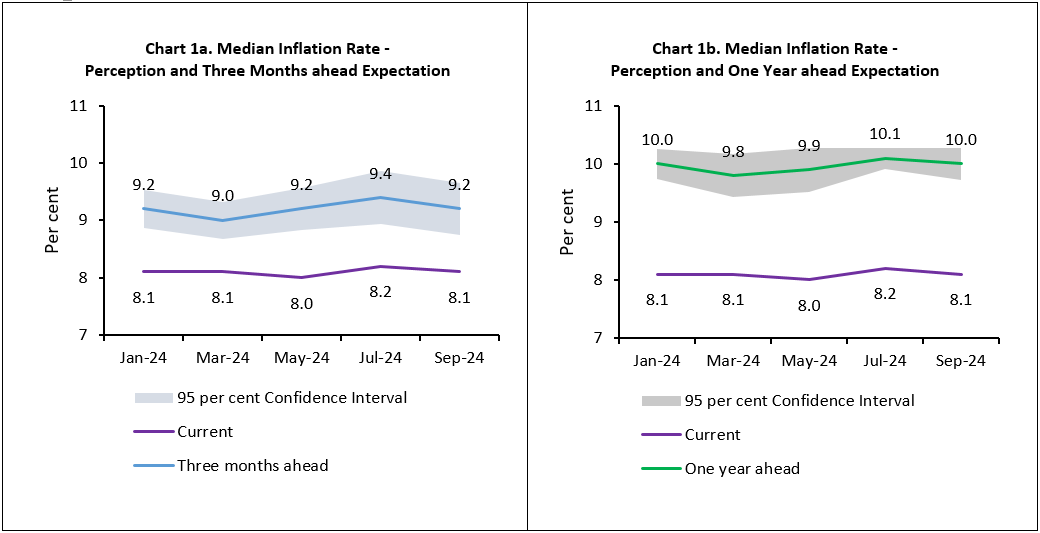
आज, रिज़र्व बैंक ने सितंबर 2024 के अपने द्विमासिक मुद्रास्फीति पर घरेलू अपेक्षाओं का सर्वेक्षण (आईईएसएच)1 2 के परिणाम जारी किए हैं। यह सर्वेक्षण 1-10 सितंबर, 2024 के दौरान 19 प्रमुख शहरों में किया गया था, जिसमें 6,076 वैध प्रतिक्रियाएँ मिलीं, और महिला भागीदारी 52.6 प्रतिशत रही।

मुख्य विशेषताएँ:

  1. सर्वेक्षण के जुलाई 2024 दौर की तुलना में, परिवारों की वर्तमान मुद्रास्फीति की औसत धारणा 10 आधार अंक (बीपीएस) से घट कर 8.1 प्रतिशत हो गई; आगामी तीन महीने और एक वर्ष की अवधि के लिए मुद्रास्फीति पर उनकी अपेक्षाओं में क्रमश: 20 एवं 10 आधार अंक (बीपीएस) की कमी आई है [चार्ट 1(ए) और 1(बी); टेबल 3]।
  2. ii. अल्पकालिक और एक वर्ष आगे दोनों अवधियों के लिए, सामान्य कीमतों और मुद्रास्फीति में वृद्धि की उम्मीद करने वाले उत्तरदाताओं का प्रतिशत पिछले सर्वेक्षण दौर से कम हुआ है [टेबल 1 (ए) और 1 (बी)]।
  3. iii. सभी उत्पाद समूहों में कीमत और मुद्रास्फीति का दबाव कम हुआ है [टेबल 1 (ए) और 1 (बी)]।
  4. iv. महिला उत्तरदाताओं का मुद्रास्फीति पर आकलन तथा अपेक्षाएं अपने पुरुष समकक्षों की तुलना में थोड़ी कम रही [टेबल 2]।
Chart 1a and 1b

नोट: कृपया समय क्षृंखला डेटा के लिए एक्सेल फ़ाइल देखें।3

Table 1(a): Product-wise Expectations of Prices for Three Months ahead

(Percentage of Respondents)

Survey period ended

Sep-23

Mar-24

May-24

Jul-24

Sep-24

General

Estimate

SE

Estimate

SE

Estimate

SE

Estimate

SE

Estimate

SE

Prices will increase

74.2

0.97

76.5

0.85

80.6

0.81

82.3

0.77

79.7

0.89

Price increase more than current rate

49.5

1.1

53.1

1.08

59.1

1.13

60.5

1.13

55.5

1.21

Price increase similar to current rate

20

0.8

18.2

0.79

17.5

0.83

17.3

0.86

19.2

0.86

Price increase less than current rate

4.7

0.47

5.2

0.44

4

0.43

4.5

0.48

5

0.55

No changes in prices

20.7

0.88

19.6

0.8

16.6

0.77

14.6

0.71

17.9

0.85

Decline in prices

5

0.52

3.9

0.38

2.8

0.32

3.1

0.37

2.5

0.32

Food Product


Prices will increase

75.4

0.87

76.7

0.81

81.8

0.74

84.2

0.7

83.9

0.75

Price increase more than current rate

55.1

1.05

54.4

1

61

1.07

62.1

1.03

60.7

1.07

Price increase similar to current rate

15.1

0.71

15.7

0.69

15.3

0.74

16

0.75

16.7

0.77

Price increase less than current rate

5.3

0.46

6.6

0.5

5.5

0.46

6.1

0.52

6.6

0.58

No changes in prices

13.2

0.68

15.1

0.68

12.1

0.64

10.2

0.57

11.2

0.67

Decline in prices

11.3

0.66

8.2

0.54

6.1

0.46

5.6

0.47

4.9

0.42

Non- Food Product


Prices will increase

69.2

0.93

71.5

0.87

75

0.85

77

0.81

76.1

0.92

Price increase more than current rate

47.1

1.04

48.9

1.01

53.7

1.11

54.5

1.1

52.4

1.11

Price increase similar to current rate

16.7

0.72

16.2

0.71

15.6

0.72

16.2

0.79

17.7

0.78

Price increase less than current rate

5.4

0.51

6.4

0.48

5.7

0.5

6.2

0.52

6.1

0.55

No changes in prices

20.5

0.77

20.9

0.8

19.3

0.78

17.6

0.74

19.1

0.85

Decline in prices

10.3

0.66

7.7

0.51

5.7

0.43

5.4

0.48

4.7

0.42

Household Durables


Prices will increase

62.2

0.99

64.7

0.92

68.2

0.94

68.2

0.97

64.9

1.03

Price increase more than current rate

43.2

1.05

43.8

1.01

48.3

1.1

49.6

1.09

45.9

1.11

Price increase similar to current rate

14.1

0.65

15.5

0.7

15.2

0.74

13.9

0.73

14.2

0.71

Price increase less than current rate

4.9

0.43

5.4

0.44

4.7

0.44

4.7

0.44

4.7

0.48

No changes in prices

26.4

0.88

26.1

0.85

23.4

0.86

23.4

0.88

25.2

0.97

Decline in prices

11.3

0.64

9.2

0.57

8.5

0.53

8.4

0.58

9.8

0.55

Cost of Housing


Prices will increase

75.1

0.95

76.9

0.83

80.4

0.81

78.6

0.84

77.7

0.88

Price increase more than current rate

54.3

1.09

55.8

1.07

59.3

1.06

59.6

1.07

56.9

1.11

Price increase similar to current rate

16.3

0.66

16.4

0.74

16.7

0.77

14.8

0.78

16.3

0.75

Price increase less than current rate

4.5

0.43

4.7

0.4

4.3

0.44

4.1

0.45

4.5

0.48

No changes in prices

20.9

0.9

19.6

0.78

16.7

0.77

18.2

0.78

19.1

0.87

Decline in prices

4.1

0.46

3.5

0.36

3

0.34

3.2

0.37

3.3

0.35

Cost of Services


Prices will increase

63

1.04

65

0.97

68.6

0.98

71

0.95

66.9

1.04

Price increase more than current rate

44.7

1.05

45.5

1.09

49.2

1.12

52.7

1.12

46.9

1.15

Price increase similar to current rate

14.5

0.68

14.4

0.7

14.4

0.68

13.6

0.7

15.5

0.73

Price increase less than current rate

3.9

0.4

5.2

0.45

5

0.46

4.6

0.46

4.5

0.46

No changes in prices

31.2

0.99

30.1

0.92

27.3

0.94

25.3

0.9

29.8

1.01

Decline in prices

5.7

0.54

4.8

0.43

4.1

0.39

3.7

0.38

3.2

0.35

Note:

1. The table provides estimates and standard errors (SE) for qualitative responses.

2. Constituent items may not add up to the corresponding total, due to rounding off.


Table 1(b): Product-wise Expectations of Prices for One Year ahead

(Percentage of Respondents)

Survey period ended

Sep-23

Mar-24

May-24

Jul-24

Sep-24

General

Estimate

SE

Estimate

SE

Estimate

SE

Estimate

SE

Estimate

SE

Prices will increase

86.2

0.74

87.4

0.67

89.1

0.64

90.6

0.6

89.4

0.73

Price increase more than current rate

62.2

1.05

64.7

1.08

67.9

1.14

68.6

1.12

66.5

1.2

Price increase similar to current rate

19.9

0.81

18.5

0.83

17.8

0.9

18.3

0.86

18.6

0.91

Price increase less than current rate

4.1

0.43

4.2

0.41

3.5

0.41

3.7

0.43

4.4

0.5

No changes in prices

9.6

0.59

9.7

0.59

7.9

0.56

6.6

0.5

8.6

0.67

Decline in prices

4.2

0.48

2.9

0.35

3

0.34

2.9

0.35

2

0.28

Food Product


Prices will increase

82.8

0.8

84.5

0.73

86

0.68

87.1

0.65

86.6

0.78

Price increase more than current rate

57.9

1.09

59.5

1.1

62.8

1.1

63.5

1.09

61.8

1.2

Price increase similar to current rate

19.7

0.82

19.8

0.8

18.3

0.86

19

0.84

19.2

0.85

Price increase less than current rate

5.3

0.48

5.2

0.45

4.9

0.49

4.6

0.48

5.6

0.55

No changes in prices

9.6

0.58

10.1

0.61

9.3

0.58

7.9

0.52

9.7

0.66

Decline in prices

7.6

0.6

5.4

0.44

4.7

0.39

5

0.43

3.8

0.38

Non- Food Product


Prices will increase

78.9

0.83

81.1

0.76

82.1

0.79

82.9

0.77

82.4

0.85

Price increase more than current rate

54.7

1.05

56.3

1.09

59.8

1.13

61.2

1.12

58.3

1.2

Price increase similar to current rate

19.7

0.78

19.5

0.82

17.3

0.8

16.9

0.8

18.5

0.83

Price increase less than current rate

4.5

0.44

5.3

0.47

5.1

0.47

4.8

0.46

5.6

0.57

No changes in prices

13.9

0.66

14.1

0.69

12.9

0.68

12.4

0.64

14

0.77

Decline in prices

7.2

0.57

4.8

0.44

5

0.44

4.7

0.44

3.6

0.37

Household Durables


Prices will increase

73.9

0.91

74.5

0.83

76.8

0.83

77.4

0.83

76.2

0.93

Price increase more than current rate

52.4

1.04

52.3

1.06

56

1.12

56.6

1.12

54.5

1.16

Price increase similar to current rate

17.3

0.71

17.3

0.76

16.4

0.79

16.1

0.76

16.5

0.79

Price increase less than current rate

4.1

0.42

5

0.45

4.4

0.44

4.8

0.49

5.1

0.5

No changes in prices

18.5

0.76

18.1

0.76

16.6

0.72

16.3

0.73

17.3

0.79

Decline in prices

7.7

0.56

7.4

0.51

6.6

0.47

6.3

0.48

6.5

0.49

Cost of Housing


Prices will increase

86.1

0.7

87.2

0.66

89.2

0.64

88.2

0.66

87.7

0.74

Price increase more than current rate

65

1.04

65.6

1.01

68.7

1.02

66.6

1.05

65.9

1.07

Price increase similar to current rate

16.9

0.73

17.2

0.74

16.3

0.75

17.7

0.8

17

0.79

Price increase less than current rate

4.2

0.42

4.4

0.39

4.2

0.45

3.9

0.43

4.8

0.53

No changes in prices

10.1

0.56

9.5

0.57

8.4

0.57

8.6

0.55

8.9

0.6

Decline in prices

3.8

0.43

3.3

0.36

2.4

0.31

3.2

0.36

3.4

0.4

Cost of Services


Prices will increase

78.4

0.86

80.1

0.78

82.1

0.77

83.4

0.76

82.2

0.85

Price increase more than current rate

56.2

1.05

56.3

1.08

58.9

1.13

61.6

1.17

58.8

1.18

Price increase similar to current rate

18

0.7

18.9

0.78

18.6

0.83

17.4

0.82

17.9

0.8

Price increase less than current rate

4.2

0.43

4.9

0.45

4.6

0.44

4.4

0.45

5.5

0.57

No changes in prices

17.1

0.74

16

0.71

14.7

0.71

13.2

0.67

15.3

0.8

Decline in prices

4.4

0.48

3.9

0.38

3.2

0.34

3.4

0.39

2.4

0.3

Note:

1. The table provides estimates and standard errors (SE) for qualitative responses.

2. Constituent items may not add up to the corresponding total, due to rounding off.


Table 2: Inflation Expectations of Various Groups: Sep-24


Current Perception

Three Months ahead Expectation

One Year ahead Expectation

Mean

Median

Mean

Median

Mean

Median

Estimate

SE

Estimate

SE

Estimate

SE

Estimate

SE

Estimate

SE

Estimate

SE

Overall

8.6

0.09

8.1

0.13

9.6

0.1

9.2

0.23

9.6

0.12

10

0.14

Gender-wise


Male

8.9

0.13

8.3

0.17

9.7

0.14

9.4

0.32

9.7

0.16

10.1

0.16

Female

8.5

0.12

8

0.17

9.5

0.13

9.2

0.31

9.5

0.16

10

0.18

Category-wise


Financial Sector Employees

9

0.56

8.6

0.8

9.7

0.61

9.4

0.92

10.4

0.66

10.3

1.17

Other Employees

8.6

0.16

8.1

0.21

9.5

0.17

9

0.28

9.6

0.2

10

0.23

Self Employed

8.9

0.19

8.4

0.24

9.7

0.2

9.8

0.4

9.6

0.25

10.1

0.3

Homemaker

8.4

0.14

8

0.2

9.6

0.16

9.4

0.37

9.5

0.19

10

0.21

Retired Persons

10.2

0.47

9.8

0.65

10.7

0.46

10.4

0.63

10.4

0.52

10.6

0.82

Daily Workers

9.2

0.24

9.1

0.4

10.1

0.25

10.1

0.4

10.1

0.31

10.3

0.29

Other category

7.9

0.19

7.2

0.23

8.8

0.21

7.9

0.21

8.8

0.26

8.6

0.3

Age Group-wise


Up to 25 years

8.1

0.15

7.4

0.19

9

0.16

8.3

0.18

9.4

0.19

9.4

0.32

25 to 30 years

8.5

0.17

8.1

0.21

9.5

0.19

9.1

0.31

9.5

0.22

9.9

0.25

30 to 35 years

8.5

0.18

8.1

0.22

9.5

0.2

9.2

0.37

9.6

0.24

10.1

0.23

35 to 40 years

8.8

0.2

8.4

0.26

9.7

0.21

9.6

0.48

9.6

0.26

10

0.33

40 to 45 years

8.8

0.2

8.2

0.33

9.6

0.21

9.4

0.51

9.3

0.27

9.7

0.44

45 to 50 years

8.9

0.21

8.7

0.33

10.1

0.24

10.2

0.25

9.7

0.3

10.2

0.26

50 to 55 years

9.2

0.3

8.8

0.52

10

0.32

9.8

0.57

10.1

0.36

10.2

0.35

55 to 60 years

9.5

0.29

9.4

0.36

10.6

0.32

10.5

0.24

10.4

0.38

10.7

0.41

60 years and above

9.5

0.29

9.3

0.69

10.3

0.32

10.1

0.37

9.9

0.37

10.1

0.45

City-wise


Ahmedabad

7.6

0.27

6.7

0.46

8.9

0.37

7.8

0.45

8.5

0.48

8.3

0.61

Bengaluru

6.8

0.22

5.7

0.14

8.2

0.23

7.3

0.33

8.8

0.25

8.2

0.35

Bhopal

8.8

0.43

7.1

0.77

10.4

0.61

10.1

0.71

9.8

0.59

10.1

0.78

Bhubaneswar

9

0.42

8.9

1.22

10.9

0.46

10.5

0.53

10.7

0.73

10

1

Chennai

8.9

0.32

9.4

0.61

9.7

0.47

10.1

0.66

10.7

0.56

12.3

0.64

Delhi

8.8

0.21

8.7

0.3

9.5

0.23

9.8

0.47

9.6

0.24

10.1

0.31

Guwahati

9.2

0.52

9.9

0.39

9.6

0.63

10.4

0.69

9.5

0.73

10.7

0.98

Hyderabad

7.8

0.28

7.1

0.27

9.2

0.31

8.5

0.32

9.4

0.42

9.9

0.44

Jaipur

7.9

0.51

7.6

0.6

8.4

0.56

7.8

0.64

7.5

0.71

7.8

0.94

Jammu

9.7

1.37

9.2

1.36

9.2

1.14

9.2

2

8.7

1.67

8.8

2.52

Kolkata

11

0.35

10.5

0.22

11.8

0.35

11.9

1.03

11.6

0.35

12.2

1.02

Lucknow

9

0.46

8.8

0.75

9.7

0.51

9.3

0.71

9.3

0.45

9

0.72

Mumbai

9

0.26

8.3

0.23

9.8

0.29

9.6

0.44

9.3

0.39

10.1

0.32

Nagpur

8

0.42

7.5

0.71

9.2

0.47

8.5

0.65

9.2

0.74

9.9

0.79

Patna

6.8

0.23

6.7

0.36

7.4

0.3

7.4

0.44

7.2

0.39

7.6

0.39

Thiruvananthapuram

7.4

0.6

6.1

0.67

8.6

0.63

7.7

0.57

10.3

0.63

10.2

0.71

Chandigarh

10.6

0.53

10

0.37

10.8

0.48

10.4

0.27

10.8

0.55

10.6

0.42

Ranchi

8.9

0.41

8.3

0.33

9.1

0.39

8.6

0.31

8.4

0.65

9

0.78

Raipur

10.1

0.66

10.2

0.54

11

0.62

10.9

0.64

10.7

0.9

11.6

1.31

Note: The table provides estimates and standard errors (SE) for quantitative responses.


Table 3: Household Inflation Expectations – Current Perception, Three Months and One Year Ahead Expectations


Current Perception

Three Months ahead Expectation

One Year ahead Expectation

Mean

Median

Mean

Median

Mean

Median

Estimate

SE

Estimate

SE

Estimate

SE

Estimate

SE

Estimate

SE

Estimate

SE

Sep-23

9

0.09

8.4

0.11

9.7

0.09

9.1

0.17

9.3

0.11

9.9

0.17

Mar-24

8.7

0.09

8.1

0.13

9.6

0.09

9

0.16

9.5

0.1

9.8

0.19

May-24

8.7

0.1

8

0.13

9.8

0.1

9.2

0.19

9.6

0.12

9.9

0.19

Jul-24

8.9

0.09

8.2

0.12

9.8

0.1

9.4

0.24

9.8

0.11

10.1

0.09

Sep-24

8.6

0.09

8.1

0.13

9.6

0.1

9.2

0.23

9.6

0.12

10

0.14

Note: The table provides estimates and standard errors (SE) for quantitative responses.


Table 4: Households Expecting General Price Movements in Coherence with Movements in Price Expectations of Various Product Groups: Three Months Ahead and One Year Ahead

(Percentage of Respondents)

Survey period ended

Food

Non-Food

Households durables

Housing

Cost of services

Three Months Ahead

Sep-23

62

64.3

60.7

63.2

66.3

Mar-24

65.4

66.1

61.2

64.6

66.8

May-24

67.4

67.2

63.2

67.2

68

Jul-24

66.3

66.2

61.7

66.3

68.4

Sep-24

66

66.4

61.6

65.6

67.5

One Year Ahead

Sep-23

69.8

71.2

66.8

72.2

71.5

Mar-24

74.6

73.6

68.3

75

74.2

May-24

76.1

74.5

69.5

76.8

75

Jul-24

76.3

74.6

69.6

77.1

76.2

Sep-24

78.8

75.1

68.7

77.9

75.9


Table 5(a): Cross-tabulation of Number of Respondents by Current Inflation Perception and Three Months Ahead Inflation Expectations: Sep-24

Three Months Ahead Inflation Rate (per cent)

Current Inflation Rate (per cent)


<1

1-<2

2-<3

3-<4

4-<5

5-<6

6-<7

7-<8

8-<9

9-<10

10-<11

11-<12

12-<13

13-<14

14-<15

15-<16

>=16

No idea

Total

<1

5

0

0

1

1

0

0

0

0

0

0

0

0

0

0

0

0

0

7

1-<2

2

27

18

5

2

2

0

0

0

0

0

0

0

0

0

0

0

0

56

2-<3

0

3

111

81

30

8

1

1

0

0

0

1

1

0

0

0

0

1

238

3-<4

0

6

19

119

59

49

17

27

1

0

2

1

0

0

0

0

0

0

300

4-<5

1

2

9

17

133

92

62

10

11

1

2

1

1

0

0

0

0

1

343

5-<6

1

2

18

31

41

444

132

157

73

5

79

6

1

0

0

12

1

1

1004

6-<7

0

1

2

6

6

9

205

113

87

20

26

2

8

6

1

15

8

0

515

7-<8

0

0

1

1

6

15

9

232

114

54

63

2

3

1

1

0

1

0

503

8-<9

0

0

1

0

5

14

4

11

198

88

147

12

14

7

3

7

2

1

514

9-<10

0

0

1

0

0

2

0

3

3

89

73

186

14

3

3

3

12

5

397

10-<11

0

1

7

5

1

27

10

5

24

3

433

68

198

51

18

193

66

2

1112

11-<12

0

0

0

0

0

0

0

0

0

0

0

21

12

42

0

7

1

0

83

12-<13

0

0

0

2

0

0

0

1

2

0

2

3

34

12

31

25

2

0

114

13-<14

0

0

0

0

0

0

0

0

0

0

0

0

0

5

0

9

6

0

20

14-<15

0

0

0

0

0

0

0

0

0

0

2

0

0

1

5

1

3

0

12

15-<16

0

0

1

0

1

4

0

2

0

0

5

1

0

0

0

84

107

0

205

>=16

0

3

1

0

2

4

1

0

2

0

29

0

3

0

2

16

582

8

653

Total

9

45

189

268

287

670

441

562

515

260

863

304

289

128

64

372

791

19

6076


Table 5(b): Cross-tabulation of Number of Respondents by Current Inflation Perception and One Year Ahead Inflation Expectations: Sep-24

One Year Ahead Inflation Rate (per cent)

Current Inflation Rate (per cent)


<1

1-<2

2-<3

3-<4

4-<5

5-<6

6-<7

7-<8

8-<9

9-<10

10-<11

11-<12

12-<13

13-<14

14-<15

15-<16

>=16

No idea

Total

<1

2

0

2

1

0

1

0

0

0

0

1

0

0

0

0

0

0

0

7

1-<2

8

14

17

11

0

5

0

0

0

0

1

0

0

0

0

0

0

0

56

2-<3

49

3

39

53

50

27

7

2

1

0

4

0

0

1

0

0

0

2

238

3-<4

47

1

6

50

43

69

35

7

23

4

12

1

2

0

0

0

0

0

300

4-<5

55

1

3

5

61

75

61

34

30

4

7

1

4

0

0

1

1

0

343

5-<6

143

2

7

13

17

230

106

150

103

34

138

6

13

3

0

27

10

2

1004

6-<7

53

1

0

2

3

8

100

81

94

44

65

6

25

4

1

16

12

0

515

7-<8

47

0

2

1

1

9

2

125

79

81

98

11

27

3

4

10

3

0

503

8-<9

54

0

1

1

3

4

3

4

109

54

142

25

73

8

6

16

10

1

514

9-<10

13

0

0

0

0

1

0

3

19

33

71

38

152

29

6

15

13

4

397

10-<11

88

0

1

4

1

15

1

4

10

31

234

47

176

42

36

239

180

3

1112

11-<12

5

0

0

0

0

0

0

0

0

0

0

13

11

10

36

5

3

0

83

12-<13

7

0

0

0

0

0

0

1

1

1

2

0

22

9

35

30

6

0

114

13-<14

2

0

0

0

0

0

0

0

0

0

0

0

0

2

0

9

7

0

20

14-<15

0

0

0

0

0

0

0

0

0

0

1

0

0

1

3

1

6

0

12

15-<16

15

0

0

0

0

1

0

1

1

1

3

0

1

0

0

57

124

1

205

>=16

57

1

1

0

0

1

0

1

0

0

24

0

0

0

1

15

547

5

653

Total

645

23

79

141

179

446

315

413

470

287

803

148

506

112

128

441

922

18

6076


1 यह सर्वेक्षण भारतीय रिज़र्व बैंक के द्वारा द्विमाही अंतरालों पर संचालित किया जाता है; यह निकट भविष्य में मुद्रास्फीतिकारी दबावों पर उत्तरदाताओं से प्राप्त निदेशात्मक जानकारी प्रदान करता है और उनकी स्वयं की खपत प्रवृत्ति को प्रतिबिंबित करता है। सर्वेक्षण के परिणाम उत्तरदाताओं के विचारों को दर्शाते हैं, जो जरूरी नहीं कि रिज़र्व बैंक द्वारा मान्यता प्राप्त हों।

2 मुद्रास्फीति प्रत्याशाओं के सभी अनुमान मीडियन के रूप में दिए गए हैं, जब तक अन्यथा न कहा गया हो।

3 पिछले सर्वेक्षण चक्र के परिणाम बैंक की वेबसाइट पर अगस्त 08, 2024 को जारी किए गए थे। सर्वेक्षण के पिछले चक्रों के लिए यूनिट-स्तर के डेटा, बैंक के भारतीय अर्थव्यवस्था पर डेटाबेस (DBIE) पोर्टल (वेबलिंक: https://data.rbi.org.in/DBIE/#/dbie/home) पर 'यूनिट-स्तर डेटा' शीर्षक के अंतर्गत उपलब्ध हैं।

RbiTtsCommonUtility

प्ले हो रहा है
सुनें

संबंधित एसेट

आरबीआई-इंस्टॉल-आरबीआई-सामग्री-वैश्विक

RbiSocialMediaUtility

आरबीआई मोबाइल एप्लीकेशन इंस्टॉल करें और लेटेस्ट न्यूज़ का तुरंत एक्सेस पाएं!

Scan Your QR code to Install our app

RbiWasItHelpfulUtility

क्या यह पेज उपयोगी था?